3194
Glutamate imaging in schizophrenia prodrome1University of Alberta, Edmonton, AB, Canada, 2Radiology, 2nd Affiliated Hospital of Shantou University Medical College, Shantou, China, 3Mental Health Center of Shantou University, Shantou, China, 4Mathematics and Information Technology, Hanshan Normal University, Chaozhou, China, 5Hotchkiss Brain Institute, Calgary, AB, Canada, 62nd Affiliated Hospital of Shantou University Medical College, Shantou, China, 7Affiliated Hospital of Jiangnan University, Wuxi, China
Synopsis
The diagnosis of schizophrenia prodrome is significant since early intervention may prevent the development of full-blown schizophrenia. With increasing evidence indicating that glutamate is involved in the incidence of schizophrenia, we hypothesize that glutamate could be an imaging biomarker in the diagnosis of prodromal schizophrenia. We applied the glutamate CEST imaging technique in schizophrenic models and demonstrates that glutamate changes in different regions of the brain at an early stage, which may provide a powerful indicator of the diagnosis of schizophrenia prodrome. In addition, the glutamate CEST image had excellent correlation with standard MR spectroscopy.
INTRODUCTION
Schizophrenia is a chronic and severe mental illness characterized by the breakdown in the relation between thought, emotion, and behavior. Prodromal schizophrenia refers to the period of deterioration in heterogeneous subjective and behavioral symptoms that precede the onset of clinical psychotic symptoms1. The diagnosis of schizophrenia prodrome is of significance since the early intervention may prevent the development of full-blown schizophrenia. However, it is difficult to diagnose prodromal schizophrenia since patients may only exhibit minor behavioral changes or just anxiety2. Glutamate imaging is a novel technique based on chemical exchange saturation transfer (CEST), which has shown potential for diagnosis of neurological diseases in recent studies3,4. With increasing evidence indicating that glutamate is involved in the incidence of schizophrenia5,6, we hypothesize that glutamate could be an imaging biomarker in the diagnosis of prodromal schizophrenia.
METHODS
Animals: All animal experiments were approved by the Ethics Committee of Shantou University Medical College and conducted according to the guidelines of the Chinese Animal Welfare Agency. Twenty male C57BL/6 mice (Vital River Laboratories, Beijing, China) at 6 weeks of age were randomly assigned into the normal control (Nor) and cuprizone-exposed (CPZ) groups. In the CPZ group, cuprizone (0.2%, Sigma-Aldrich, St. Louis, MO, USA) was added to rodent chow for 2 weeks to induce the early stage of schizophrenia models in C57BL/6 mice. During the same period, mice in the control group were fed standard chow without cuprizone. Open-field, Y-maze, and social interaction tests were performed to measure the emotional and cognitive behaviors of the models.
MRI: Glutamate imaging, MRS, and conventional T2 weighted imaging were performed on a 7T animal scanner (Agilent Technologies, Santa Clara, CA), using the 1H proton volume and surface coil. Second order shimming was conducted before each scan to yield a water spectrum line width of 15–20 Hz. Glutamate imaging was obtained using an in-house CEST sequence with a gradient echo (GRE) readout. A rectangular continuous wave with saturation power of 3 µT and duration of 1000 ms was used for pre-saturation of glutamate in the brain. Other parameters were: TR/TE = 6.2/2.5 ms, slice thickness = 2 mm, NEX = 1, FOV = 34×34 mm2, imaging matrix=64×64, and bandwidth=50 kHz. An ultra-short echo time stimulated echo acquisition (STEAM) pulse sequence was used for acquisition of proton MRS (TR/TM/TE=5,000/12.72/2.35 ms; the spectral width=5,000 Hz; NEX=320; scan time=26 min).
Processing: The glutamate CEST data was processed using MATLAB 2017a (Mathworks, Natick MA, USA) using in-house software. B0 and B1 inhomogeneity were corrected using B0 and B1 maps generated from the same slice as described in our previous studies7,8. The GluCEST contrast was calculated by the following equation: GluCEST contrast = (Mref (−3ppm) – Msat (+3ppm)) / Mref (−3ppm).
All statistical analyses were performed with SPSS software (Version 22, Chicago, IL). The results were reported as mean ±standard deviation and P values less than 0.05 were considered statistically significant. Immunohistochemistry: Immunohistochemical examinations were performed after euthanasia, and brain specimens were evaluated for myelin basic protein (MBP), the pi form of glutathione-S-transferase (GST-pi), and nerve and glial antigen-2 (NG2). The staining protocols were consistent with our previous experiments9-11.
RESULTS and DISCUSSION
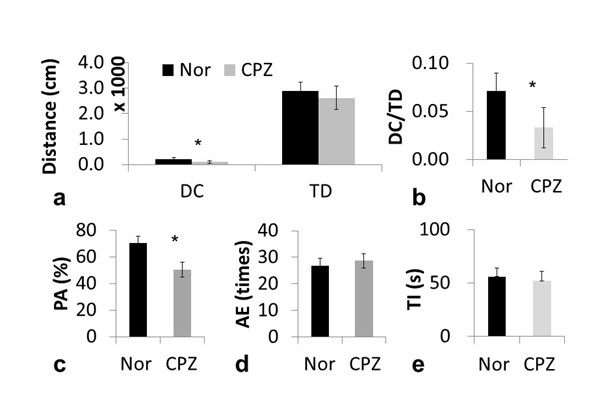
The open-field test results suggested a higher anxiety level and no locomotor activity in the CPZ group, while the Y-maze test suggested that the CPZ group had an impaired spatial working memory (Fig. 1). Glutamate images of phantoms proved that the signal intensity of the glutamate image was strictly related to glutamate concentration.
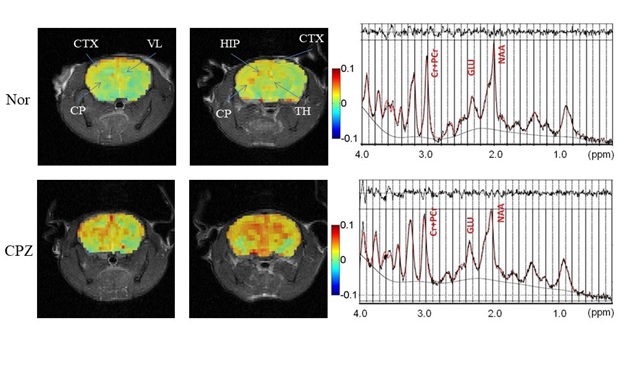
There were no lesions in the brain of the schizophrenia model in T2-weighted images. The glutamate CEST image could delineate the glutamate concentration in different subtle structures of the brain (Fig. 2), including the hippocampal region (HIP), caudoputamen (CP), cerebral cortex (CTX), lateral ventricle (VL), and thalamus (TH). Compared to controls, glutamate signals of prodromal schizophrenic models increased in the whole brain, especially in the CTX, HIP and TH, which were further verified by MRS. In MRS, the glutamate concentrations were 6.06 ± 0.28 mmol/L and 5.09 ± 0.43 mmol/L in the prodromal schizophrenia and normal controls, respectively.
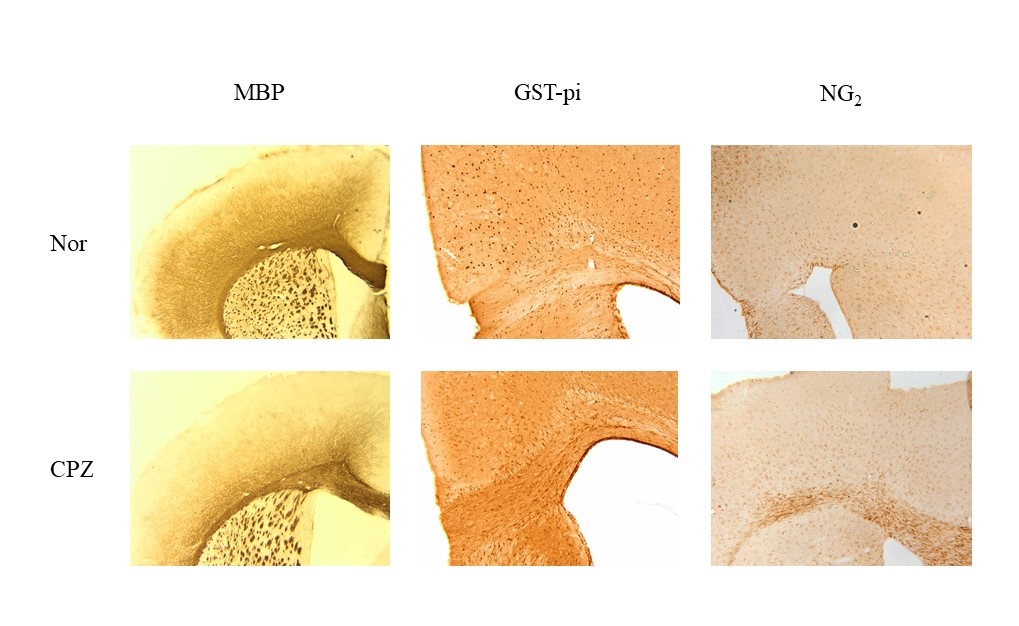
Immunohistochemistry showed the loss of oligodendrocytes and the proliferation of oligodendrocyte progenitor cells in schizophrenia models (Fig. 3), which agrees with our previous results11-13. These phenomena help explain the escalation of glutamate in schizophrenia models since previous studies demonstrated that glutamatergic synapses on oligodendrocyte precursor cells mediate excitotoxic degeneration14,15.
CONCLUSION
Our study applied a glutamate imaging technique in schizophrenic models and demonstrated that glutamate changes in different regions of the brain at an early stage, which may provide a powerful indicator of the diagnosis of schizophrenia prodrome.Acknowledgements
This study was supported in part by grants from Canadian Institutes of Health, the Natural Science Foundation of China (NSFC 81471730, 31870981), and the Natural Science Foundation of Guangdong Province (2018A030307057).References
1 Fusar-Poli, P., Yung, A., McGorry, P. & Van Os, J. Lessons learned from the psychosis high-risk state: towards a general staging model of prodromal intervention. Psychological medicine 44, 17-24 (2014).
2 Chan, M. K. et al. Development of a blood-based molecular biomarker test for identification of schizophrenia before disease onset. Translational psychiatry 5, e601 (2015).
3 Cai, K. et al. Magnetic resonance imaging of glutamate. Nature Medicine 18, 302-306, doi:10.1038/nm.2615 (2012). 4 Dai, Z. et al. Glutamate and GABA Imaging at 7 Tesla. International Society of Magnetic Resonance in Medicine 22nd annual meeting (2014).
5 Merritt, K., Egerton, A., Kempton, M. J., Taylor, M. J. & McGuire, P. K. Nature of Glutamate Alterations in Schizophrenia: A Meta-analysis of Proton Magnetic Resonance Spectroscopy Studies. JAMA psychiatry 73, 665-674, doi:10.1001/jamapsychiatry.2016.0442 (2016).
6 Howes, O., McCutcheon, R. & Stone, J. Glutamate and dopamine in schizophrenia: an update for the 21st century. Journal of psychopharmacology 29, 97-115 (2015).
7 Wu, R., Xiao, G., Zhou, I. Y., Ran, C. & Sun, P. Z. Quantitative chemical exchange saturation transfer (qCEST) MRI - omega plot analysis of RF-spillover-corrected inverse CEST ratio asymmetry for simultaneous determination of labile proton ratio and exchange rate. NMR Biomed 28, 376-383 (2015).
8 Sun, P. Z., Wang, Y., Dai, Z. Z., Xiao, G. & Wu, R. H. Quantitative chemical exchange saturation transfer (qCEST) MRI - RF spillover effect-corrected omega plot for simultaneous determination of labile proton fraction ratio and exchange rate. Contrast Media & Molecular Imaging 9, 268-275 (2014).
9 Xu, H. et al. Behavioral and neurobiological changes in C57BL/6 mice exposed to cuprizone. Behavioral neuroscience 123, 418 (2009).
10 Xu, H., Yang, H.-J., Rose, G. M. & Li, X.-M. Recovery of behavioral changes and compromised white matter in C57BL/6 mice exposed to cuprizone: effects of antipsychotic drugs. Frontiers in behavioral neuroscience 5, 31 (2011).
11 Zhang, H. et al. Locomotor activity and anxiety status, but not spatial working memory, are affected in mice after brief exposure to cuprizone. Neuroscience bulletin 29, 633-641 (2013).
12 Xuan, Y., Yan, G., Peng, H., Wu, R. & Xu, H. Concurrent changes in 1H MRS metabolites and antioxidant enzymes in the brain of C57BL/6 mouse short-termly exposed to cuprizone: Possible implications for schizophrenia. Neurochemistry international 69, 20-27 (2014).
13 Zhang, J. et al. Adenosine Promotes the Recovery of Mice from the Cuprizone-Induced Behavioral and Morphological Changes while Effecting on Microglia and Inflammatory Cytokines in the Brain. Journal of Neuroimmune Pharmacology 13, 412-425 (2018).
14 Bergles, D. E., Roberts, J. D. B., Somogyi, P. & Jahr, C. E. Glutamatergic synapses on oligodendrocyte precursor cells in the hippocampus. Nature 405, 187 (2000). 15 Pitt, D., Werner, P. & Raine, C. S. Glutamate excitotoxicity in a model of multiple sclerosis. Nature medicine 6, 67 (2000).
15 Pitt, D., Werner, P. & Raine, C. S. Glutamate excitotoxicity in a model of multiple sclerosis. Nature medicine 6, 67 (2000).
Figures