3193
In Vivo Evidence of Brain Glutamate Level Changes in a Multiple Sclerosis Rat Model Using Glutamate Chemical Exchange Saturation Transfer (GluCEST) Imaging1Faculty of Health Sciences and Brain & Mind Centre, The University of Sydney, Sydney, Australia, 2MR Core Laboratory, Asan Institute for Life Sciences, Asan Medical Center, Seoul, Korea, Republic of, 3Department of Nuclear Medicine, and Avison Biomedical Research Center, Yonsei University College of Medicine, Seoul, Korea, Republic of, 4Center for Bioimaging of New Drug Development, and MR Core Laboratory, Asan Institute for Life Sciences, Asan Medical Center, Seoul, Korea, Republic of, 5Department of Radiology, Asan Medical Center, University of Ulsan College of Medicine, Seoul, Korea, Republic of, 6Department of Convergence Medicine, Asan Medical Center, University of Ulsan College of Medicine, Seoul, Korea, Republic of
Synopsis
GluCEST imaging is a novel molecular MRI imaging technique that provides in vivo image contrast by glutamate concentration changes. In this abstract, we attempted to evaluate signal changes in hippocampus and corpus callosum at a multiple sclerosis rat model based on the quantified GluCEST signals. We also evaluated and compared the signals with those in the control group to demonstrate the glutamate signal differences. Our results clearly showed that GluCEST imaging could be a useful tool to evaluate the brain metabolism in the brain multiple sclerosis, and it provides quantitative results highly related with the in vivo glutamate level changes.
Purpose
Brain multiple sclerosis (MS) is a demyelinating disease of the central nervous system, which leads to varying extents of neuroaxonal injury.1,2 There is an increasing evidence that glutamate (Glu) is involved in the pathophysiology of MS in humans and animal models, and recent studies have revealed that gray matter disease is heavily involved with MS, although MS has long been regarded as a pure white matter disease.3-5 Therefore, the evaluation of glutamate level changes can be important to provide one of the essential biomarkers that estimates the brain metabolisms in MS. In recent years, chemical exchange saturation transfer (CEST) has become a new contrast enhancement technique that enables indirect detection of molecules with exchangeable protons and exchange-related properties.6-9 The purpose of this study is to visualize and quantitatively evaluate the glutamate level changes measured by glutamate CEST (GluCEST) imaging technique, within hippocampus and corpus callosum in a rat MS model. The GluCEST signals were also compared with those in the control group to demonstrate glutamate signal differences.Methods
MRI experiment: Eight male Wistar rats were divided into two groups (MS group, n=4 and Control group (CTRL), n=4). All surgical procedures were performed under inhalation anesthesia using 1.5-3.0% isoflurane with a 5:5 mixture of N2O and O2 gas. To induce demyelinated lesions, stereotaxic injections of a L-α-lysophosphatidylcholine solution [10μL of 2% (wt/vol); L-α-lysophosphatidylcholine from egg yolk; Sigma-Aldrich, USA] were performed in the hippocampus.10-11 The L-α-lysophosphatidylcholine solution was dissolved in sterile 0.9% NaCl and 0.01 M guanidine to increase its solubility and diffusivity.10 The stereotaxic injection coordinates were measured from the bregma and were typically 5-mm posterior, 3-mm lateral, and 2.9-mm deep from the skull. All MRI data were obtained from 7T Bruker scanner after 17 days of modeling. RARE sequence-based CEST dataset with 19 frequency offsets (S0 image and −4.5~+4.5 ppm at intervals of 0.5ppm) were acquired using a continuous-wave RF saturation pulse (power=5.6μT, saturation time=1s). For B0 correction, WASSR dataset with 29 frequency offsets was acquired from −0.7 to 0.7ppm at intervals of 0.05ppm using 0.3μT RF saturation power. For B1 correction, B1 map using double flip-angle (30° and 60°) was acquired.7
Data processing: The GluCEST image was calculated using the B0 and B1 corrected datasets with the following approaches: The GluCEST contrast was computed by subtracting the normalized magnetization signal at the 3.0ppm from the magnetization at the corresponding reference frequency symmetrically at the upfield from water; [Ssat(−3.0ppm) − Ssat(+3.0ppm)]/Ssat(−3.0ppm).7,8 Four ROIs for the calculation of the GluCEST values were set in the left- and right-side hippocampus and corpus callosum regions, respectively. For statistical analysis, Wilcoxon rank-sum test was used between the control and MS groups on each left- and right-side of the two brain regions.
Results and Discussion
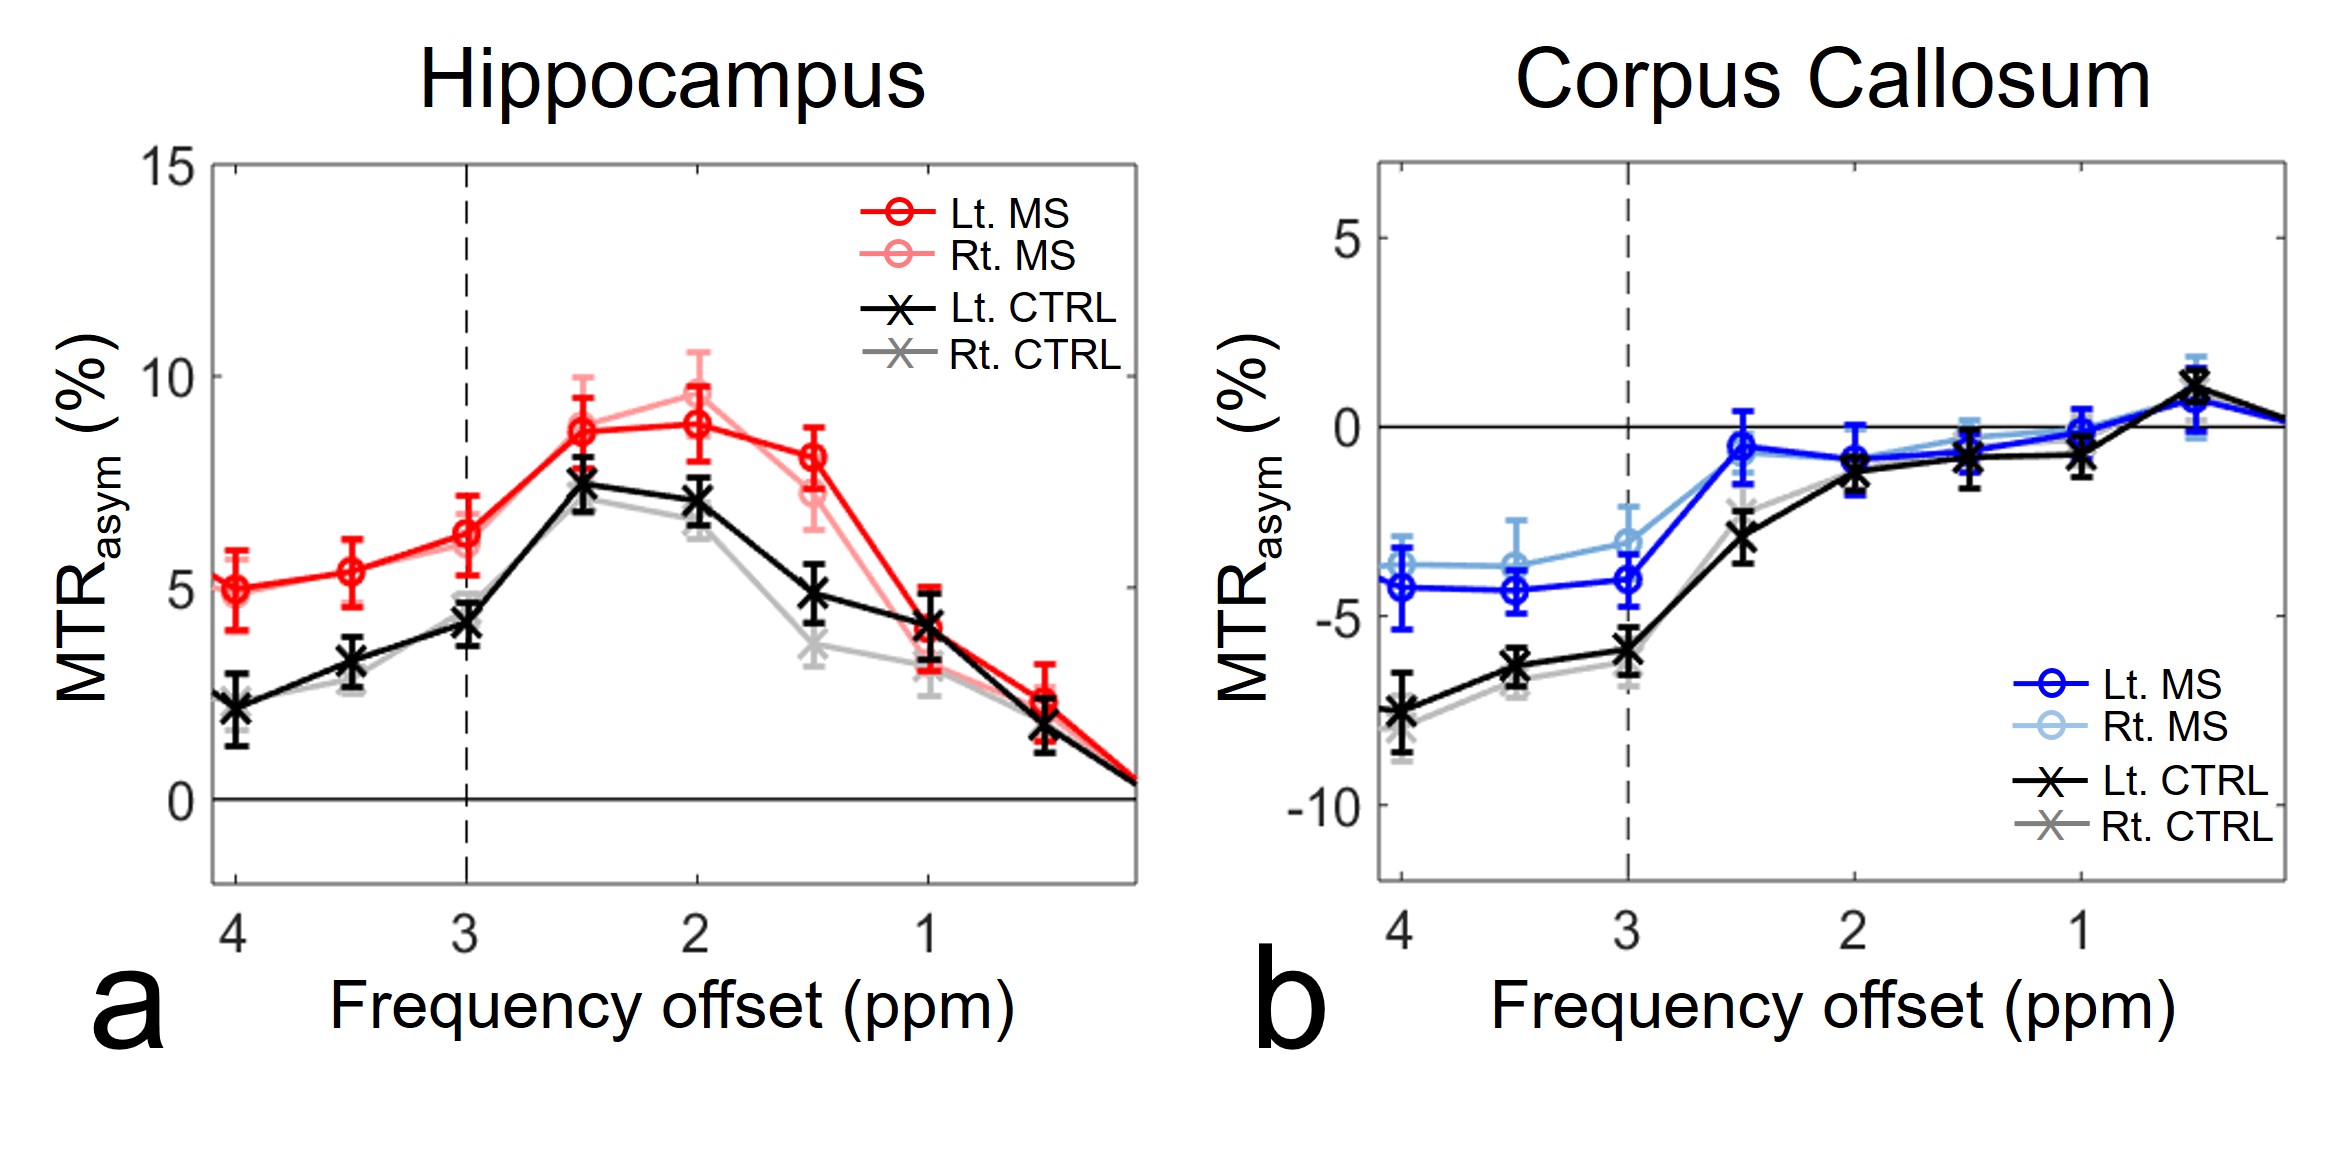
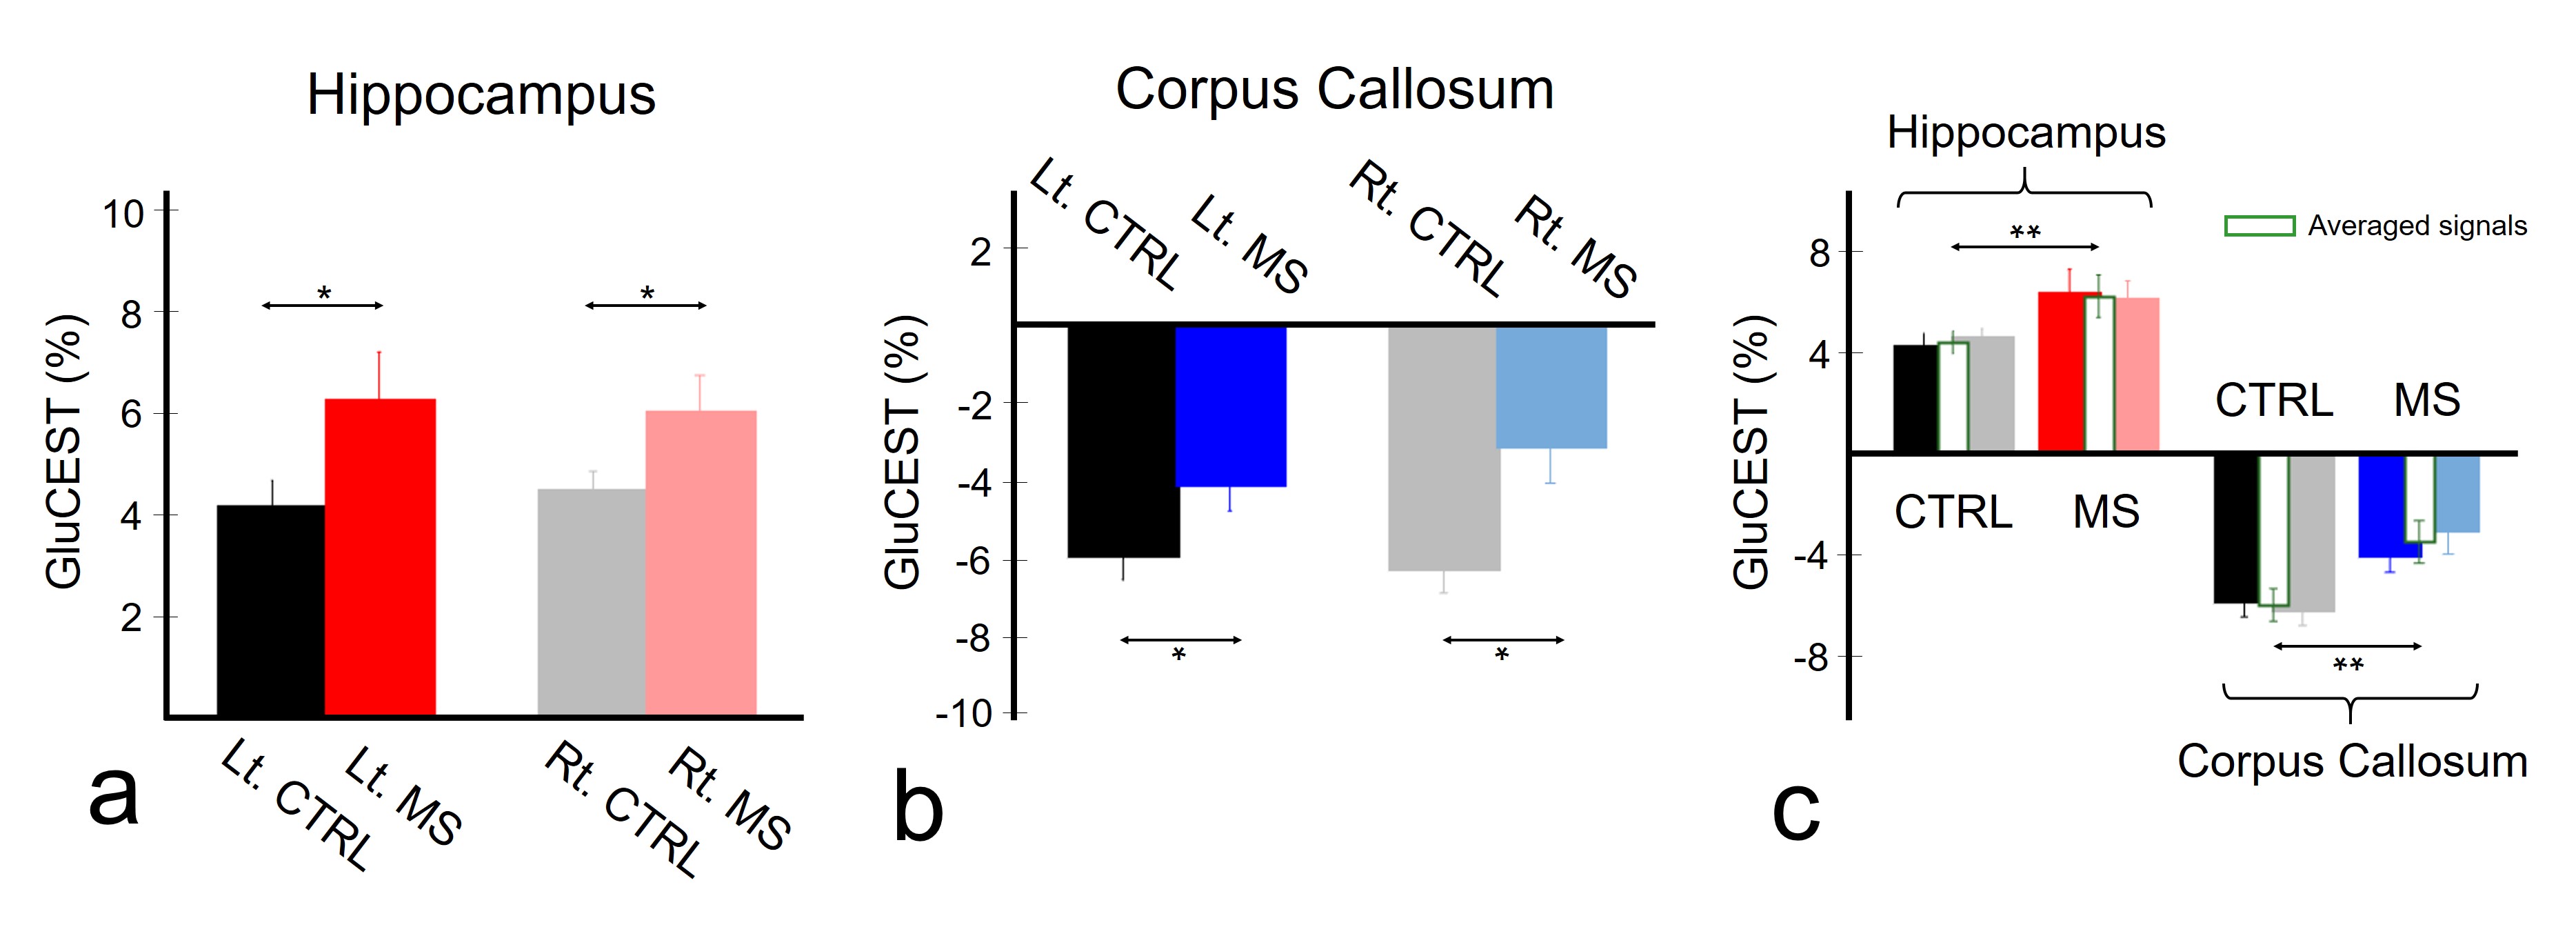
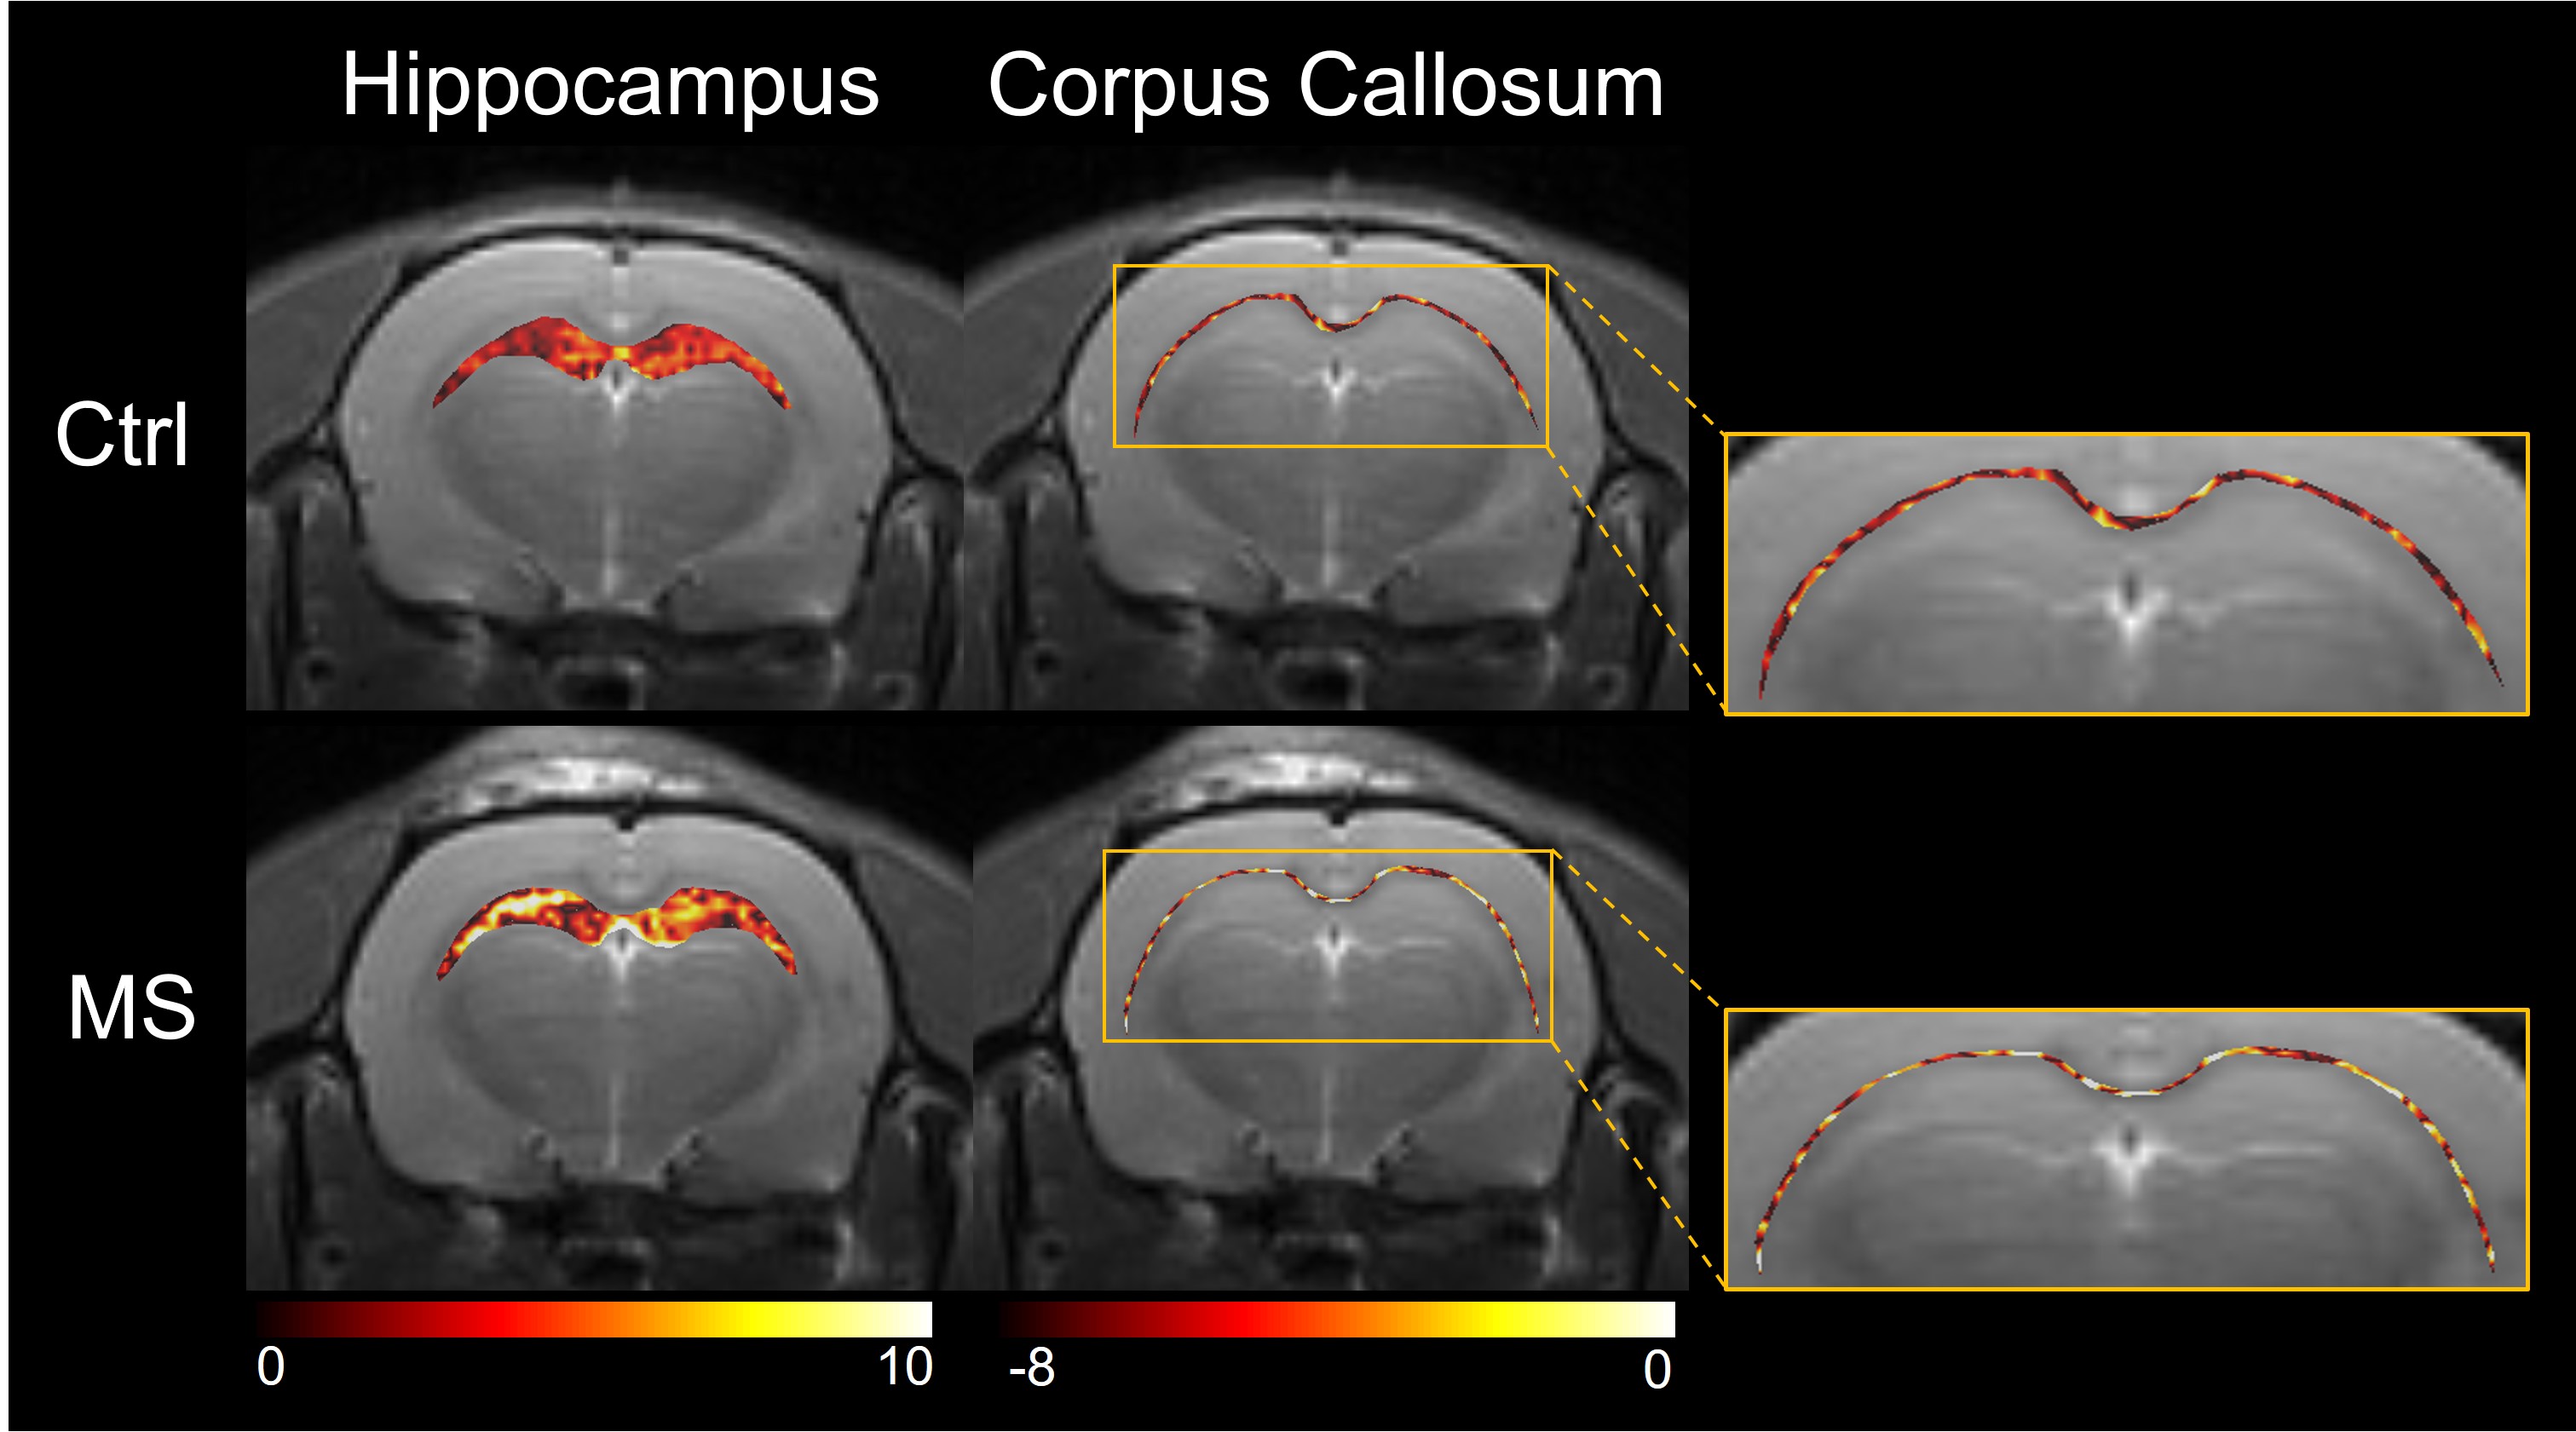
The MTRasym spectra revealed significant differences between the MS and control groups in the left- and right-side of the hippocampus (Fig. 1a) and corpus callosum (Fig. 1b), indicating that the spectra from the left- and right-side in each brain region had a stable status without any significant differences. The CEST signals of glutamate at 3.0 ppm in the spectra at both the brain regions were increased in the MS than in the CTRL. The calculated GluCEST signals in both the hippocampus regions (Fig. 2a) revealed statistically significant differences between the two groups [all P<0.05; CTRL/MS: 4.178±0.507/6.276±0.948 (Lt. Hippocampus), and 4.493±0.375/6.042±0.722 (Rt. Hippocampus)]. In the corpus callosum region (Fig. 2b), the values also indicated significance between the two groups [all P<0.05; CTRL/MS: −5.876±0.6351/−4.031±0.711 (Lt. Corpus Callosum), and −6.199±0.651/−3.058±0.973 (Rt. Corpus Callosum)]. The averaged values of the left and right regions of the hippocampus and corpus callosum in each group are shown in Fig. 2c (4.336±0.446/6.159±0.790; and −6.038±0.620/−3.545±0.945 for the CTRL and MS groups, respectively), and the values were also significant in each group (all P=0.001), as indicated in Fig. 2a and 2b. Notably, as expected, these increased glutamate signal levels demonstrated the same pattern of results from the concentration changes using proton MRS as in some previous studies.2,5 On GluCEST maps that were overlaid on the unsaturated CEST image, in the hippocampus and corpus callosum regions (Fig. 4), showed hyperintensities in the MS than in the CTRL.Conclusions
The application of GluCEST imaging reveals a significant image contrast in MS, which is highly related to glutamate level changes. The temporal evolution of the signal changes from GluCEST metric clearly indicates that GluCEST imaging could be a useful tool and a biomarker to estimate the brain metabolism status in a pre-clinical MS model.Acknowledgements
This study was supported by grants from the Basic Science Research Program through the National Research Foundation of Korea [NRF-2018R1C1B6004521; NRF-2017R1A6A3A03012461; and NRF-2018R1A2B2007694] and the Korea Health Technology R&D Project through the Korea Health Industry Development Institute [HI14C1090], funded by the Ministry of Health & Welfare, Republic of Korea. This study was also supported by the 2017 University of Sydney Postdoctoral Fellowship Scheme (192237).References
1. Geurts JJ, Reuling IE, Vrenken H, Uitdehaag BM, Polman CH, Castelijns JA, Barkhof F, Pouwels PJ. MR spectroscopic evidence for thalamic and hippocampal, but not cortical, damage in multiplesclerosis. Magn Reson Med. 2006;55(3):478-483.
2. Azevedo CJ, Kornak J, Chu P, Sampat M, Okuda DT, Cree BA, Nelson SJ, Hauser SL, Pelletier D. In vivo evidence of glutamate toxicity in multiple sclerosis. Ann Neurol. 2014;76(2):269-278.
3. Kidd D, Barkhof F, McConnell R, Algra PR, Allen IV, Revesz T. Cortical lesions in multiple sclerosis. Brain. 1999;122(Pt 1):17-26.
4. Pitt D, Werner P, Raine CS. Glutamate excitotoxicity in a model of multiple sclerosis. Nat Med. 2000;6:67–70.
5. Srinivasan R, Sailasuta N, Hurd R, Nelson S, Pelletier. Evidence of elevated glutamate in multiple sclerosis using magnetic resonance spectroscopy at 3T. Brain. 2005;128(Pt 5):1016-1025.
6. Guivel-Scharen V, Sinnwell T, Wolff S, Balaban R. Detection of proton chemical exchange between metabolites and water in biological tissues. J Magn Reson. 1998;133(1):36-45.
7. Cai K, Haris M, Singh A, Kogan F, Greenberg JH, Hariharan H, Detre JA, Reddy R. Magnetic resonance imaging of glutamate. Nat Med. 2012;18(2):302-306.
8. Bagga P, Crescenzi R, Krishnamoorthy G, Verma G, Nanga RP, Reddy D, Greenberg J, Detre JA, Hariharan H, Reddy R. Mapping the alterations in glutamate with GluCEST MRI in a mouse model of dopamine deficiency. J Neurochem. 2016;139(3):432-439.
9. By S, Barry RL, Smith AK, Lyttle BD, Box BA, Bagnato FR, Pawate S, Smith SA. Amide proton transfer CEST of the cervical spinal cord in multiple sclerosis patients at 3T. Magn Reson Med. 2018;79(2):806-814.
10. Deloire-Grassin MS, Brochet B, Quesson B, Delalande C, Dousset V, Canioni P, Petry KG. In vivo evaluation of remyelination in rat brain by magnetization transfer imaging. J Neurol Sci. 2000;178(1):10-16.
11. Lehto LJ, Albors AA, Sierra A, Tolppanen L, Eberly LE, Mangia S, Nurmi A, Michaeli S, Gröhn O. Lysophosphatidyl choline induced demyelination in rat probed by relaxation along a fictitious field in high rank rotating frame. Front Neurosci. 2017;11:433.
Figures