3190
Mild neonatal hypoxia-ischemia in rats induces long-term behavior and cerebellar anormalities1Department of Pediatrics, University of Geneva, Geneva, Switzerland, 2Center for Biomedical Imaging (CIBM), Ecole Polytechnique Fédérale de Lausanne (EPFL), Lausanne, Switzerland, 3Faculty of Medicine, University of Geneva, Geneva, Switzerland
Synopsis
How mild neonatal hypoxia-ischemia (HI) in very immature rats affects cerebellum remains not well understood. We showed cerebellar abnormalities, including behavior, motor function and metabolites, in adult rats after HI at postnatal day 3.
Introduction
Cerebellum is not classically considered a brain region vulnerable to hypoxic-ischemic insults (HI) due to its relative distance from the injury site in initial phases of injury (only suffering from the systemic hypoxia). Recent data have suggested cerebellar injury following experimental HI (1). However, despite its significance in not only motor function but also cognitive and behavior aspects, to the best of our knowledge, the impact of cerebral HI in very immature rat pups on the cerebellum development was not previously studied. This study was conducted in order to test evaluate long-term cerebellar damage following neonatal HI in very immature rats, using 1H MRS along with behavior and motor function tests.Methods
At postnatal day 3 (PND3), pups (Wistar) were submitted to 30-min hypoxic-ischemic injury in the right forebrain as previously (2). At adult age (as from PND45), animals were subjected to behavior and the locomotor tests, open field (OF), Cylinder test (CYL) and bean balance, as described previously (2).
1H MRS were carried out in a horizontal, 14.1-T/26-cm magnet (Magnex Scientific, UK), equipped with a 12-cm inner-diameter gradient (400 mT/m in 200 μsecs). A home-built quadrature surface coil with two geometrically decoupled single-turn loops (16-mm inner diameter), resonating at 600 MHz radio frequency (RF), was used as RF transceiver. Briefly, as previously described (3), animals (15 female (8 HI) and 10 male (7 HI)) were studied.
Once multislice T2-weighted
images were acquired for locating the volume of interest (VOI), e.g. cerebellar hemisphere, both first- and second-order shim terms over the VOI
were adjusted accordingly using FASTMAP (4) and resulted in water linewidth < 20 Hz
for a 15μL volume. Localized 1H-MR spectra of both
cerebellar hemispheres were obtained using the SPECIAL technique (5), TE/TR =
2.8/4000 msecs and 240 averages in combination with outer volume suppression
and VAPOR water suppression. The corresponding non-water
suppressed spectra (8 averages) were acquired for further quantification
(assuming 80% water in both hemispheres of the cerebellum (6).
In this study,
metabolites were processed and analyzed using LCModel (7). In particular, acetate
(Ace), alanine (Ala), ascorbate (Asc), aspartate (Asp), creatine (Cr), myo-inositol
(Ins), γ-aminobutryric acid (GABA), glutamine (Gln), glutamate
(Glu), glycine (Gly), glycerophocholine (GPC), glutathione (GSH), lactate (Lac),
Nacetylaspartate (NAA), Nacetylaspartylglutamate (NAAG), phosphocholine (PCho),
phosphocreatine (PCr) phosphoethanolamine (PE), scyllo-inositol (scyllo),
macromolecules (Mac) and taurine (Tau) were quantified. Summed concentrations, e.g. Glu+Gln, PCr+Cr, GPC+PCho and
NAA+NAAG, were also calculated. Based on our preliminary data, Scyllo and Ace were noticeably less than 0.2mmol/g among all spectra of both groups and
considered to be non-detectable.
Results and discussion
Motor function involving cerebellum was evaluated at PND45 caused by neonatal HI at PND3. Table 1 summarizes all relating behavior and locomotor outcomes. Further two-way ANOVA on factors of treatment and behavioral outcomes revealed substantial difference in the treatment factor (p=0.01).
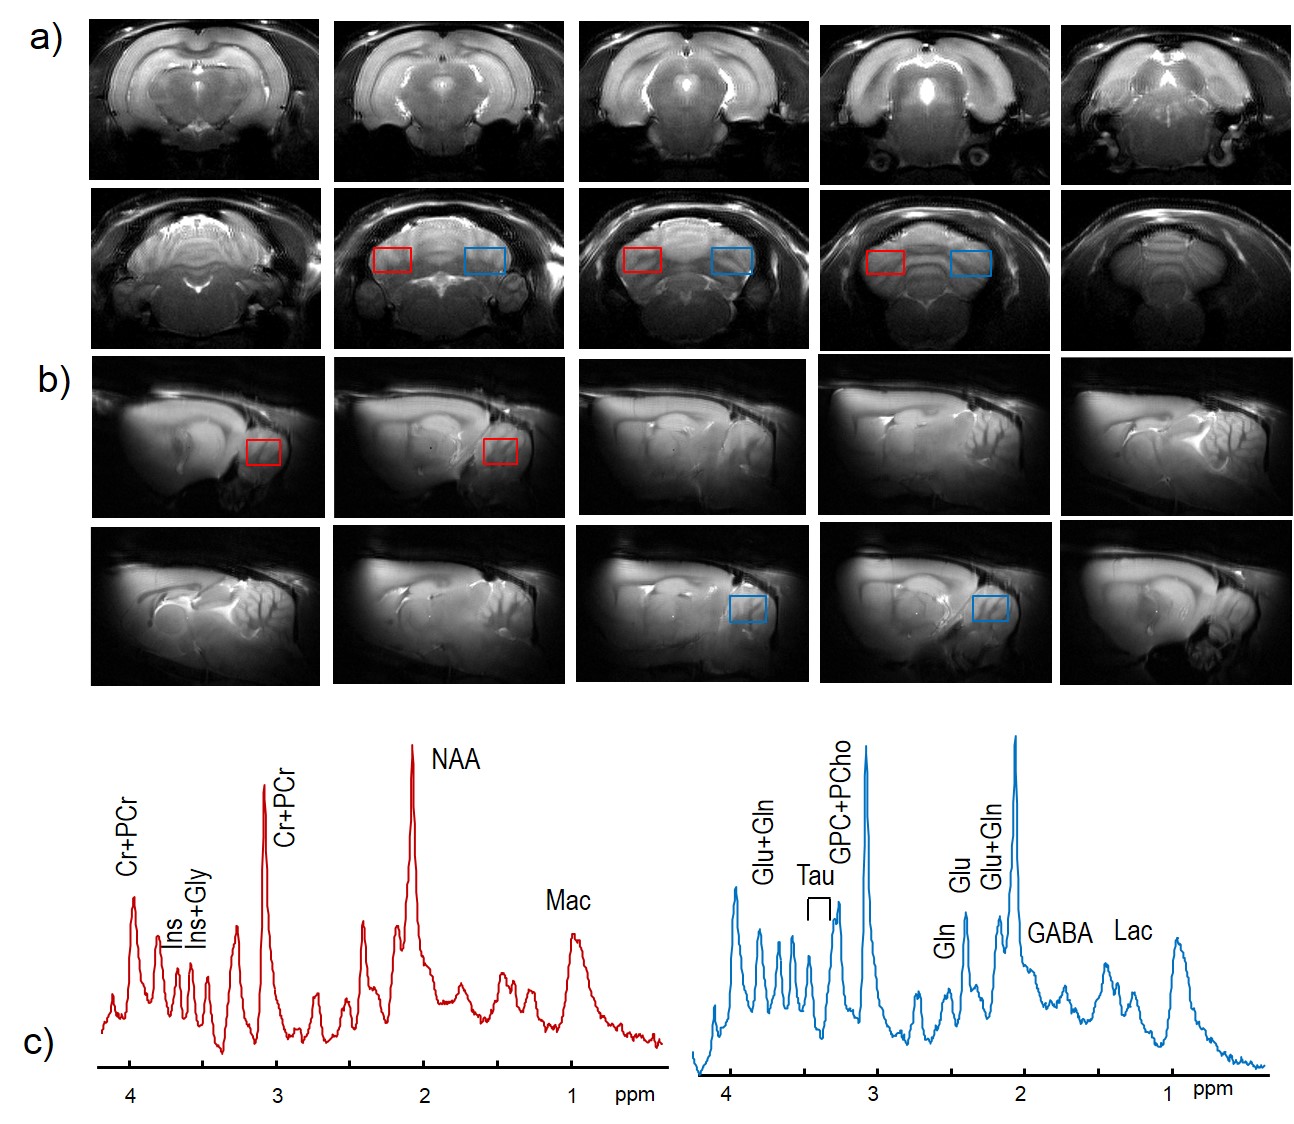
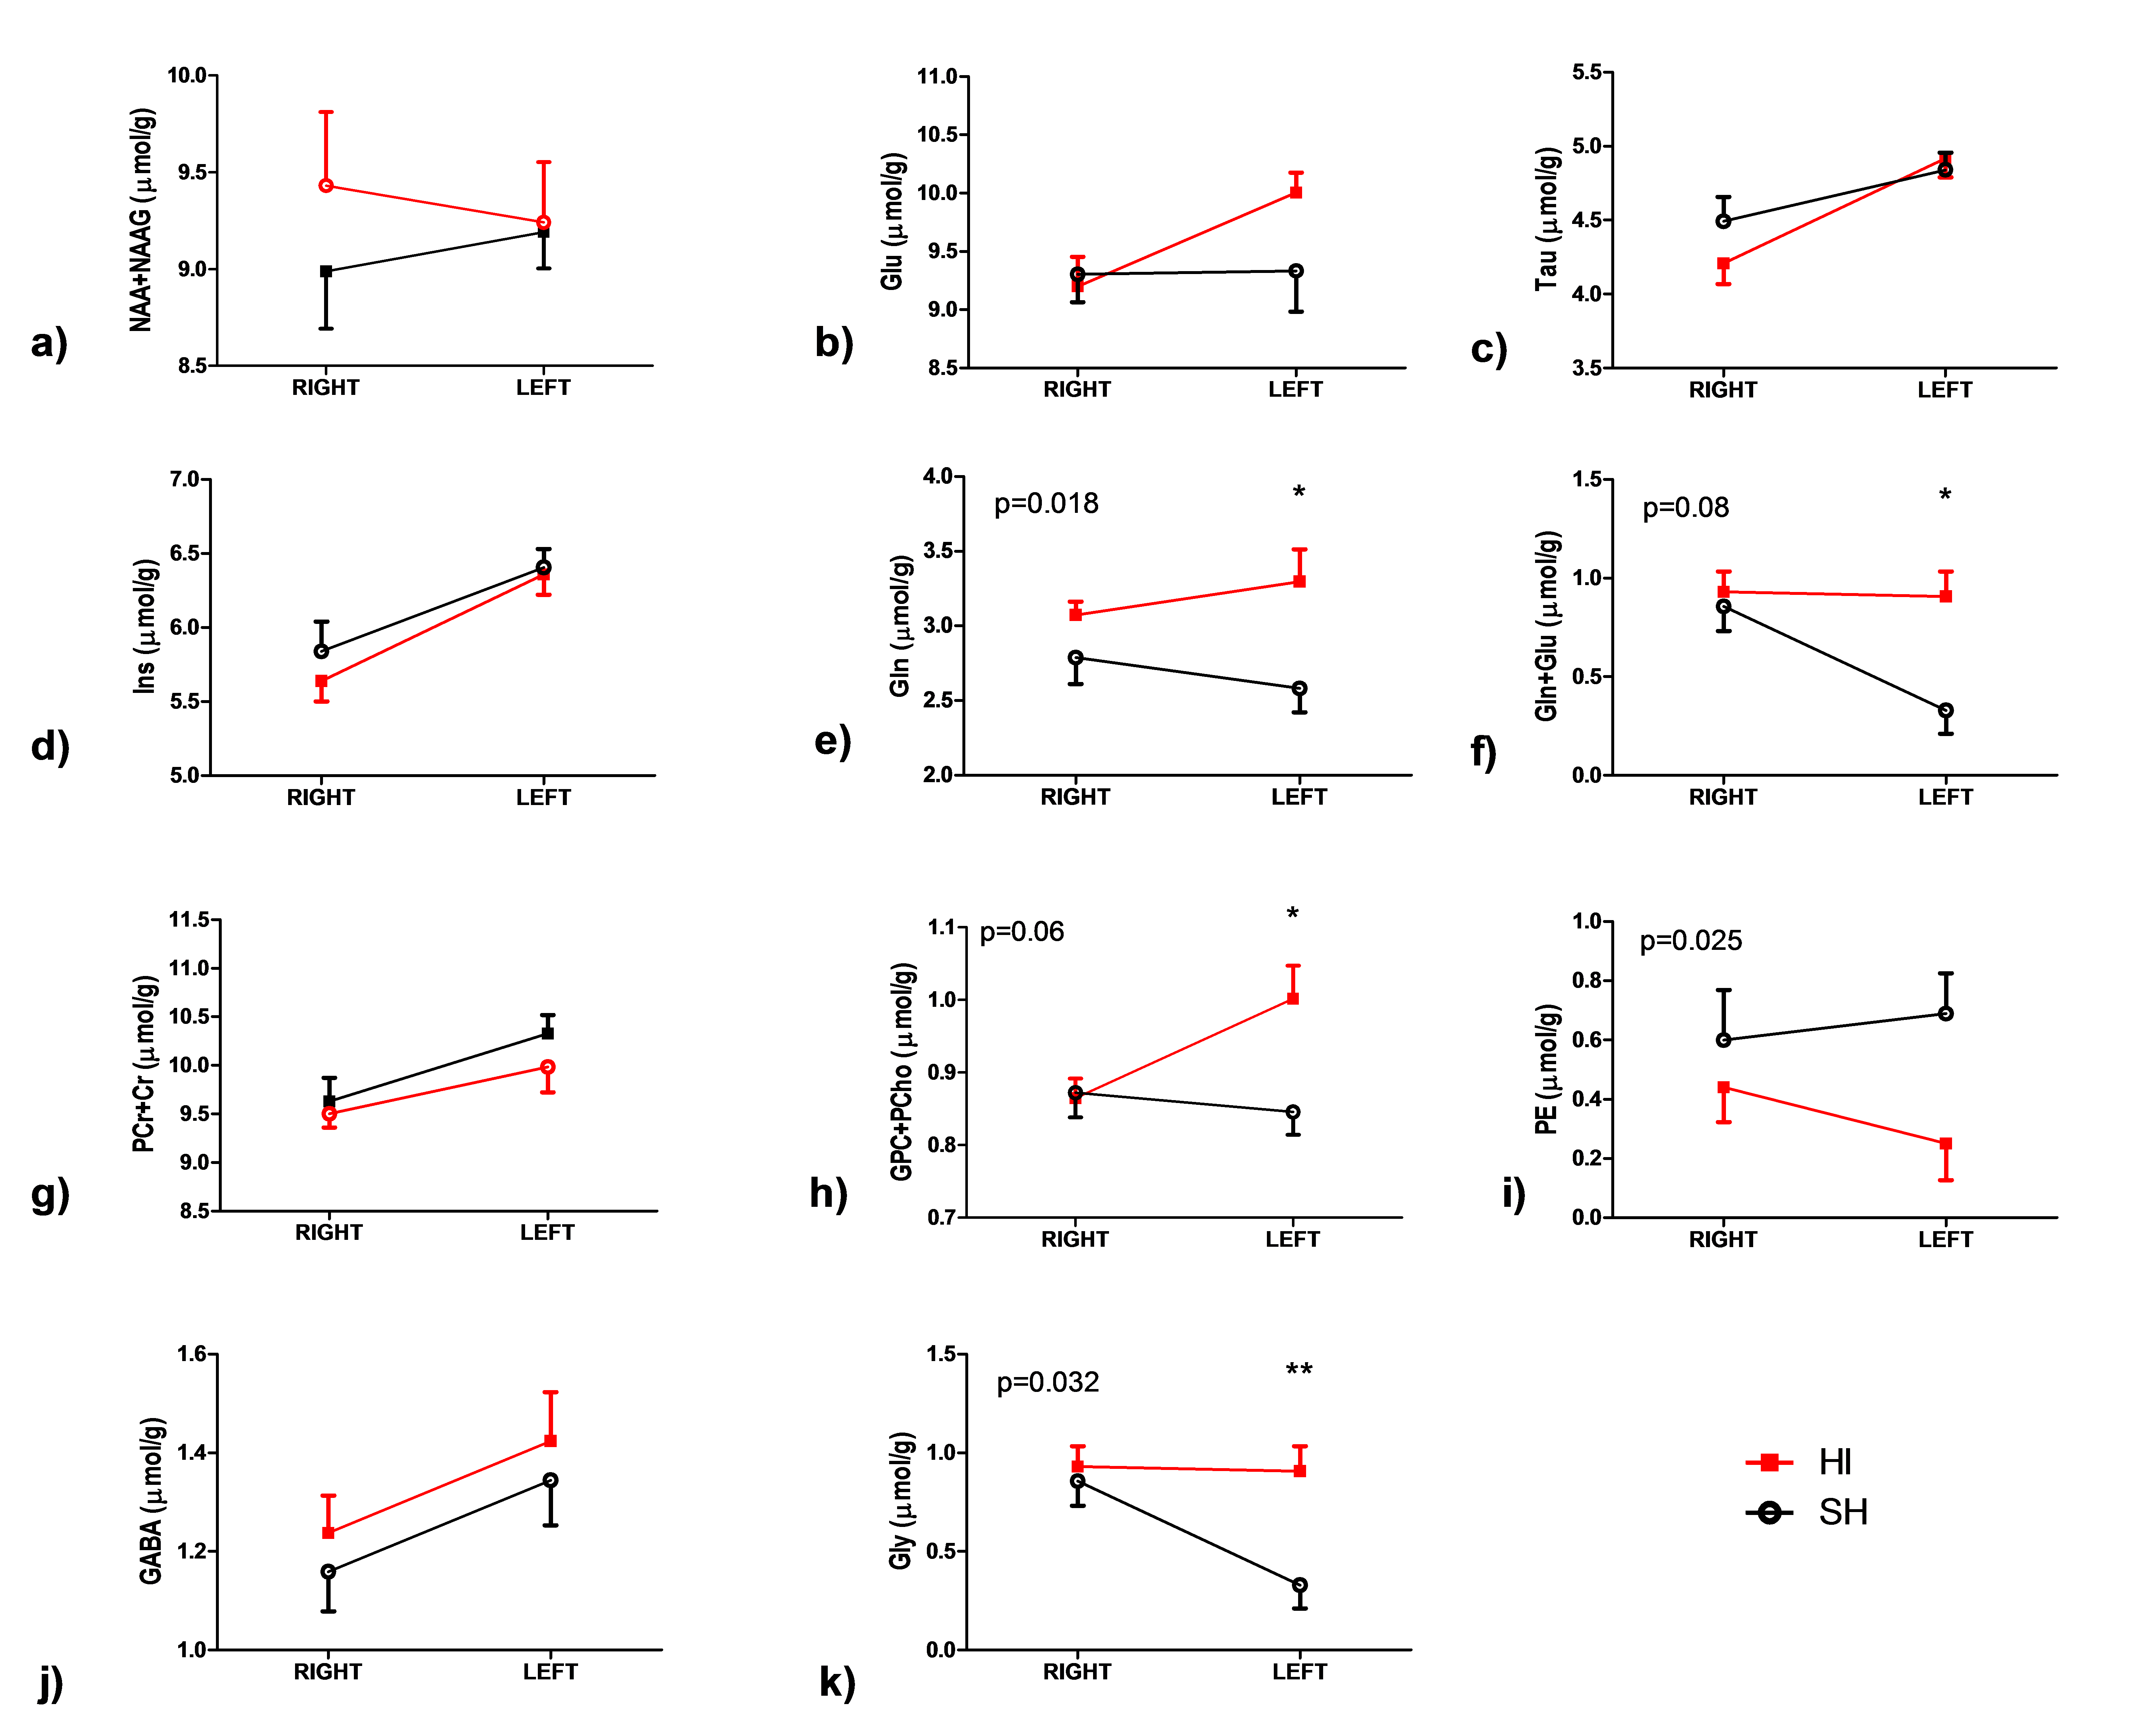
In order for searching clinically relevant information on long-term cerebellar metabolism following neonatal HI at PND3 and to evaluate potential in vivo biomarkers, noninvasive 1H MRS was applied on both cerebellar hemispheres (Figure 1) of neonatal HI and SH rats at PND55-60. Paired t-tests resulted that most metabolites in the SH group were similar between right and left hemispheres of the cerebellum except some metabolic differences, e.g. Cr, GSH , Gly and Ins (Figure 2, Table 2). In the HI group, differences between the right and left hemispheres of the cerebellum were also observed, e.g. Glu , Ins , Tau , Glu+Gln , GPC+PCho (and Cr+PCr . To our interest, the observed differences of GSH and Gly between two hemispheres in the SH group were abolished (p≥0.8) in the HI group (Figure 2). Unpaired t-tests revealed noticeable changes in the left cerebellum two months after neonatal HI when compared to the corresponding SH results (Figure 2). Further two-way ANOVA confirmed treatment differences occurred in GPC+PCho (p=0.06) and even more so in Gln (p=0.018) and PE (p=0.025),as shown in Figure 2.
This study, to our knowledge, is the first to report extended effects of mild neonatal HI on cerebellar metabolism with extension to neuropathology of rats at their adulthood age. Taking together with behavior and motor performances, our in vivo 1H MRS findings suggest that effects of neonatal HI at PND3 on cerebellar metabolism of rats remains at adulthood. Collectively, our study provides relevant in vivo evidences that neonatal HI, one of prematurity disorders, affects brain pathology towards adulthood.
Acknowledgements
EF Sanches received a Swiss Excellence Scholarship for Foreign Scholars to perform the study in SVZ laboratory. This study was supported by the Swiss National Fund N° 33CM30-124101/140334 and the Fondation pour Recherches Médicales, Geneva, the Center for Biomedical Imaging (CIBM) of the UNIL, UNIGE, HUG, CHUV and EPFL, and the Leenaards and Jeantet FoundationsReferences
1. Biran V et al. Cerebellar abnormalities following hypoxia alone compared to hypoxic-ischemic forebrain injury in the developing rat brain Neurobiol Dis. 2011 Jan;41(1):138-46.
2. Sanches, EF et al Sexual dimorphism and brain lateralization impact behavioral and
histological outcomes following hypoxia-ischemia in P3 and P7 rats Neuroscience. 2015 Apr 2;290:581-93
3. Lei H et al. Evolution of the neurochemical profile after transient focal cerebral ischemia in the mouse brain J Cereb Blood Flow Metab. 2009 Apr;29(4):811-9
4. Gruetter R and Tkac I Field mapping without reference scan using asymmetric echo-planar techniques Magn Reson Med. 2000 Feb;43(2):319-23
5. Mlynárik V et al. Localized short-echo-time proton MR spectroscopy with full signal-intensity acquisition Magn Reson Med. 2006 Nov;56(5):965-70
6. McBride DW et al. A composite neurobehavioral test to evaluate acute functional deficits after cerebellar haemorrhage in rats. J Cereb Blood Flow Metab. 2018 Mar;38(3):433-44
7. Provencher SW Automatic quantitation of localized in vivo 1H spectra with LCModel.NMR Biomed. 2001 Jun;14(4):260-4.
Figures