3189
Evaluation of the magnetization exchange in catecholaminergic nuclei at 3 T1Alzheimer Center Limburg, School for Mental Health and Neuroscience, Maastricht University, Maastricht, Netherlands, 2Department of Cognitive Neuroscience, Faculty of Psychology and Neuroscience, Maastricht University, Maastricht, Netherlands, 3Department of Radiology, Division of Nuclear Medicine and Molecular Imaging, Massachusetts General Hospital/Harvard Medical School, Boston, MA, United States
Synopsis
Magnetization Transfer (MT) weighted gradient echo techniques can be used favourably instead of typical spin-echo based approaches for high-resolution imaging of the Locus Coeruleus (LC), which is of interest in various diseases. Examining the MT properties of the LC is needed for the development of quantitative biomarkers. Employing a fast, high-resolution acquisition sequence we show that it is possible to obtain data to fit a two-pool MT exchange model in the LC. The LC shows differential MT behavior compared to other catecholaminergic and adjacent GM regions consistent with reduced macromolecular content.
Introduction
The Locus Coeruleus (LC) is a neuromelanin (NM) rich nucleus in the brainstem that is suggested to be involved early in Alzheimer’s disease [1-3]. LC shows decreased magnetization transfer (MT) saturation compared to adjacent grey matter, similar to the also catecholaminergic and neuromelanin-rich Substantia Nigra (SN). Understanding the MT properties of LC can offer insight in the biological properties that produce MRI contrast [4]. This may eventually allow the development of quantitative LC markers [5, 6]. Examining the MT properties of the LC is challenging due to the combination of small size of the structure (which necessitates high-resolution acquisitions) and intense presaturation used in MT-weighted acquisitions. In this study, we employed an efficient, high-resolution MT-weighted Turbo Flash (MT-TFL) [5, 7] sequence to estimate a two-pool MT model in the neuromelanin-rich areas of the brain compared to adjacent grey matter reference regions.Methods
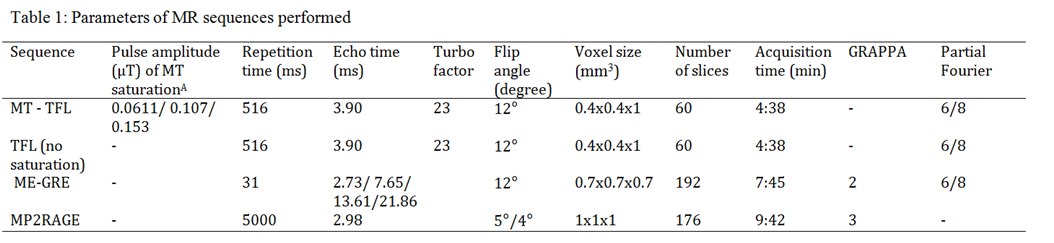
Four healthy volunteers (two female, median age (range) = 23.5 (21 - 27) y.o.) were scanned in a 3 T Prisma (Siemens Healthineers, Erlangen, Germany). An MT-TFL sequence was used, consisting of a multi-shot 3D readout with center-out k-space sampling, where each shot was preceded by a train of off-resonant Gaussian sinc pulses, with adjustable amplitudes and offset frequencies [5]. A set of 7 frequency offsets [210, 430, 860, 1280, 1710, 4280, 10000 Hz] and 3 pulse amplitudes [50, 100, 150 V] (Β1 per pulse = 2.25, 4.5, 6.75 μΤ; Continuous wave power equivalent of saturation train = 0.061, 0.0107, 0.153 μΤ) were applied in a randomized manner (21 scans). Matching TFL images without MT weighting were acquired to obtain MT-ratio (MTR) images. A multi-echo gradient echo (ME-GRE) scan and an MP2RAGE were acquired to determine T2* and T1 relaxation times. Acquisition parameters are listed in detail in (Table 1). Hyperintense voxels in the LC and SN regions were selected manually along with a similar-sized reference ROI in the pons. The MTR and T1 values within the ROIs (average of left and right segmentations) were entered into a two-pool MT model with the Quantitative Magnetization Transfer MRI Optimization Toolbox [8].Results
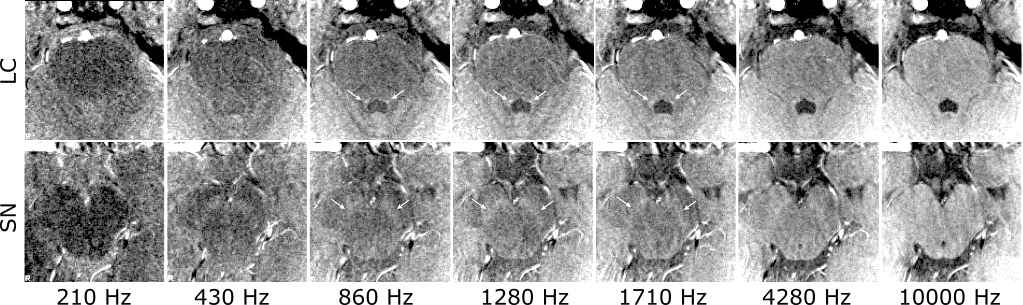
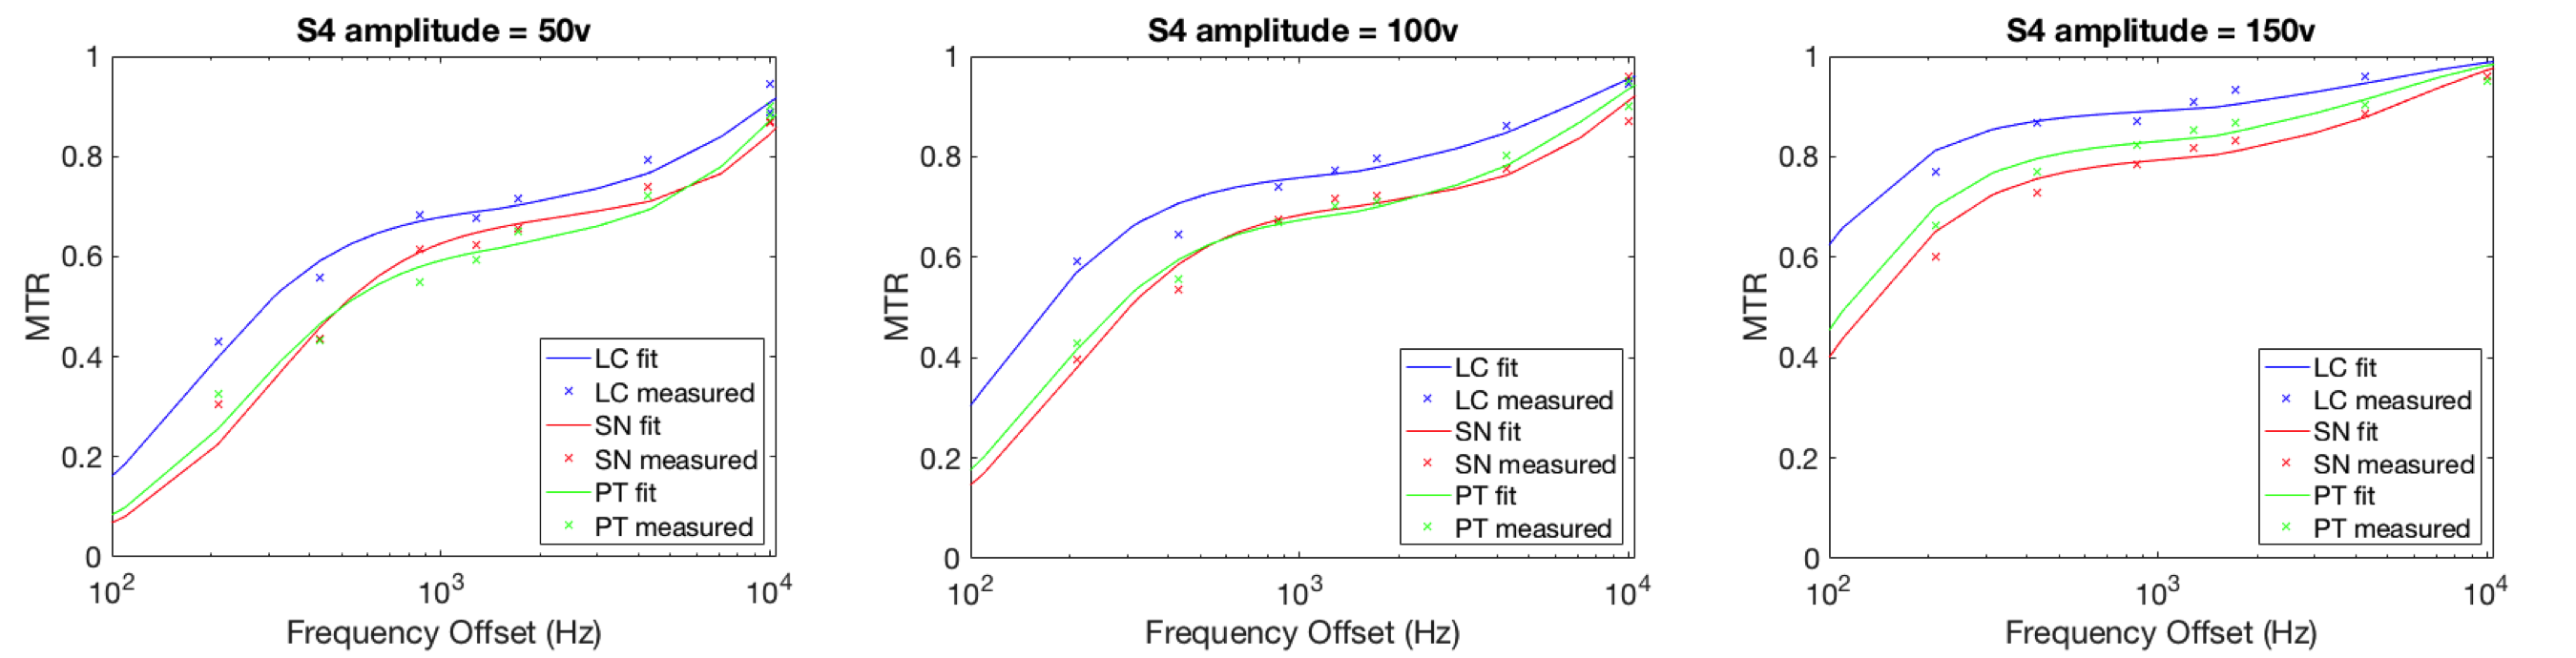
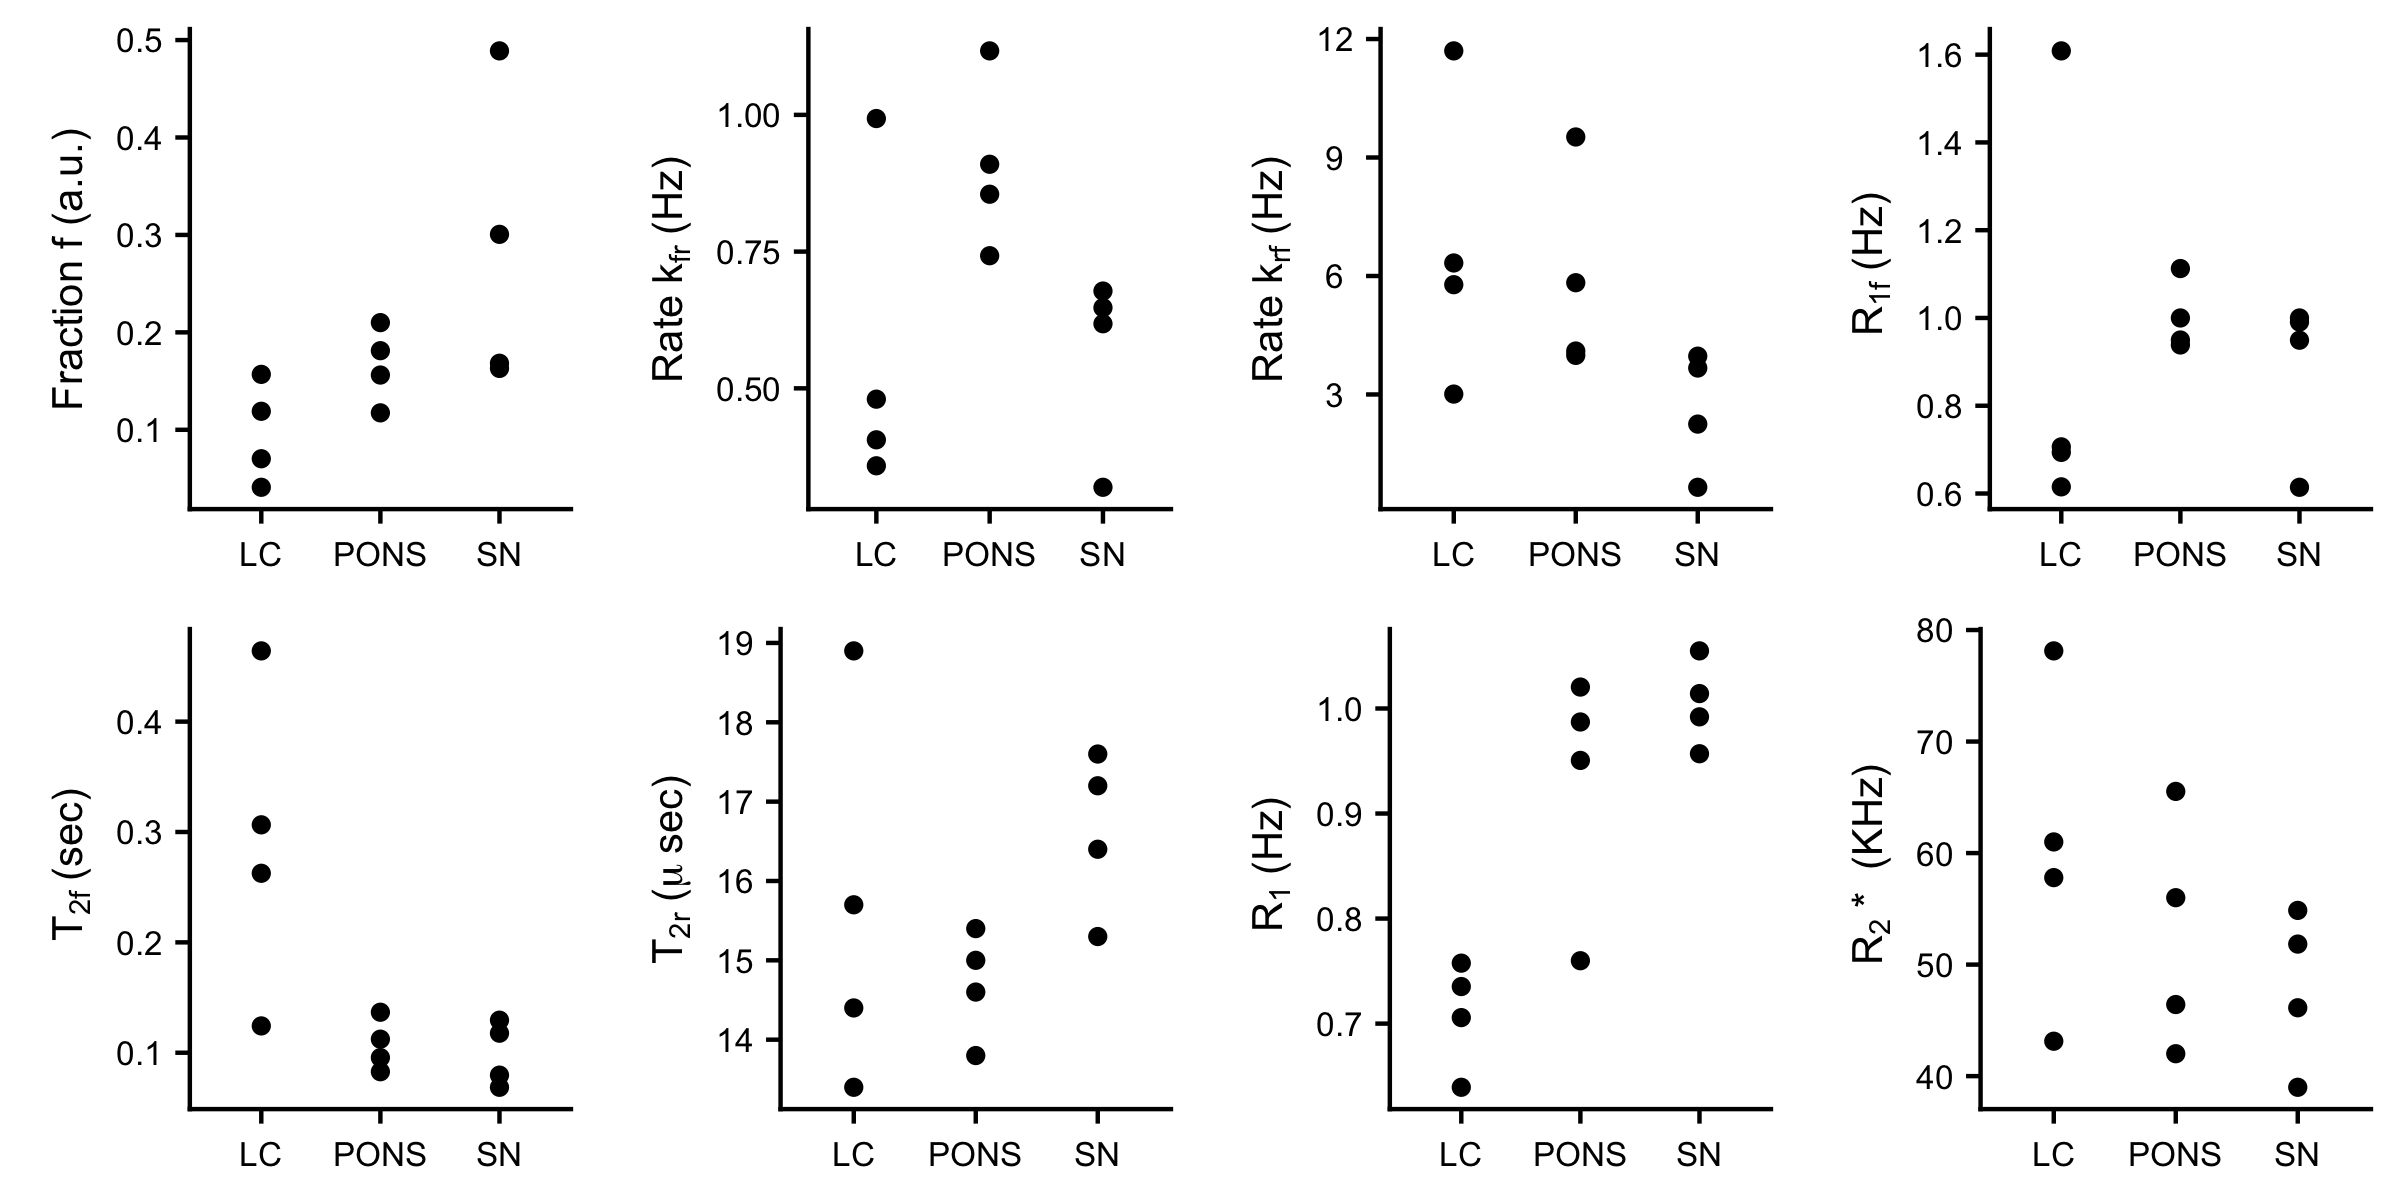
The frequency offset modulation affected the contrast in LC and SN, with maximum contrast between them versus adjacent brain matter being observed in the range of 860 to 1710 Hz (Figure 2). The z-spectra for all ROIs were approximated well with a super-Lorentzian. However, MT effects in LC were reduced across the offset spectrum compared to SN and PONS (Figure 3). From the fitting results, decreased macromolecular pool (MP) fraction f and increased T2 of the free water were observed in the LC compared to SN and PONS. SN instead showed a decreased proton exchange rate K from the restricted to the free water pool and increased T2 of the restricted pool (Figure 4).Discussion
Our results show reduced MT effects for LC as well as MP fraction f decrease and T2f increase compared to SN and PONS. This suggests that the LC MRI contrast is due to reduced macromolecular content. LC neurons are thought to be unmyelinated [9, 10], which is consistent with our observations. The SN also shows reduced magnetization exchange, but it seems to instead relate to a decreased exchange rate and increased T2r. NM macromolecules tend to be large (~20 nm) compared to the membrane they attach to [11], which could potentially decrease the proton exchange.Conclusion
LC is thought to be highly relevant in aging and neurodegenerative disease, such as Alzheimer’s disease; several non-quantitative LC MRI metrics have recently been examined in this regard [12-14]. In this study, we examined the MRI source of contrast in LC with a qMT approach and compared it to other structures with similar behavior. Our results suggest that LC MRI contrast is due to reduced macromolecular content, which provides a possible direction for the development of quantitative MRI markers for LC.Acknowledgements
No acknowledgement found.References
1. Marcyniuk, B., D.M. Mann, and P.O. Yates, The topography of cell loss from locus caeruleus in Alzheimer's disease. J Neurol Sci, 1986. 76(2-3): p. 335-45.
2. Busch, C., J. Bohl, and T.G. Ohm, Spatial, temporal and numeric analysis of Alzheimer changes in the nucleus coeruleus. Neurobiol Aging, 1997. 18(4): p. 401-6.
3. Braak, H., et al., Stages of the pathologic process in Alzheimer disease: age categories from 1 to 100 years. J Neuropathol Exp Neurol, 2011. 70(11): p. 960-9.
4. Trujillo, P., et al., Contrast mechanisms associated with neuromelanin-MRI. Magn Reson Med, 2016. 78(5): p. 1790-1800. 5. Priovoulos, N., et al., High-resolution in vivo imaging of human locus coeruleus by magnetization transfer MRI at 3T and 7T. Neuroimage, 2018. 168: p. 427-436.
6. Keren, N.I., et al., In vivo mapping of the human locus coeruleus. Neuroimage, 2009. 47(4): p. 1261-7.
7. Mougin, O.E., et al., Magnetization transfer phenomenon in the human brain at 7 T. Neuroimage, 2010. 49(1): p. 272-81.
8. Boudreau, M. and G.B. Pike, Sensitivity regularization of the Cramer-Rao lower bound to minimize B1 nonuniformity effects in quantitative magnetization transfer imaging. Magn Reson Med, 2018.
9. Bekar, L.K., W. He, and M. Nedergaard, Locus coeruleus alpha-adrenergic-mediated activation of cortical astrocytes in vivo. Cereb Cortex, 2008. 18(12): p. 2789-95.
10. Levitt, P. and R.Y. Moore, Noradrenaline neuron innervation of the neocortex in the rat. Brain Res, 1978. 139(2): p. 219-31.
11. Zucca, F.A., et al., Neuromelanin of the human substantia nigra: an update. Neurotox Res, 2014. 25(1): p. 13-23.
12. Hämmerer, D., et al., Locus coeruleus integrity in old age is selectively related to memories linked with salient negative events. Proceedings of the National Academy of Sciences, 2018.
13. Takahashi, J., et al., Detection of changes in the locus coeruleus in patients with mild cognitive impairment and Alzheimer's disease: high-resolution fast spin-echo T1-weighted imaging. Geriatr Gerontol Int, 2015. 15(3): p. 334-40.
14. Mather, M., et al., Higher locus coeruleus MRI contrast is associated with lower parasympathetic influence over heart rate variability. Neuroimage, 2017. 150: p. 329-335.
Figures