3185
Progressive Alterations in Resting-State Regional Homogeneity in Type 2 Diabetes with and without Mild Cognitive Impairment1Department of Radiology, Tongji Hospital, Tongji Medical College, HUST, Wuhan, China, 2Department of Neurology, Tongji Hospital, Tongji Medical College, HUST, Wuhan, China
Synopsis
This
study aims to detailly investigate the alterations in spontaneous brain
activity in T2DM patients with and without MCI and characterize its
relationships with clinical measurements. Forty-four T2DM patients were divided
into two sub-groups(impaired and normal cognition), together with 25 healthy
controls, were scanned at 3Tscanner. T2DM patients with normal cognition had increased
regional-homogeneity in many important brain
regions than controls. Those with MCI exhibited regional-homogeneity in right
inferior frontal gyrus in a further step. Increased
regional-homogeneity correlated with neuropsychological assessment, glycosylated-hemoglobinA1c
and disease duration. Rs-fMRI can be an appropriate approach for studying the alteration
in spontaneous brain activity in diabetes.
Introduction/Purpose
Patients with Type 2 Diabetes (T2DM) have considerably higher risk of developing mild cognitive impairment (MCI) and dementia.1 Altered spontaneous brain activity in T2DM has been revealed through resting-state functional MRI (rs-fMRI).2,3 A number of patients with diabetes can progress to mild cognitive impairments (MCI), or even dementia rapidly. However, some of them may stay at an unchanged normal cognition status for a long period. In this study, we aimed to detailly investigate the possible alterations in spontaneous brain activity in T2DM patients with and without MCI, together with the healthy controls. Correlations between regional homogeneity (ReHo) changes and clinical metrics (disease duration and glycated hemoglobin A1c or HbA1c level, neuropsychological scores) were analyzed.Methods
Subjects With the approval of the Institutional Review Board, 44 T2DM patients (based on diagnostic criteria of American Diabetes Association, 51-72years) were divided into cognitive impairment (DM-MCI, n=22, 63.0±5.7years) group and normal cognition (DM-NC, n=22, 59.1±6.2 years) group based on the clinical symptoms and a battery of systematic neuropsychological tests (Mini-Mental State Examination or MMSE, Montreal Cognitive Assessment or MoCA, Auditory Verbal Learning Test, Trail Making Tests, Hachinski Test, Activity of Daily Living Test). Blood biochemistry including plasma fasting/postprandial glucose and glycosylated hemoglobinA1c (HbA1c) were also tested. Twenty-five healthy subjects were enrolled as controls. MR data acquisition On a 3 Tesla MRI scanner (Discovery 750, GE Health Care, Waukesha, Wisconsin, USA) with 32-channel head coil, rs-fMRI data were obtained axially using a gradient-echo planar imaging (EPI) sequence with the following parameters: TR/TE =2000/35ms, FOV=24.0×24.0cm2, 40 continuous slices with 4mm slice thickness, Bandwidth=250kHz, Flip Angle=90°. Data processing The registered fMRI data were segmented into 90 cerebral regions using the anatomically labeled (AAL) template.4 To explore the within-group ReHo patterns, one-sample t tests were performed on the individual zReHo maps for each group. To display the most significant results and reflect the intrinsic nature of the zReHo algorithms, a conservative statistical significance was set at p<0.005 and a cluster size of 27 voxels, which corresponded to a corrected p<0.005 (multiple comparisons with AlphaSim, http://afni.nih.gov/afni/docpdf/AlphaSim.pdf). To investigate the between-group differences of ReHo values, two-sample t tests were conducted voxel-wisely (within a Gray-Matter mask). The ReHo value was calculated with the dpabi (Data Processing & Analysis of Brain Imaging) toolkit5 (www.nitrc.org/projects) and SPM12 (www.fil.ion.ucl.ac.uk/spm) software. The Pearson’s correlation coefficients between ReHo values and MMSE/MoCA scores, diabetes duration, and HbA1c levels were computed. Age and gender were imported as covariates. The statistical threshold was set at p<0.05 and a minimum cluster size of 140 voxels, which corresponded to a corrected p<0.05 (AlphaSim correction). The statistical analyses were carried out using SPSS software (SPSS Inc., Chicago, IL).Results
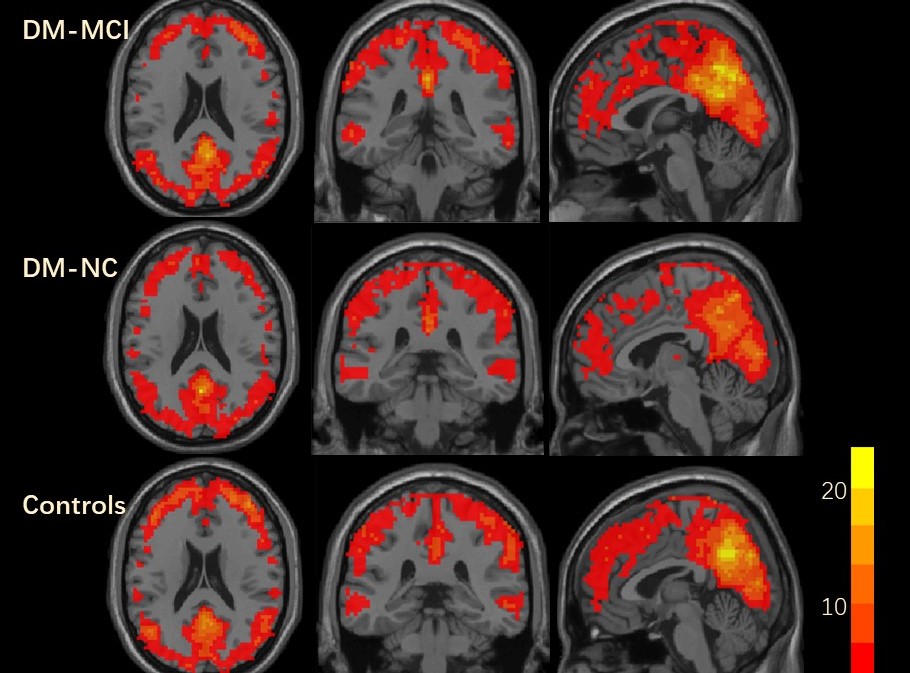
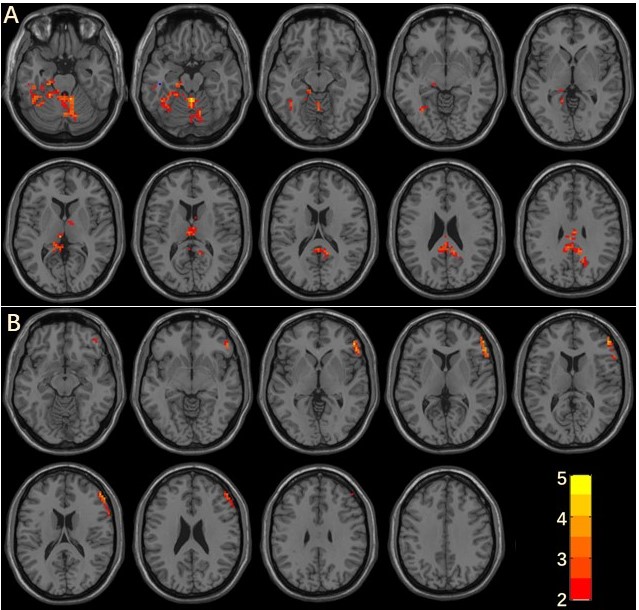
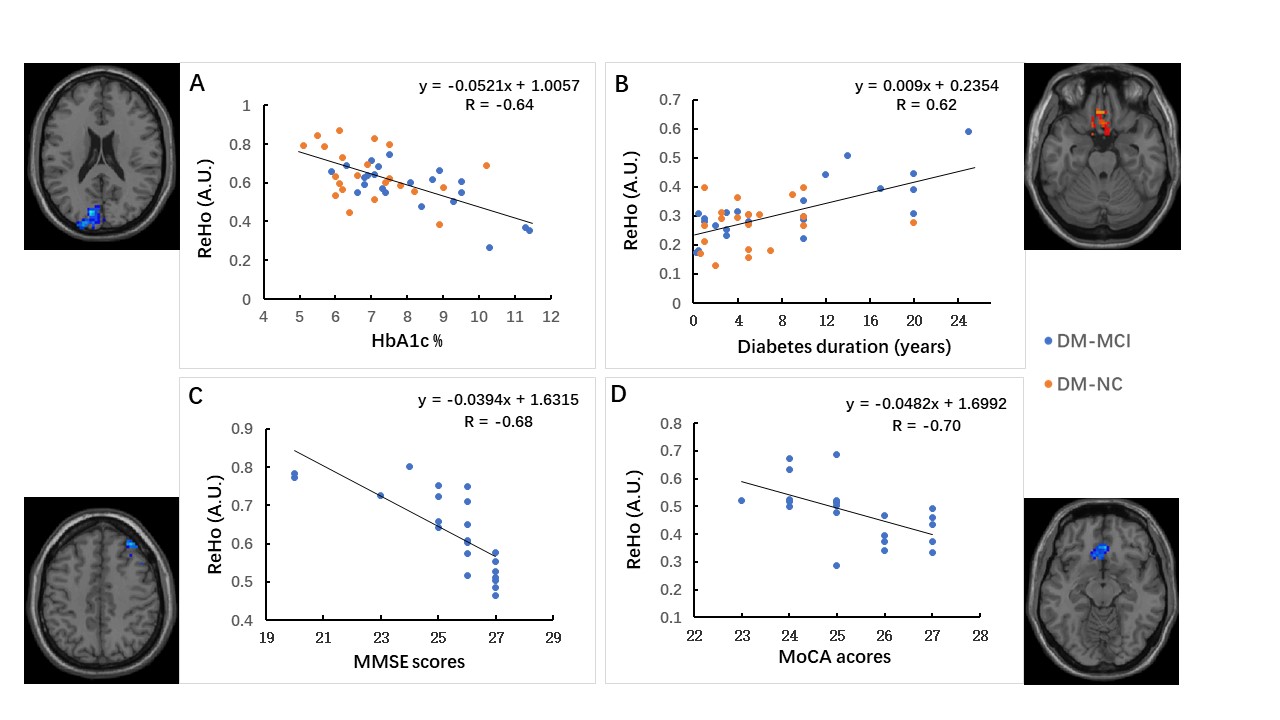
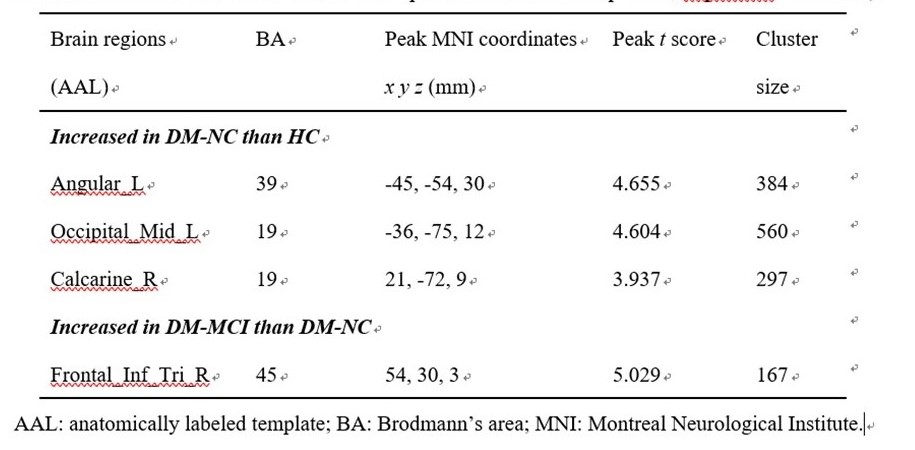
The DM-MCI group had longer disease duration (8.7±7.7years) and higher HbA1c (8.1±1.6%) level than DM-NC group (5.3±4.5years; 6.9±1.3%) (p<0.05). Within-group analysis In every group, standardized zReHo values in the cingulate cortex, precuneus, and frontal/parietal/occipital cortex were significantly higher than the global mean values (Fig.1). Intergroup analysis The DM-NC group showed increased ReHo in the left superior temporal gyrus, angular gyrus, bilateral calcarine and lingual gyrus, occipital cortex, and vermis/cerebelum regions than healthy controls (Fig.2A, table). Compared with the normal cognition group, the DM-MCI group exhibited a step further increased ReHo in the right inferior frontal gyrus, triangular part (Fig.2B, table). Correlation analysis ReHo value was found to be correlated with HbA1c level in the left cuneus (R=-0.64, Fig.3A) and diabetic duration in left rectus gyrus (R=0.62, Fig.3B) for all the T2DM subjects. ReHo values also correlated with neurocognitive scores in the right middle frontal gyrus (R=-0.68, Fig.3C) and the right superior frontal gyrus, medial orbital (R=-0.70, Fig.3D).Discussion and conclusions
This study confirmed the intrinsic and spontaneous neural activity alterations in T2DM patients. T2DM patients with longer duration and poorer glucose control were more likely to have cognitive problems. Based on the ReHo measurements, which has been used to analyze the synchronization of a given voxel with its neighboring voxels,6 increased local neuronal synchronization was detected in many important brain regions in T2DM subjects. Those patients with cognitive impairment exhibited increased ReHo in the right inferior frontal gyrus further. This region might be more vulnerable in T2DM induced cognitive dysfunction. T2DM induced cognitive impairment is a progressive process, during which the neuronal synchronization can increase gradually. Rs-fMRI can be an appropriate approach for studying the alteration in spontaneous brain activity in diabetes.Acknowledgements
This project was supported by the National Natural Science Funds of China (Grant No. 81601480 and 81471230).References
1. McCrimmon RJ, et al. Diabetes and cognitive dysfunction. Lancet. 2012; 379(9833):2291-9.
2. Cui Y, et al. Altered spontaneous brain activity in type 2 diabetes: a resting-state functional MRI study. Diabetes. 2014; 63(2):749-60.
3. Barkhof F, et al. Resting-state functional MR imaging: a new window to the brain. Radiology 2014; 272:29-49.
4. Tzourio-Mazoyer N, et al. Automated anatomical labeling of activations in SPM using a macroscopic anatomical parcellation of the MNI MRI single-subject brain. Neuroimage 2002; 15(1): 273-89.
5. Yan, C.G., Wang, X.D., Zuo, X.N., Zang, Y.F., 2016. DPABI: Data Processing & Analysis for (Resting-State) Brain Imaging. Neuroinformatics 14, 339-351.
6. Zang Y, Jiang T, Lu Y, et al. Regional homogeneity approach to fMRI data analysis. Neuroimage 2004; 22: 394-400.
Figures