3184
Altered Functional Topological Properties of Brain Networks in Type-2 Diabetes with and without Mild Cognitive Impairment1Department of Radiology, Tongji Hospital, Tongji Medical College, HUST, Wuhan, China, 2Department of Neurology, Tongji Hospital, Tongji Medical College, HUST, Wuhan, China
Synopsis
This
study aims to investigate the functional topological properties in T2DM with
and without impairment, and characterize its relationships with clinical
measurements. Forty-four T2DM patients were divided into two sub-groups
(impaired and normal cognition), together with healthy controls, were imaged at
a 3T scanner. We found no significant intergroup difference in global
measurements among the three group. However, increased or decreased nodal
efficiency was detected in some important brain regions. Altered nodal
efficiency in FFG and ITG correlated with glycosylated hemoglobinA1c and neuropsychological
assessments. The resting-state functional topological properties research shows
potential feasibility in characterizing intrinsic alterations of diabetic
encephalopathy.
Introduction/Purpose
Recent studies involving connectome analysis including graph theory have yielded potential biomarkers for mental disorders. Patients with Type 2 Diabetes (T2DM) have considerably higher risk of developing mild cognitive impairment (MCI) and dementia.1 Altered spontaneous brain activity in T2DM has been revealed through resting-state functional MRI (rs-fMRI).2,3 However, it is not clear how the functional topological properties changes when some T2DM patients develop to have cognitive dysfunction. In this study, we aimed to investigate the differences of resting-state functional network between T2DM patients with MCI and those with normal cognition. We hypothesize that there may be some different segregated disruptions in the topological organization of intrinsic functional brain networks.Methods
Subjects: With the approval of the Institutional Review Board, 44 T2DM patients (based on diagnostic criteria of American Diabetes Association, 51-72 years) were divided into cognitive impairment (DM-MCI, n=22, 63.0±5.7years) group and normal cognition (DM-NC, n=22, 59.1±6.2 years) group based on the clinical symptoms and a battery of systematic neuropsychological tests (Mini-Mental State Examination, Montreal Cognitive Assessment, Auditory Verbal Learning Test, Trail Making Tests, Hachinski test, Activity of Daily Living test). Blood biochemistry including plasma fasting/postprandial glucose and glycosylated hemoglobinA1c (HbA1c) were also tested. Twenty-five healthy subjects (50-70 years) were enrolled as controls. MR data acquisition: On a 3 Tesla MRI scanner (Discovery 750, GE Health Care, Waukesha, Wisconsin, USA) with 32-channel head coil, rs-fMRI data were obtained axially using a gradient-echo planar imaging (EPI) sequence with the following parameters: TR/TE =2000/35ms, FOV=24.0×24.0cm2, 40 continuous slices with 4mm slice thickness, Bandwidth=250kHz, Flip Angle=90°. Data preprocessing including slice timing, realign, normalize, spatially smooth, detrend. Network construction and analysis: To determine the nodes of brain functional networks, the registered fMRI data were segmented into 90 cerebral regions using the anatomically labeled (AAL) template.4 For each subject, the representative time series of each ROI was obtained by averaging the fMRI time series across all voxels within that region. A sparsity threshold range of 0.10 to 0.50 with an interval of 0.025 was employed. Graph theoretical analysis was carried out using in-house GRETNA.5 For brain networks at each sparsity threshold, we calculated global and regional network parameters, which involves (1) small-world parameters (λ, γ, σ); clustering coefficient Cp; characteristic path length Lp; (2) network efficiency measures: global efficiency Eg, local efficiency Eloc, and nodal efficiency. We calculated the area under the curve (AUC) for each network metric, which provided a summarized scalar for the topological characterization of brain networks. The network analyses were visualized using BrainNet Viewer6 software. A one-way analysis of variance (ANOVA) was performed on the AUC of each network metrics, a statistic significant level was set at p<0.05. For nodal parameters, a false-discovery rate (FDR) correction was applied for multiple comparisons.Results
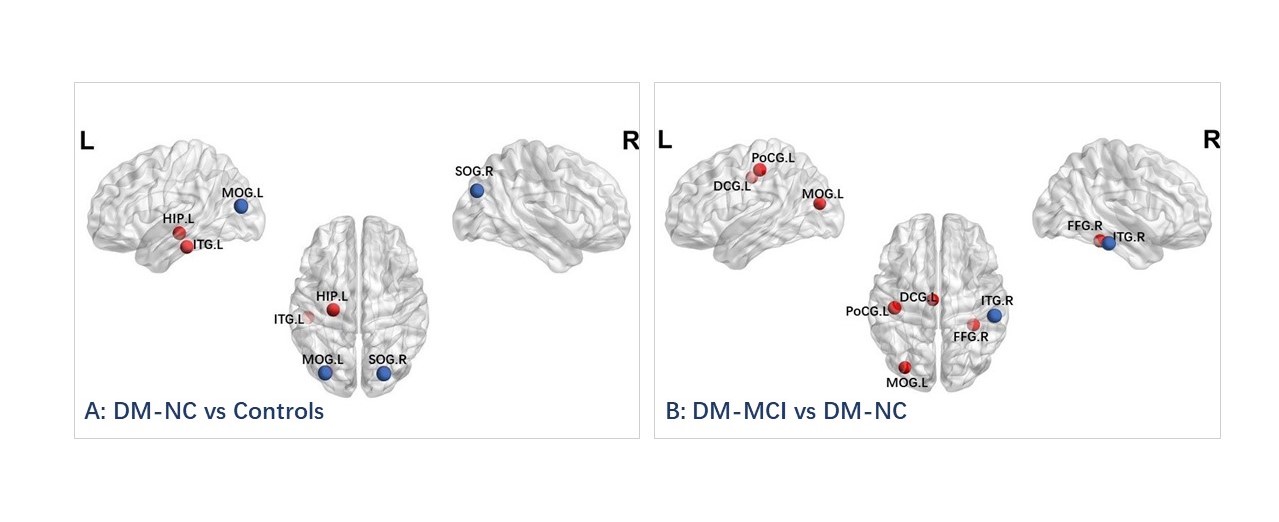
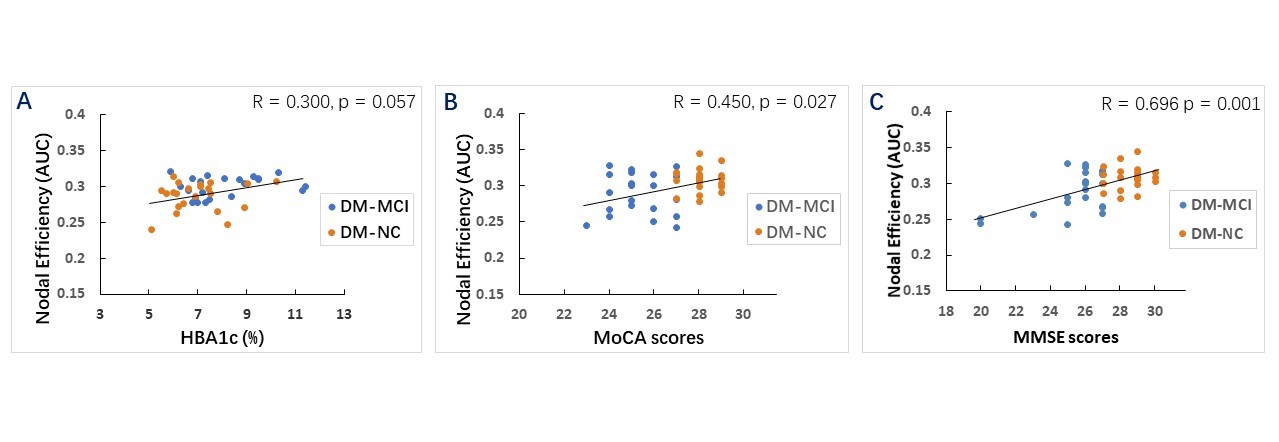
The DM-MCI group had longer disease duration (8.7±7.7years) and higher HbA1c (8.1±1.6%) level than DM-NC group (5.3±4.5years; 6.9±1.3%) (p<0.05). Global Measurements: All the DM-MCI group, DM-NC group, and healthy controls exhibited economical small-world organization (σ>1, respectively). There were no intergroup difference in Eg, Eloc, Cp, Lp, and small-world parameters (λ, γ, σ) among the three groups. Regional Measurements: The DM-NC group showed increased nodal efficiency in the left inferior temporal gyrus (ITG.L) and hippocampus (HIP.L), and decreased nodal efficiency in the left middle occipital gyrus (MOG.L) and the right superior occipital gyrus (SOG.R) than healthy controls (Fig.1A). Compared with the normal cognition group, the DM-MCI group exhibited increased nodal efficiency in the left postcentral gyrus (PoCG.L), middle occipital gyrus (MOG.L), Median cingulate and paracingulate gyrus (DCG.L) and the right fusiform gyrus (FFG.R), and decreased nodal efficiency in the right inferior temporal gyrus (ITG.R) (Fig.1B). Correlation analysis: Nodal efficiency value was found to be correlated with HbA1c level in the right fusiform gurus (R=0.300, p=0.057, Fig.2A) and with neuropsychological assessments (MoCA and MMSE) in the right inferior temporal gyrus (R=0.450 and 0.696, p=0.027 and 0.001, Fig.3B and C, respectively) for all the T2DM subjects (age and gender as covariates).Discussion and conclusions
This study investigated the difference in topological properties of the functional brain networks in T2DM patients with and without cognitive impairment using resting-state fMRI and graph theoretical approaches. Together with the healthy controls, all the subjects’ groups exhibited preserved small-world properties. There was no significant difference in global properties, but altered regional properties between T2DM patients with MCI and with normal cognition. These findings suggest that impaired network organization may underlie the impaired responses in cognitive functions. Rs-fMRI can be an appropriate approach for studying the alteration in spontaneous brain activity in diabetes.Acknowledgements
Funding: This project was supported by the National Natural Science Funds of China (Grants No. 81601480 and 81471230)References
1. McCrimmon RJ, et al. Diabetes and cognitive dysfunction. Lancet. 2012; 379(9833):2291-9.
2. Cui Y, et al. Altered spontaneous brain activity in type 2 diabetes: a resting-state functional MRI study. Diabetes. 2014; 63(2):749-60.
3. Barkhof F, et al. Resting-state functional MR imaging: a new window to the brain. Radiology 2014;272:29-49.
4. Tzourio-Mazoyer N, et al. Automated anatomical labeling of activations in SPM using a macroscopic anatomical parcellation of the MNI MRI single-subject brain. Neuroimage 2002; 15(1): 273-89.
5. Wang J, et al. GRETNA: a graph theoretical network analysis toolbox for imaging connectomics. Frontiers in human neuroscience, 9, 386.
6. Xia M, et al. BrainNet Viewer: A Network Visualization Tool for Human Brain Connectomics. PLoS ONE 8: e68910.
Figures