3183
Identification of normal pressure hydrocephalus by disease-specific patterns of brain stiffness and damping ratio1Radiology, Mayo Clinic, Rochester, MN, United States, 2Neurosurgery, Mayo Clinic, Rochester, MN, United States, 3Physiology and Biomedical Engineering, Mayo Clinic, Rochester, MN, United States
Synopsis
Normal pressure hydrocephalus (NPH) is a form of dementia characterized by cognitive impairment, urinary incontinence and abnormal gait. NPH can be difficult to differentiate from other dementias, but it can be treated in many cases if accurately diagnosed. Here we tested whether MR elastography-based measures of brain stiffness and damping ratio could discriminate subjects with NPH from both cognitively normal subjects and those with probable Alzheimer’s disease. Both mechanical parameters exhibited significant group-wise differences in a specific spatial pattern. Further, summary measures of these spatial patterns in individuals discriminated subjects with NPH from the other two groups (area under ROC≥0.94).
Introduction
Normal pressure hydrocephalus (NPH) is a form of dementia characterized by cognitive impairment, urinary incontinence and abnormal gait.1 This disorder is in particular need of novel biomarkers because its etiology remains unclear, and it can be difficult to differentiate from other dementias. However, if properly identified, it is treatable by ventricular shunting in many cases. Magnetic resonance elastography (MRE) may have particular value in this application since biomechanics are thought to play a critical role in the etiology of NPH according to at least one model of the disease.2, 3 To this end, we used MRE to compare brain stiffness and damping ratio in a cohort of patients with NPH with respect to cognitively normal (CN) controls and patients with probable Alzheimer’s disease (AD).Methods
This study included 90 subjects who were scanned after obtaining informed written consent under an IRB approved protocol. Thirty-eight subjects with NPH were recruited according to clinical symptoms, findings on anatomical MRI, and improvement in symptoms following a large-volume lumbar puncture. Data from 44 CN subjects were used from a previously published aging study,4 as well as data from 8 subjects with probable AD.5 MRE data were acquired as previously described (spin-echo EPI pulse sequence, 60 Hz motion, 3 mm isotropic final image resolution).6
A neural network inversion (NNI) was trained as previously described,7 with two modifications. First, training data included material attenuation so the NNI could be trained to estimate damping ratio as well as stiffness. Second, to improve estimates near edges, the NNI was trained to predict the mechanical properties in the presence of missing data by applying brain mask patches taken from in vivo data to the training data. The spatial footprint of the NNI was 7×7×7 voxels. In vivo estimates were computed on the curl of the measured displacement data without additional smoothing.
Stiffness and damping ratio maps were then normalized to a custom in-house atlas8 in SPM12 using the MRE magnitude image as the reference. Parametric maps were smoothed with a Gaussian filter (5 mm FWHM), and data at each voxel were fit with a linear model that included age, sex and group. An approximate permutation test was used to test for differences between the NPH group and each of the other two groups controlling the total family-wise error rate at 0.05.
The likelihood that a given individual could be classified as NPH was assessed by pattern matching of the stiffness/damping maps to the estimated group-effects. This analysis was performed with leave-one-out cross validation. Thus for a given subject, the above linear model was fit to the data from all other subjects. Then, we computed the 4 possible correlation coefficients between that subject’s stiffness and damping ratio maps (corrected for age and sex) and the modeled NPH>AD and NPH>CN effects. Finally, we estimated the probability that each subject belonged to the NPH group using a logistic regression model with these four features as inputs, again with leave-one-out cross validation, and computed the area under the ROC curve to assess the ability of this method to discriminate NPH from CN and AD subjects.
Results
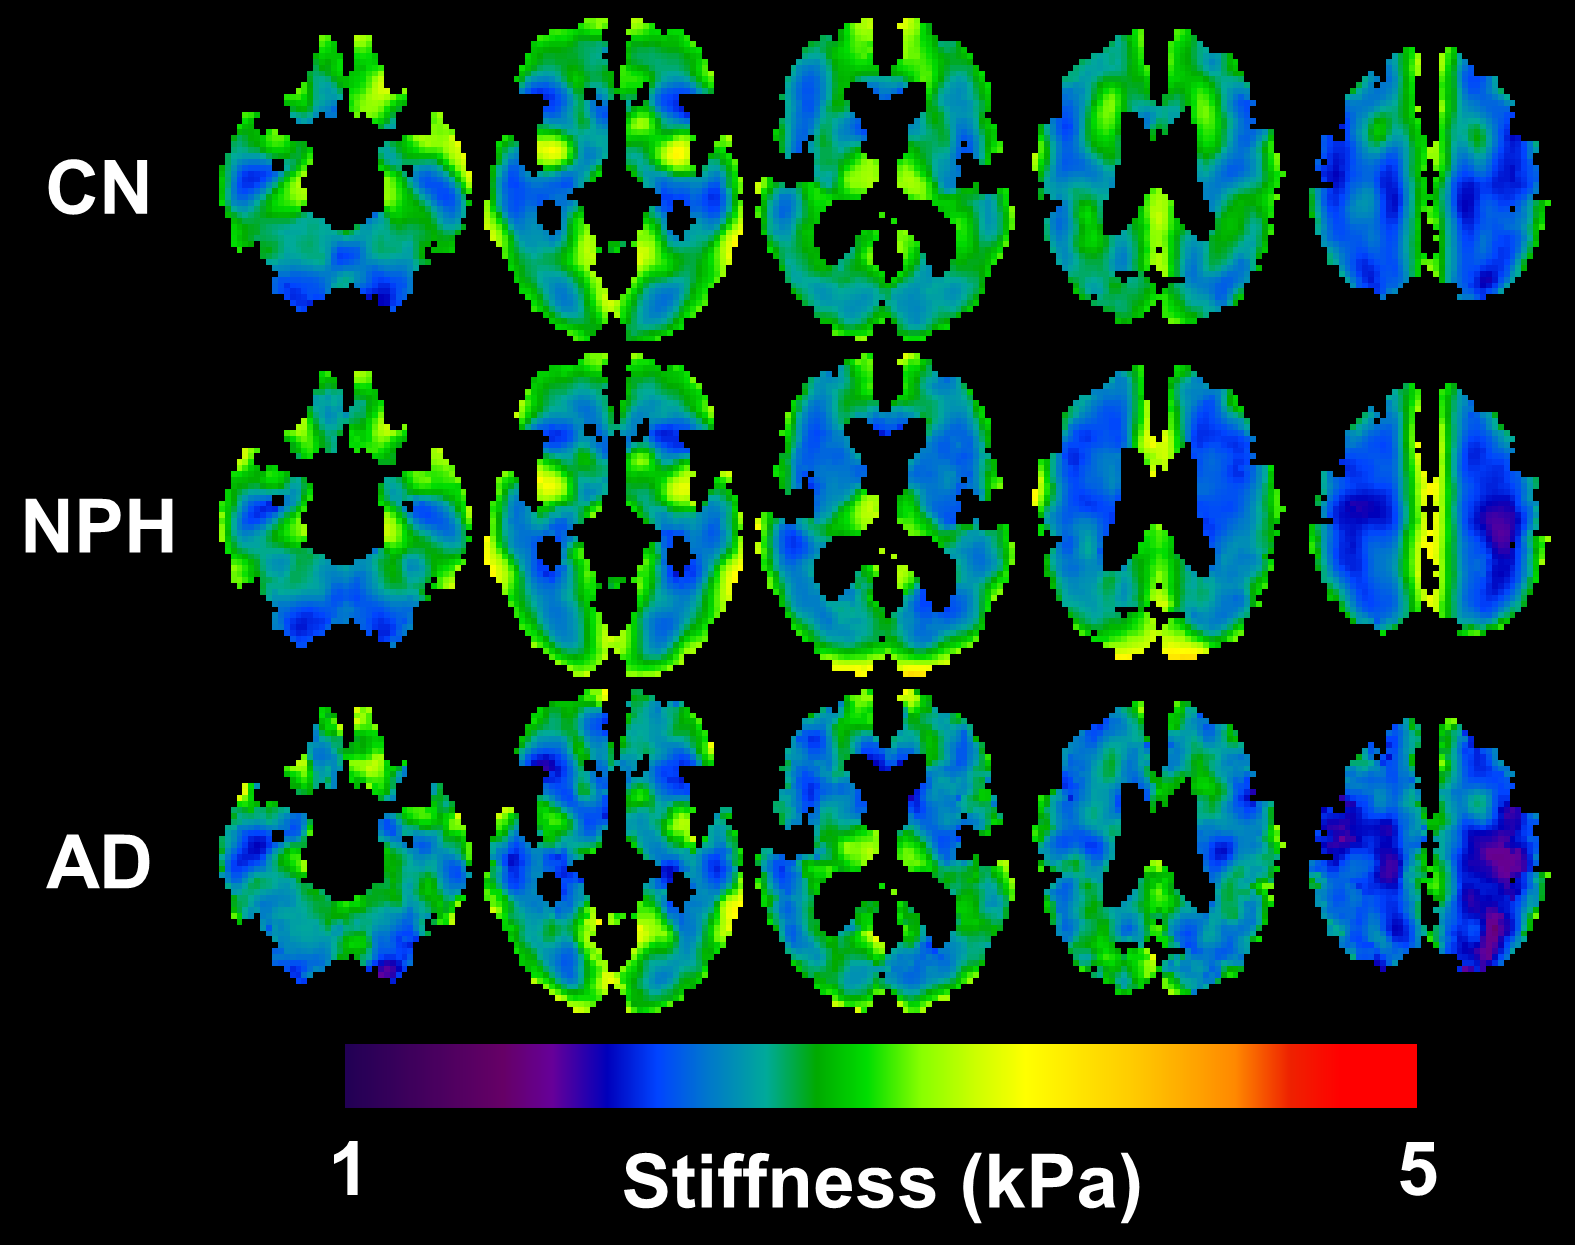
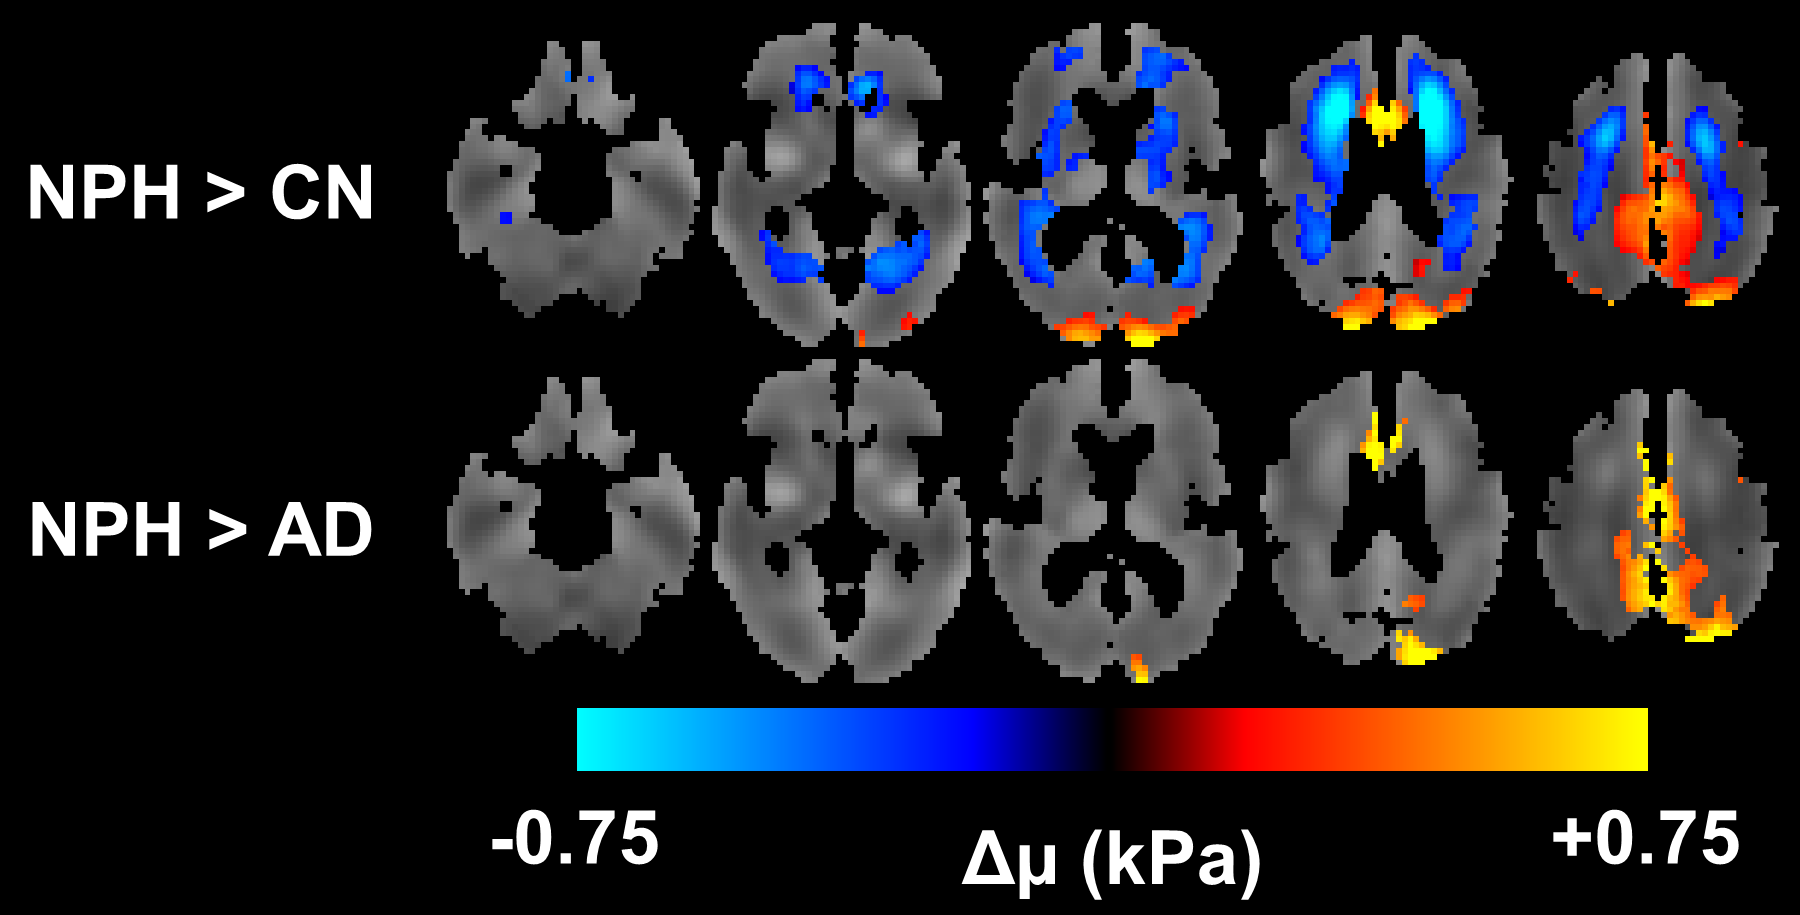
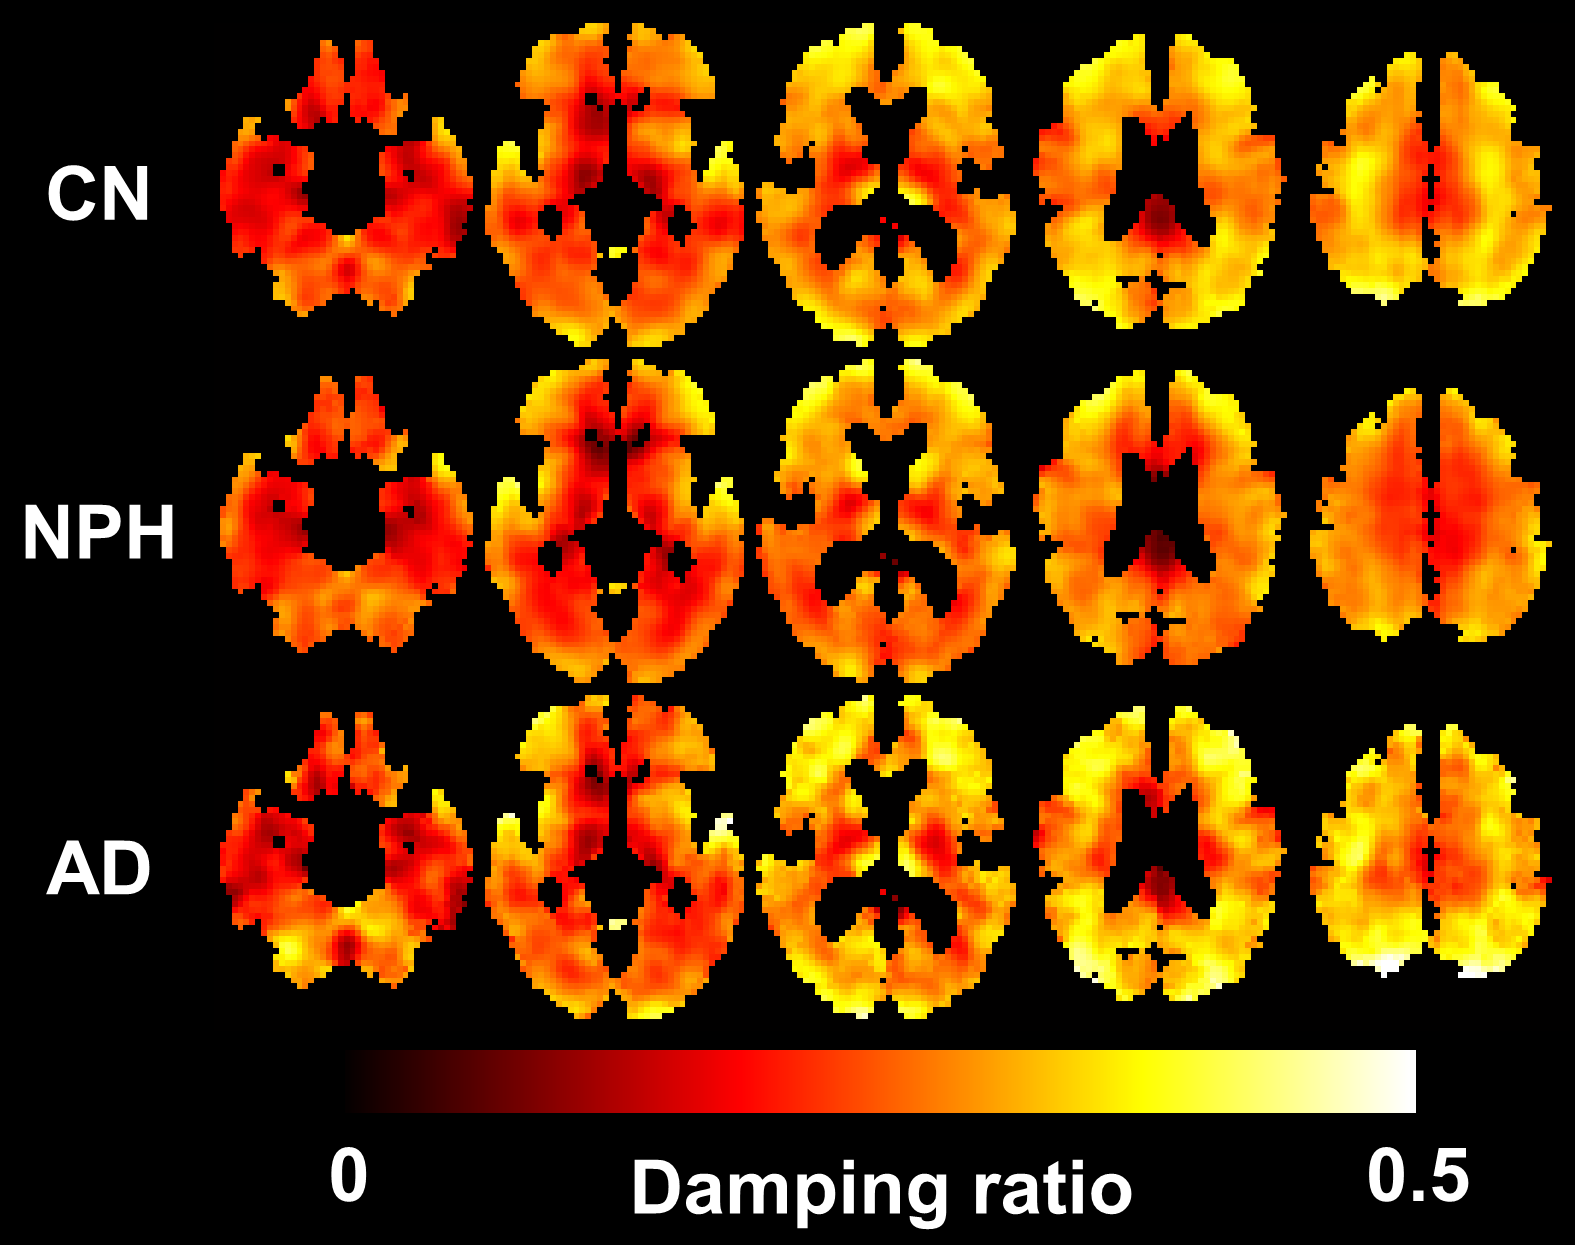
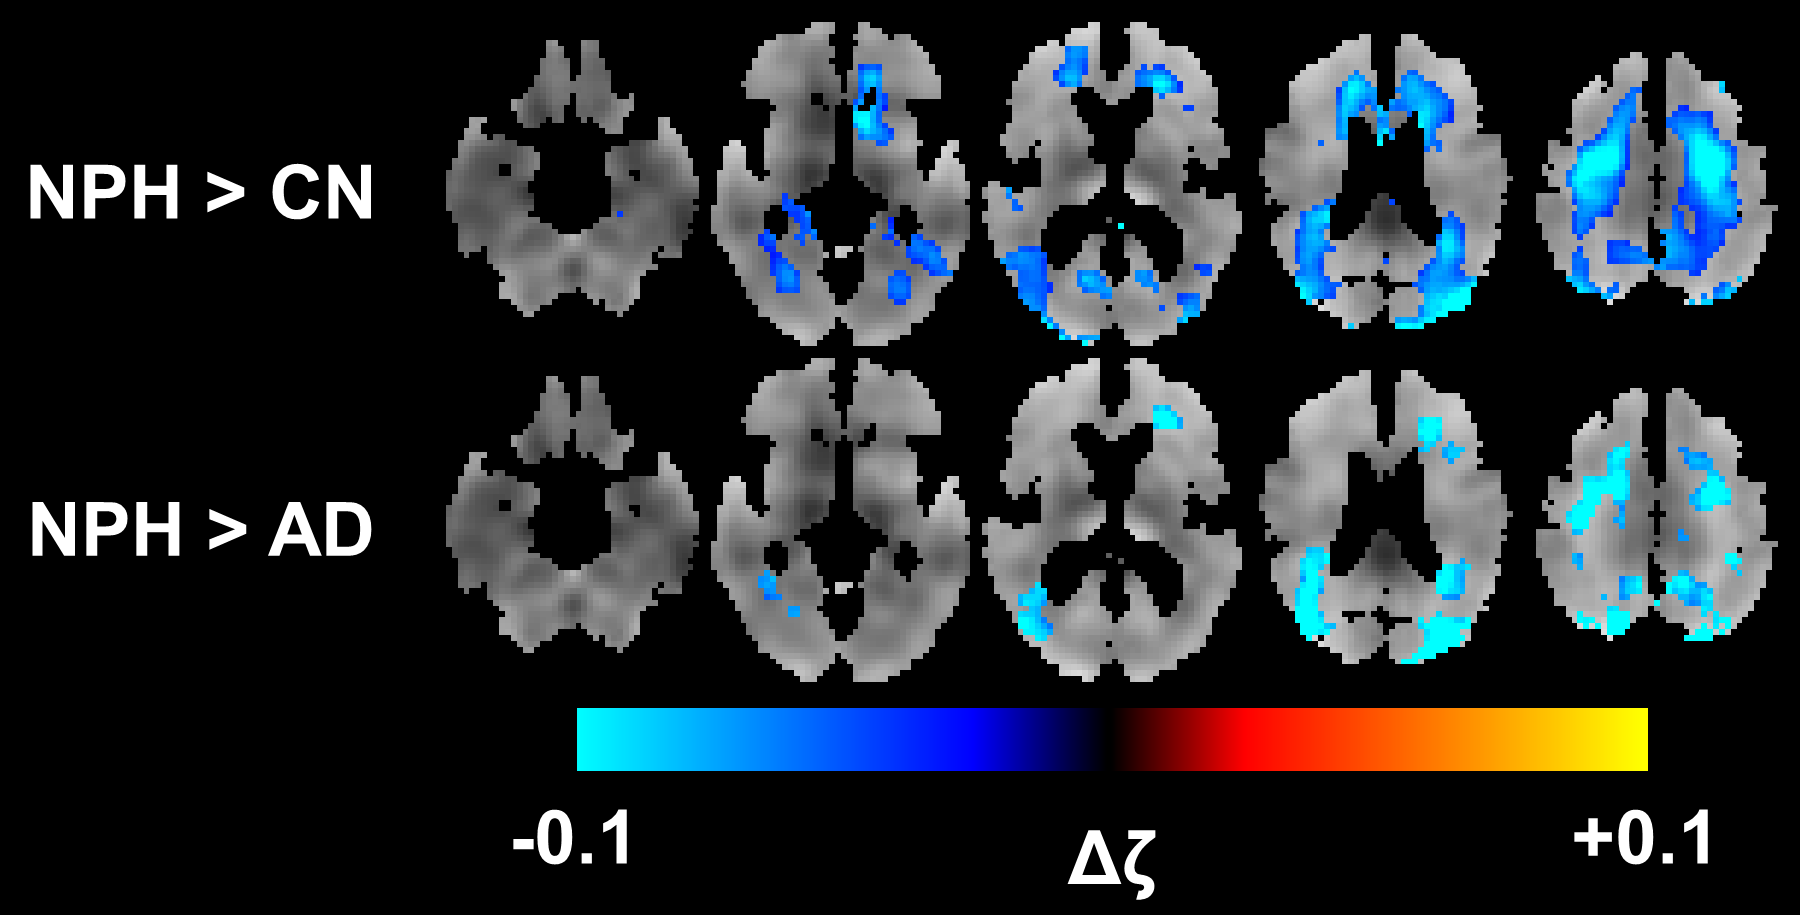
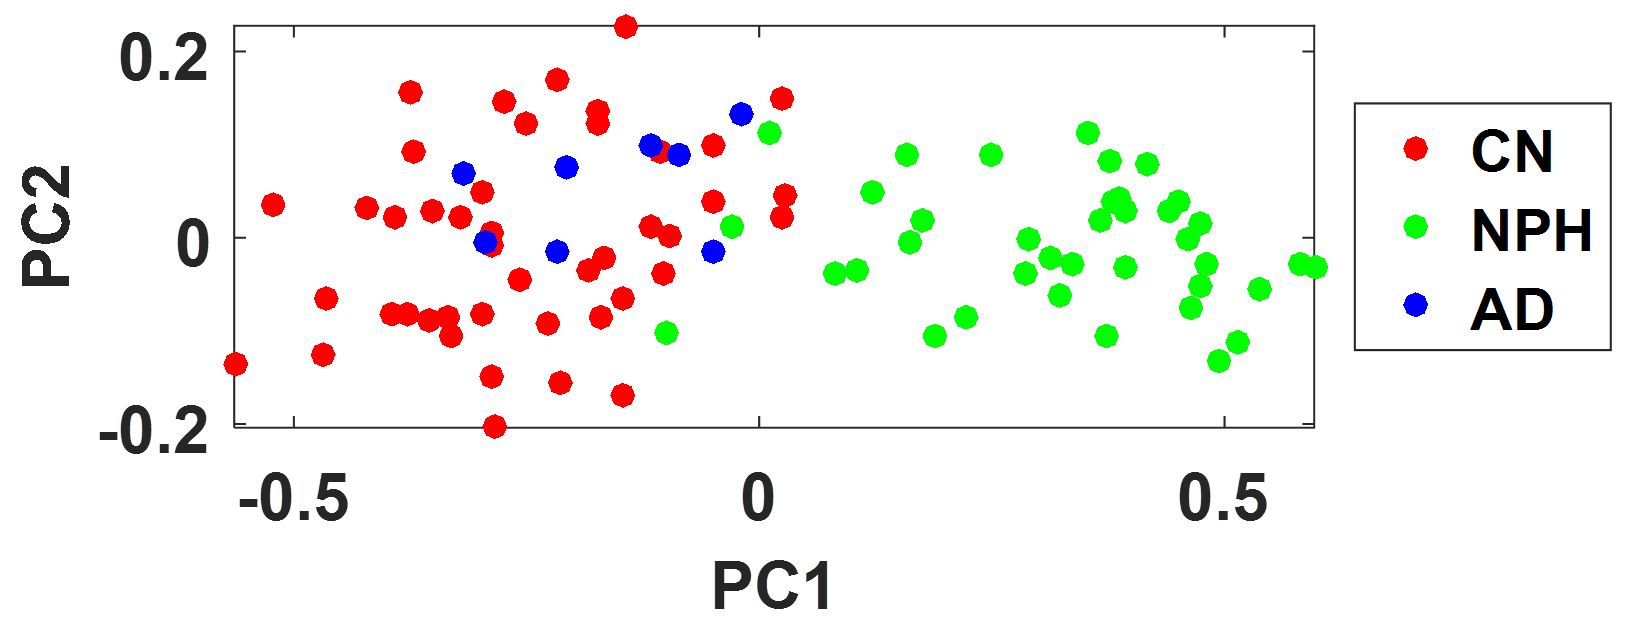
Mean stiffness maps for each group are shown in Figure 1, along with the significant group-wise differences in Figure 2. In general, the NPH groups exhibit periventricular softening with respect to the CN group, as well as stiffening at the vertex and occipital lobe with respect to both the CN and AD groups. Mean damping ratio maps for each group are shown in Figure 3, with the group-wise differences in damping shown in Figure 4. NPH subjects exhibit decreased damping ratio predominantly in superior regions of the white matter. The four features extracted for each subject were projected into a 2D feature space by principal component analysis for visualization (Fig. 5). NPH subjects are well separated from both CN (AUROC=0.95) and AD (AUROC=0.94) subjects in this space.Discussion and conclusion
Previous MRE studies of NPH by our group and others have produced seemingly disparate results.9-11 Leveraging the stable estimates provided by NNI, here we modeled the NPH-effects at the voxel level, revealing a unique pattern of stiffness and damping ratio alterations. Focusing on stiffness, the concentric pattern of firmness near the dural surface and softness near the ventricles helps explain the previous discrepancies; findings will be heavily dependent on the chosen regions of interest. This study also demonstrates the potential to use the spatial pattern of mechanical properties as a biomarker of neurological disease. Taken together, the results indicate a potential role for MRE in diagnosing and understanding the etiology of NPH.Acknowledgements
This work was supported by NIH grants R37-EB001981 and U01-EB024450.References
1. Relkin N, Marmarou A, Klinge P, Bergsneider M, Black PM. Diagnosing idiopathic normal-pressure hydrocephalus. Neurosurgery. 2005;57(3 Suppl):S4-16; discussion ii-v. PubMed PMID: 16160425.
2. Akai K, Uchigasaki S, Tanaka U, Komatsu A. Normal pressure hydrocephalus. Neuropathological study. Acta pathologica japonica. 1987;37(1):97-110. PubMed PMID: 3577765.
3. Keong NC, Pena A, Price SJ, Czosnyka M, Czosnyka Z, Pickard JD. Imaging normal pressure hydrocephalus: theories, techniques, and challenges. Neurosurgical focus. 2016;41(3):E11. doi: 10.3171/2016.7.FOCUS16194. PubMed PMID: 27581307.
4. Arani A, Murphy MC, Glaser KJ, Manduca A, Lake DS, Kruse SA, Jack CR, Jr., Ehman RL, Huston J, 3rd. Measuring the effects of aging and sex on regional brain stiffness with MR elastography in healthy older adults. NeuroImage. 2015;111:59-64. doi: 10.1016/j.neuroimage.2015.02.016. PubMed PMID: 25698157; PMCID: 4387012.
5. Murphy MC, Jones DT, Jack CR, Jr., Glaser KJ, Senjem ML, Manduca A, Felmlee JP, Carter RE, Ehman RL, Huston J, 3rd. Regional brain stiffness changes across the Alzheimer's disease spectrum. NeuroImage Clinical. 2016;10:283-90. doi: 10.1016/j.nicl.2015.12.007. PubMed PMID: 26900568; PMCID: 4724025.
6. Murphy MC, Huston J, 3rd, Jack CR, Jr., Glaser KJ, Senjem ML, Chen J, Manduca A, Felmlee JP, Ehman RL. Measuring the characteristic topography of brain stiffness with magnetic resonance elastography. PloS one. 2013;8(12):e81668. doi: 10.1371/journal.pone.0081668. PubMed PMID: 24312570; PMCID: 3847077.
7. Murphy MC, Manduca A, Trzasko JD, Glaser KJ, Huston J, 3rd, Ehman RL. Artificial neural networks for stiffness estimation in magnetic resonance elastography. Magnetic resonance in medicine. 2018;80(1):351-60. doi: 10.1002/mrm.27019. PubMed PMID: 29193306; PMCID: 5876084.
8. Vemuri P, Gunter JL, Senjem ML, Whitwell JL, Kantarci K, Knopman DS, Boeve BF, Petersen RC, Jack CR, Jr. Alzheimer's disease diagnosis in individual subjects using structural MR images: validation studies. NeuroImage. 2008;39(3):1186-97. doi: 10.1016/j.neuroimage.2007.09.073. PubMed PMID: 18054253; PMCID: 2390889.
9. Freimann FB, Streitberger KJ, Klatt D, Lin K, McLaughlin J, Braun J, Sprung C, Sack I. Alteration of brain viscoelasticity after shunt treatment in normal pressure hydrocephalus. Neuroradiology. 2012;54(3):189-96. doi: 10.1007/s00234-011-0871-1. PubMed PMID: 21538046.
10. Perry A, Graffeo CS, Fattahi N, ElSheikh MM, Cray N, Arani A, Ehman RL, Glaser KJ, Manduca A, Meyer FB, Huston J, 3rd. Clinical Correlation of Abnormal Findings on Magnetic Resonance Elastography in Idiopathic Normal Pressure Hydrocephalus. World neurosurgery. 2017;99:695-700 e1. doi: 10.1016/j.wneu.2016.12.121. PubMed PMID: 28063896; PMCID: 5357459.
11. Streitberger KJ, Wiener E, Hoffmann J, Freimann FB, Klatt D, Braun J, Lin K, McLaughlin J, Sprung C, Klingebiel R, Sack I. In vivo viscoelastic properties of the brain in normal pressure hydrocephalus. NMR in biomedicine. 2011;24(4):385-92. Epub 2010/10/12. doi: 10.1002/nbm.1602. PubMed PMID: 20931563.
Figures