3182
Brain volume asymmetries and 1H-MRS of Posterior Cingulate Cortex in the differential diagnosis of Primary Progressive Aphasia1Department of Biomedical and NeuroMotor Sciences, Functional MR Unit, University of Bologna, Bologna, Italy, Bologna, Italy, 2IRCCS Istituto delle Scienze Neurologiche di Bologna, Bologna, Italy, Bologna, Italy, 3Department of Biomedical and NeuroMotor Sciences, University of Bologna, Bologna, Italy, Bologna, Italy, 4Department of Physics and Astronomy, University of Bologna, Bologna, Italy, Bologna, Italy
Synopsis
Differential diagnosis of neurodegenerative diseases is a great challenge for both clinic practice and research. We investigated the ability of magnetic resonance spectroscopy (1H-MRS) of Posterior Cingulate Cortex (PCC) and brain volume asymmetries to differentiate patients with Primary Progressive Aphasia (PPA) from patients with Alzheimer’s disease (AD). The N-acetyl-aspartate to myo-inositol ratio (NAA/mI ratio) in the PCC discriminates APP from AD (p = 0.009) with an accuracy of 75.5%. Furthermore, ROC curve analyses of all statistically significant asymmetry indexes were performed and the PCC showed the highest level of accuracy (81.4%) in discriminating between the two neurodegenerative groups.
INTRODUCTION
Primary progressive aphasia (PPA) is a neurodegenerative disorder with heterogeneous neuropathological patterns, characterised by an isolated and gradual dissolution of language function1. Impairment of language abilities could also be an early manifestation of Alzheimer’s disease (AD), therefore a differential diagnosis based on clinical grounds alone is sometimes difficult, especially in the early stages. The aim of this study was to investigate the ability of magnetic resonance spectroscopy (1H-MRS) of Posterior Cingulate Cortex (PCC) and brain volume asymmetries to differentiate PPA from AD.METHODS
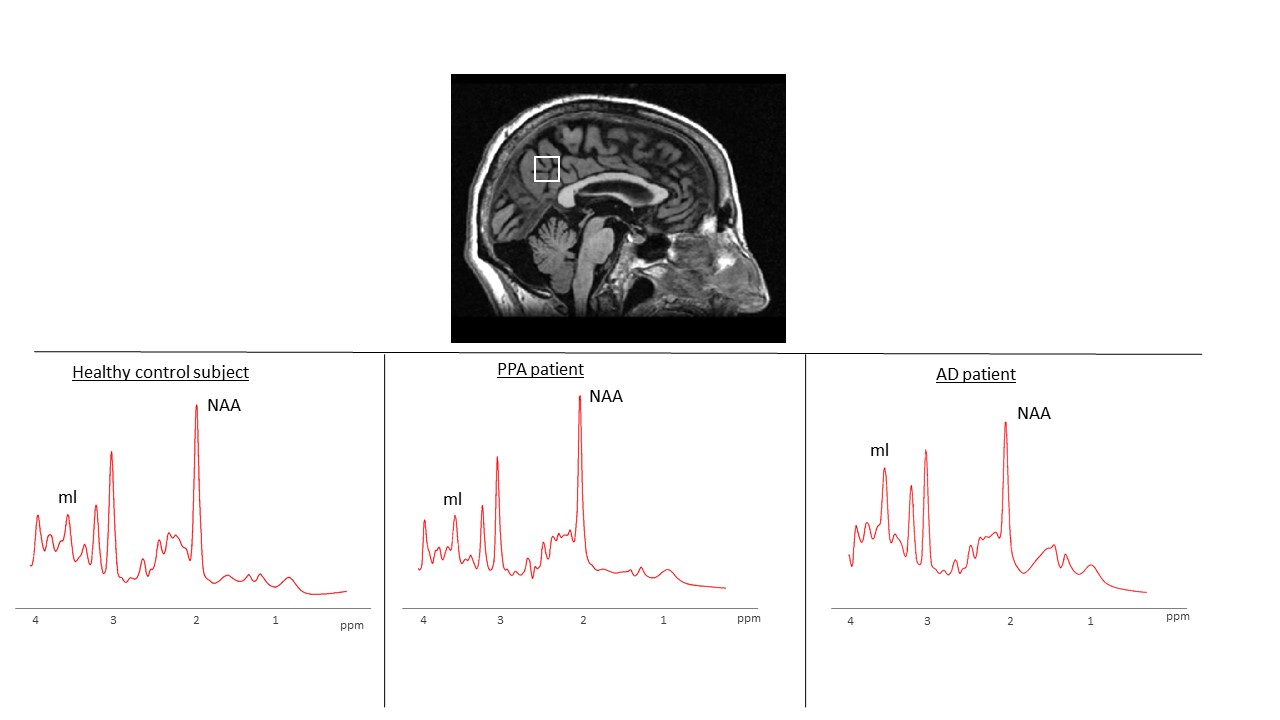
Seventeen APP patients (6 males; age, mean + standard deviation = 69.88 + 6.91), eighteen healthy controls (10 males; age 65.44 + 9.49) and twenty-three AD patients (13 males; age 71.13 + 9.48) were included in this study. All participants underwent a brain-MR protocol (1.5T GE scanner) including high-resolution T1-weighted volumetric sequence (isotropic 1mm3). Voxel-wise differences in brain volumetry (left and right side) were evaluated using FreeSurfer software and volumes were normalized by the total intracranial volume (TIV) of each participant. Asymmetry indexes (Right – Left) / (Right + Left) were also calculated for each brain area, and were compared among groups. Proton MR spectra of PCC were acquired using the point-resolved spectroscopy (PRESS) single voxel technique (TR=4000ms; TE=35ms; NEX=128; Volume =8ml) and were processed with the LCModel program (Figure 1). The ANOVA test followed by a Bonferroni post-hoc test for multiple comparisons was used for all analyses. Receiver operating characteristics (ROC) curve analyses were also performed in order to determine the level of accuracy of the most significant parameters in discriminating between the two neurodegenerative groups.
RESULTS
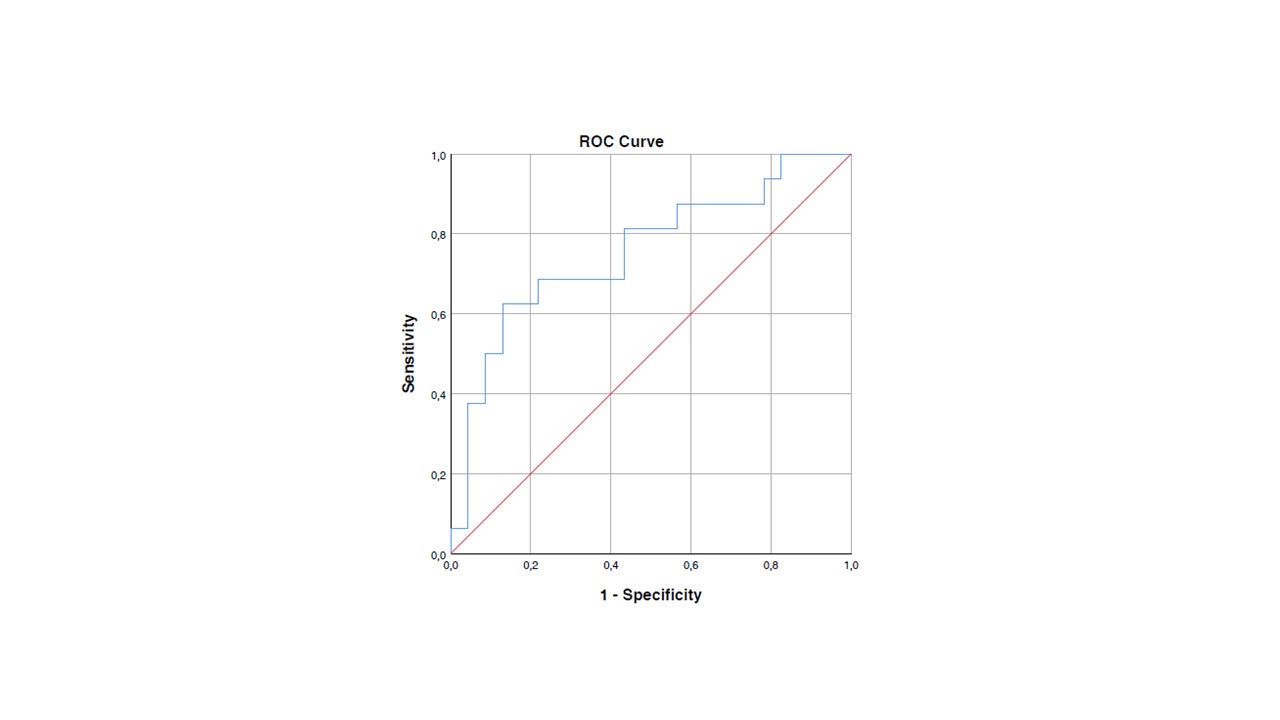
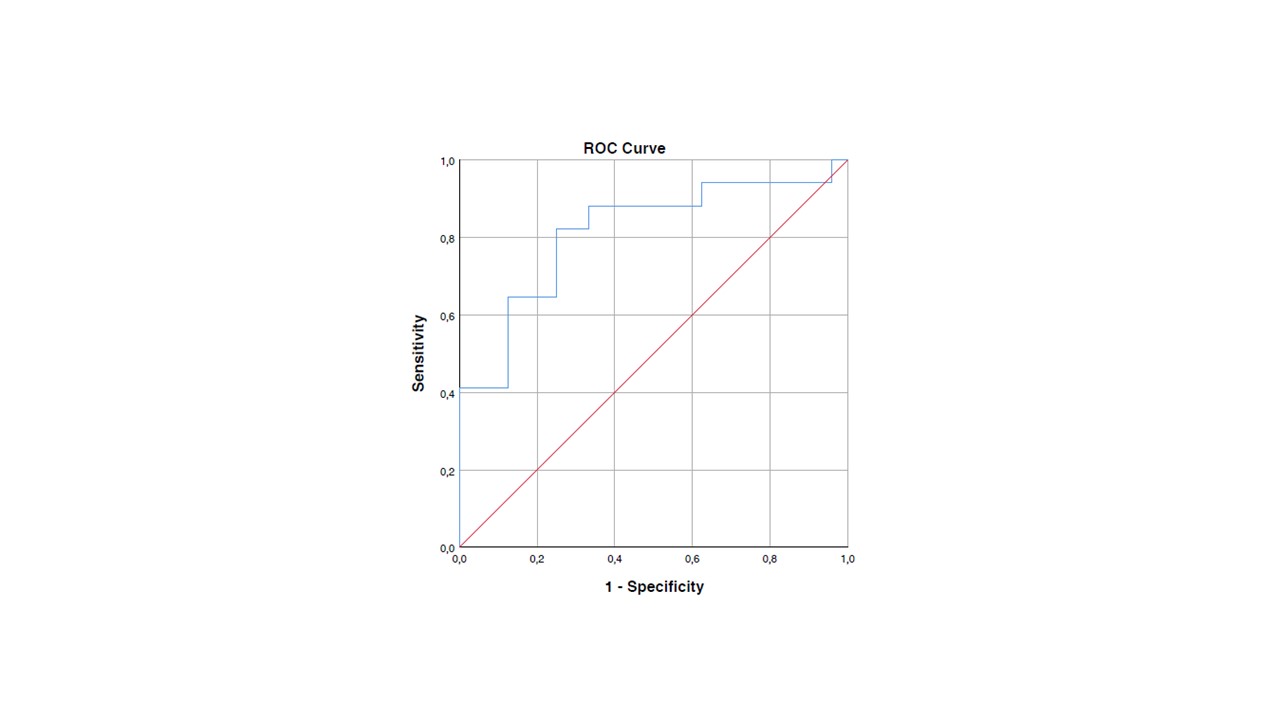
The N-acetyl-aspartate to myo-inositol ratio (NAA/mI ratio) in the PCC differentiates healthy controls from AD patients (p < .001) and it was also able to discriminate APP from AD (p = 0.009) with an accuracy of 75.5% (Figure 2). Brain volume and cortical thickness analyses showed a left lateralized atrophy pattern in the APP group compared to the AD group. Specifically, lower cortical thickness was found in left inferior (p = .014), middle (p = .006) and superior temporal cortex (p = .003), and also in Broca’s areas, respectively left pars opercularis (p = .020) and left pars triangularis (p = .046). Volume reduction was found in the left precentral (p = .024) and postcentral gyrus (p = .021) and in the left lateral orbitofrontal cortex (p = .041). No differences were found in the right hemisphere between the APP and AD group in brain volume or cortical thickness. Asymmetry indexes were calculated in all groups and results showed significant differences in fronto-temporal areas when compared the APP group with healthy controls; no asymmetry differences were found between the AD and the healthy control group. A comparison between the two neurodegenerative groups showed asymmetries in the inferior (p = .003), middle (p = .020), superior temporal cortex (p = .022) and also in the posterior cingulate cortex (p = .003), indicating a left volume reduction in the APP group. ROC curve analyses of all asymmetry indexes were performed and the PCC showed the highest level of accuracy (81.4%) in discriminating between the two neurodegenerative groups (Figure 3).DISCUSSION
The marked differences of N-acetyl-aspartate to myo-inositol in the PCC between the PPA and AD group suggests that proton MRS is accurate for differentiating between these two disorders. Furthermore, beside the well-known left-lateralized atrophy of fronto-temporal areas found in PPA patients2, an asymmetrical volume reduction of PCC appears to be a highly sensitive indicator for distinguishing these two neurodegenerative pathologies. Additional studies with larger samples and follow-ups are needed to confirm these results and to monitor the progression of the disease.CONCLUSION
Differential diagnosis of PPA is of pivotal importance in clinical practice during patient work-up. The results of this study clearly demonstrate the importance of neuroimaging in this task.Acknowledgements
No acknowledgement found.References
1. Mesulam MM. Primary progressive aphasia. Ann Neurol. 2001; 49(4):425-32.
2. Gorno-Tempini ML, Hillis AE, Weintraub S, Kertesz A, Mendez M, Cappa SF, Ogar JM, Rohrer JD, Black S, Boeve BF, Manes F, Dronkers NF, Vandenberghe R, Rascovsky K, Patterson K, Miller BL, Knopman DS, Hodges JR, Mesulam MM, Grossman M. Classification of primary progressive aphasia and its variants. Neurology. 2011;76(11):1006-14.
Figures