3180
Quantification of neuronal loss related to cognitive impairment in mild Alzheimer disease in hippocampal subfields using quantitative gradient recalled echo (qGRE) MRI1Department of Radiology, Washington University in Saint Louis, Saint Louis, MO, United States, 2Knight Alzheimer’s Disease Research Center, Washington University in St. Louis, Saint Louis, MO, United States, 3Department of Neurology, Washington University in St. Louis, Saint Louis, MO, United States
Synopsis
Damage of hippocampus leading to cognitive decline is one of the major hallmarks of Alzheimer disease (AD). Differentiating neuronal loss in hippocampal subfields is important as they control different biological functions. In this study, we used MRI-based qGRE technique to evaluate neuronal content (in the remaining after atrophy tissue) of hippocampal subfields in a well-characterized cohort of human subjects recruited from Knight ADRC. Our results showed pronounced left/right asymmetry in the pattern of neuronal damage in mild AD and a significantly stronger (compared to atrophy) correlation between neuronal loss in the remaining tissue of hippocampal subfields and cognitive tests.
INTRODUCTION
Alzheimer disease (AD) is characterized by accumulation of amyloid-β (Aβ) plaques and tau tangles leading to neuronal death in neocortex and hippocampus and eventually to cognitive impairment1. In this study, we use qGRE technique2 to evaluate neuronal composition of the hippocampal subfields and their relationship to cognitive impairment in AD. Quantifying neuronal loss in different hippocampal subfields is important as they control different biological functions.METHOD
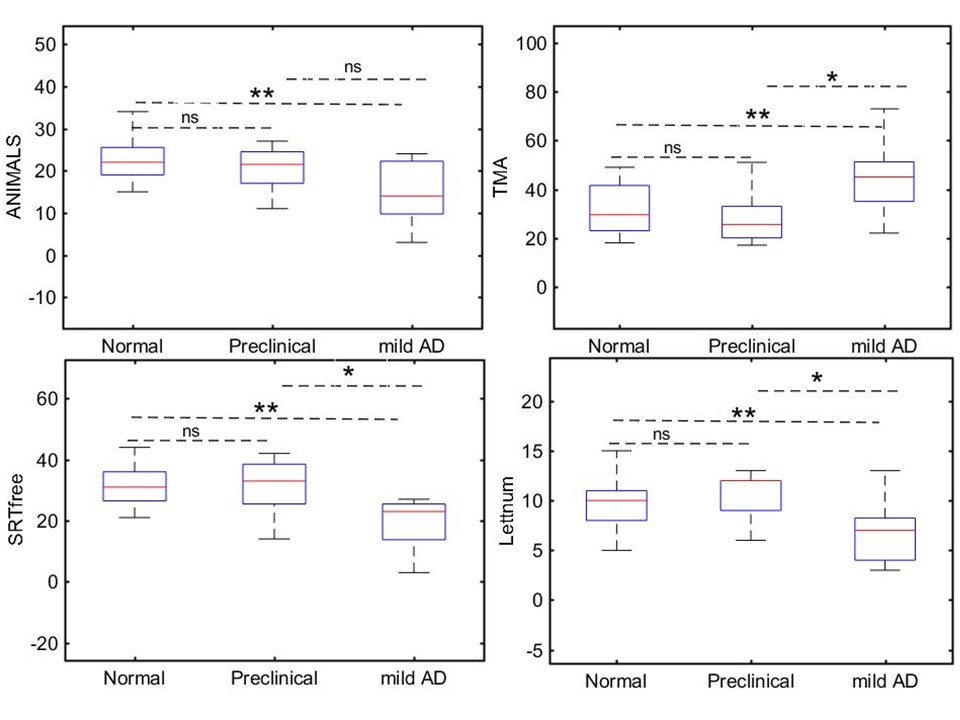
39 participants were recruited from the Washington University Knight Alzheimer Disease Research center and characterized by cognitive tests (Animal naming (ANIMALS), Trailmaking Test part A (TMA), Free and Cued Selective Reminding test free recall (SRTfree), and WAIS-III letter number sequencing (Lettnum)), clinical dementia rating (CDR)3, and Aβ status.
qGRE technique is based on 3D GRE MRI sequence with multiple gradient echoes, theoretical model4,5 of BOLD effect, and algorithms for correcting adverse effects of background field gradients6 and physiological fluctuations7. qGRE data were acquired on Siemens 3T scanner Trio and 32 channel RF coil with FOV 256x192x144 mm, repetition time TR=50 ms, flip angle 35°, 10 gradient echoes with first gradient echo time TE1 = 4 ms, echo spacing ∆TE = 4ms, voxel size (1x1x2 mm3). Phase stabilization echo was collected for each line in k-space to correct for image artefacts due to the physiological fluctuations. Data are analyzed using theoretical model2 allowing disentanglement of tissue-cellular-specific (R2t*) and BOLD-related contributions to the total qGRE signal:
$$S(TE)=S_0\cdot exp(-R2t^*\cdot TE-i\omega\cdot TE)\cdot F_{BOLD} (\delta\omega,dCBV,TE)\cdot F_{macro}(TE)$$
where S(0) is the GRE signal intensity amplitude, TE is the gradient echo time, Fmacro(TE) accounts for the adverse effects of macroscopic magnetic field inhomogeneities6, and function FBOLD(TE) accounts for the BOLD contributions2,4. Detailed description of the qGRE data analysis is available in2. As was demonstrated8 the R2t* metrics is directly related to the neuronal density of the remaining (after atrophy) tissue and can be characterized in terms of Neuronal Index;
$$R2t^*=5.8+20.4\cdot NI$$
In healthy human hippocampus NI=0.3-0.5, whereas NI=0 corresponds to total neuronal loss. Segmentation of hippocampal subfields (CA1, CA2, CA3/4, fimbria, hippocampal fissure, dentate gyrus (GC-DG), hippocampal-amygdaloidal transition area (HATA), molecular layer, subiculum, and para/presubiculum) were performed on T1-weighted scans using Freesurfer6.05.
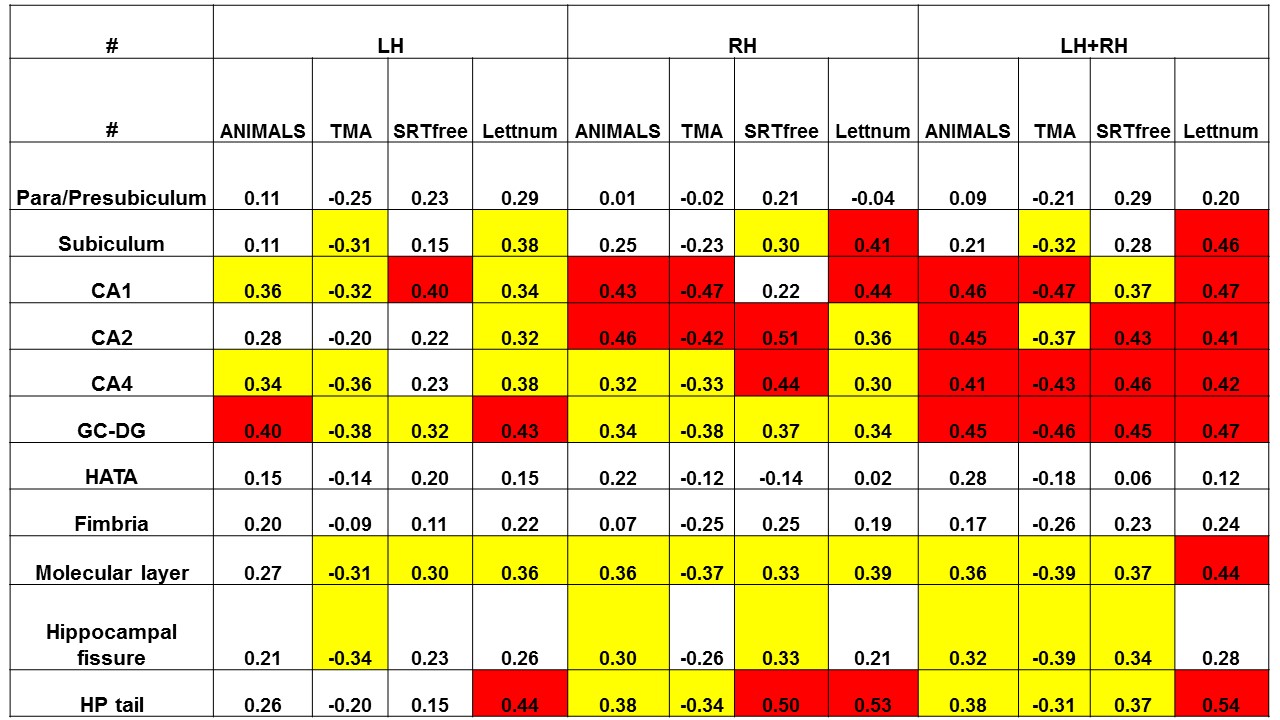
The study cohort was classified in three groups based on CDR and Aβ status: (1) Normal, CDR=0 & Aβ negative (n=21); (2) Preclinical, CDR=0 & Aβ positive (n=9); and (3) mild AD, CDR=0.5 or 1 & Aβ positive (n=9). In addition to regional NI we also evaluated normalized (by intracranial volume) regional volumes (NV) and correlated NI and NV in all hippocampal subfields with cognitive tests.
RESULTS AND DISCUSSION
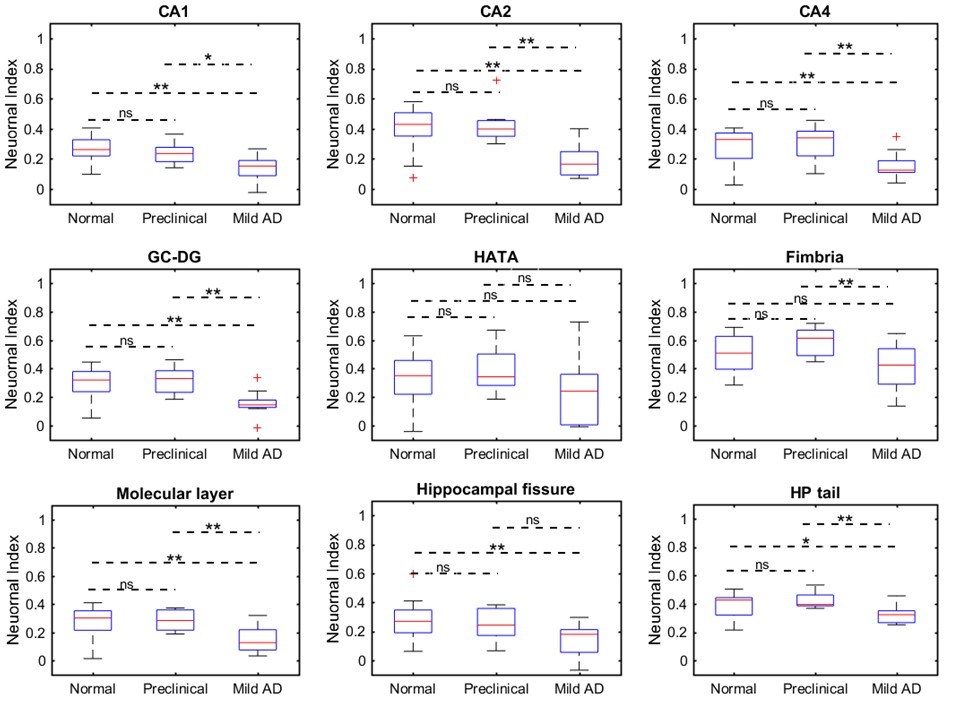
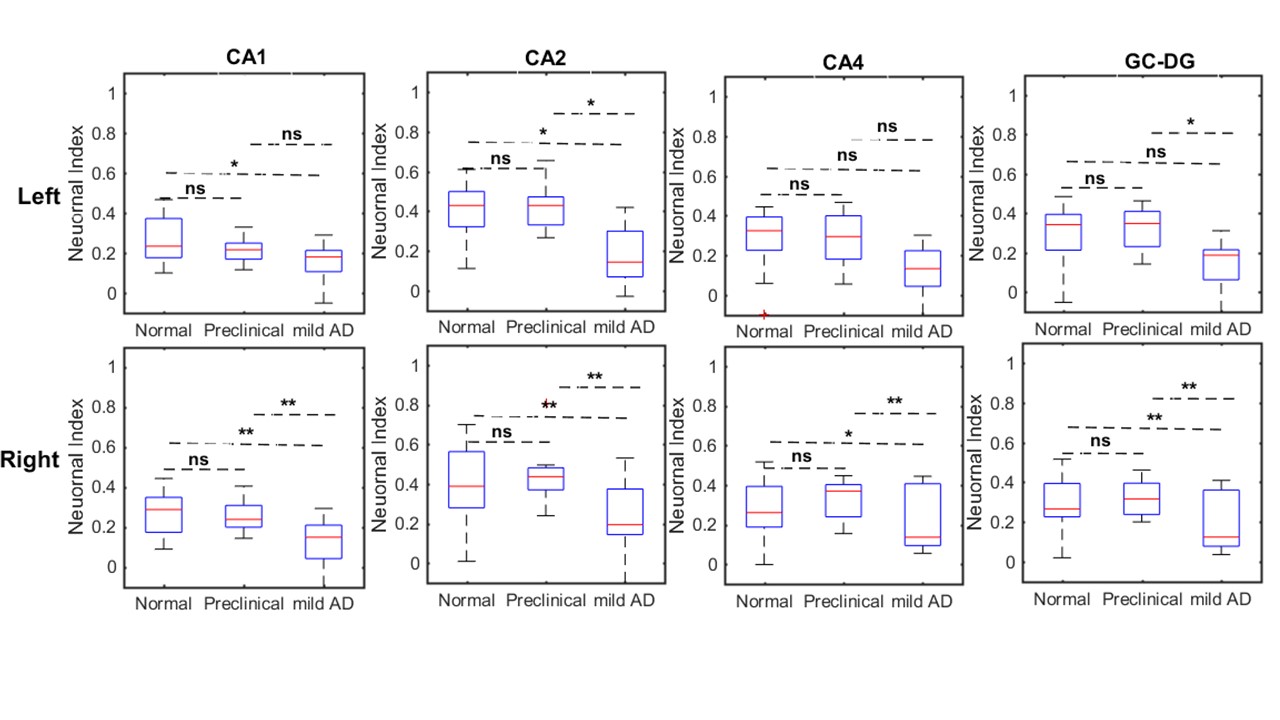
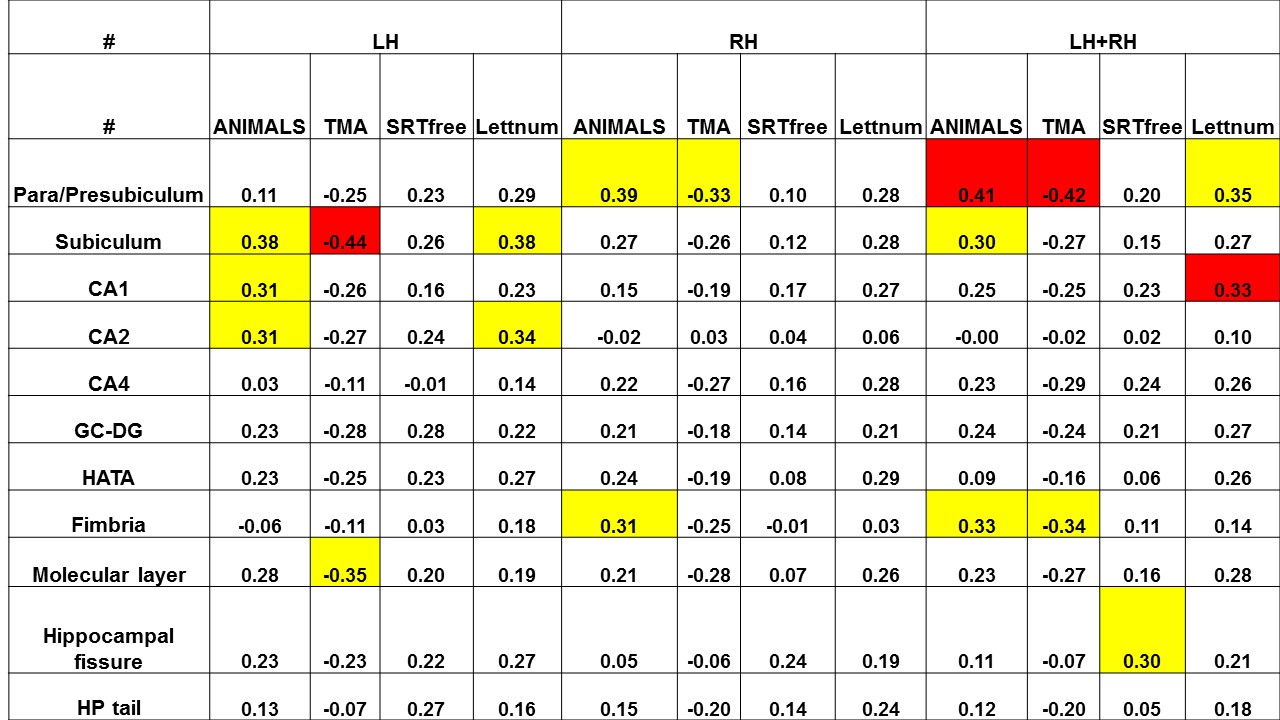
All cognitive tests show significant differences between Normal and mild AD groups and Preclinical and mild AD groups (P<0.05) except in verbal fluency (Fig. 1). NI (without differentiating Left and Right hemispheres) measurements also demonstrated significant differences between Normal and mild AD groups (P<0.05) in all subfields except in para/presubiculum, HATA, and the fimbria indicating significant neuron loss in mild AD participants (Fig. 2). The mean NI for the mild AD group was decreased by 20% (para/presubiculum), 30% (subiculum), 50% (CA1), 64% (CA2), 45% (CA3/4), 48% (GC-DG), 27% (HATA), 21% (fimbria), 46% (molecular layer), 48% (hippocampal fissure), and 19% (HP tail) as compared to normal. Further, we found significant group differences in the NI in the right hemisphere while the left hemisphere demonstrated significantly weaker differences indicating the Left/Right asymmetry in AD progression (Fig. 3). The NI measurements in CA1, CA2, CA4, GC-DG, molecular layer, and HP tail on the right side showed significantly stronger correlations with all cognitive tests (verbal fluency (R>0.35; P<0.01), verbal memory (R>0.35; P<0.01), working memory (R>0.35; P<0.01); attention (R<-0.35; P<0.01)), than on the left side (Fig. 4). On the other hand, the normalized volume (NV) showed significantly weaker (as compared to NI) correlation with cognitive tests (Fig. 5).
The significant difference between Normal and mild AD groups in NI measurements indicates the significant neuronal losses in hippocampal subfields in the mild AD group. The amount of neuron loss estimated by NI in the CA1 (50%) is in a close agreement with Price et al.9 who found 46% of neuron loss in the CA1 for mild AD group. We also have observed the significant volume differences between the normal the mild AD groups; however, the alternation of volume in hippocampal subfields correlates significantly weaker (compared to NI) with the cognitive tests which is in agreement with the previous report for the whole hippocampus8.
CONCLUSION
qGRE method identifies neuronal loss in mild AD that defines loss of cognitive function not recognized by measurement of tissue atrophy.Acknowledgements
Supported by NIH/NIA grant R01AG054513References
1. Jack CR, Bennett DA, Blennow K, et al. NIA-AA Research Framework: Toward a biological definition of Alzheimer's disease. Alzheimer's & Dementia. 2018;14(4):535-562.
2. Ulrich X, Yablonskiy DA. Separation of cellular and BOLD contributions to T2* signal relaxation. Magn Reson Med. 2016;75(2):606-615.
3. Morris JC. The Clinical Dementia Rating (CDR): current version and scoring rules. Neurology. 1993;43(11):2412-2414.
4. Yablonskiy DA, Haacke EM. Theory of NMR signal behavior in magnetically inhomogeneous tissues: the static dephasing regime. Magn Reson Med. 1994;32(6):749-763.
5. Yablonskiy DA. Quantitation of intrinsic magnetic susceptibility-related effects in a tissue matrix. Phantom study. Magnetic Resonance in Medicine. 1998;39(3):417-428.
6. Yablonskiy DA, Sukstanskii AL, Luo J, Wang X. Voxel spread function method for correction of magnetic field inhomogeneity effects in quantitative gradient-echo-based MRI. Magn Reson Med. 2013;70(5):1283-1292.
7. Wen J, Cross AH, Yablonskiy DA. On the role of physiological fluctuations in quantitative gradient echo MRI: implications for GEPCI, QSM, and SWI. Magn Reson Med. 2015;73(1):195-203.
8. Zhao Y, Raichle ME, Wen J, et al. In vivo detection of microstructural correlates of brain pathology in preclinical and early Alzheimer Disease with magnetic resonance imaging. Neuroimage. 2017;148:296-304.
9. Price JL, Ko AI, Wade MJ, Tsou SK, McKeel DW, Morris JC. Neuron number in the entorhinal cortex and CA1 in preclinical Alzheimer disease. Archives of neurology. 2001;58(9):1395-1402.
Figures