3177
Prediction of Mild Cognitive Impairment Patients based on VBM, DBM and SBM Analysis1Capital Medical University, Beijing, China, 2Clinical Science, Philips Healthcare, Guangzhou, China
Synopsis
Exploring reliable biomarkers is important for the clinical early detection of mild cognitive impairment (MCI) patients . This study investigated cerebral morphological abnormalities in MCI by combining three widely-used morphometry analysis methods (Voxel-based morphometry (VBM), deformation-based morphometry (DBM) and surface-based morphometry (SBM)) and constructed a set of classifiers to identify MCI patients from normal controls. The highest classification accuracy (91%) was reached when using combined morphological features (including gray matter volume, deformation, cortex thickness, gyrification index, sulcus depth and fractal dimension). Our results indicate that using combined morphological features could improve the performance of MCI prediction compared to using a single morphometry method
Introduction
Mild cognitive impairment(MCI) can be regarded as a transitional state between normal aging and Alzheimer’s disease(AD). Noninvasive diagnostic methods are desirable to identify MCI for early therapeutic inverventions. So it is necessary to explore reliable biomarkers for clinical MCI early detection. The aim of this study is to investigate morphological changes of MCI patients by using Voxel-based morphometry (VBM), deformation-based morphometry (DBM) and surface-based morphometry (SBM) methods1. In addition, different morphological characteristics were adopted as the classification features to explore the predictive performance.Methods
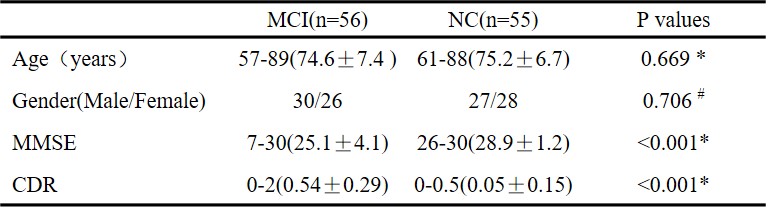
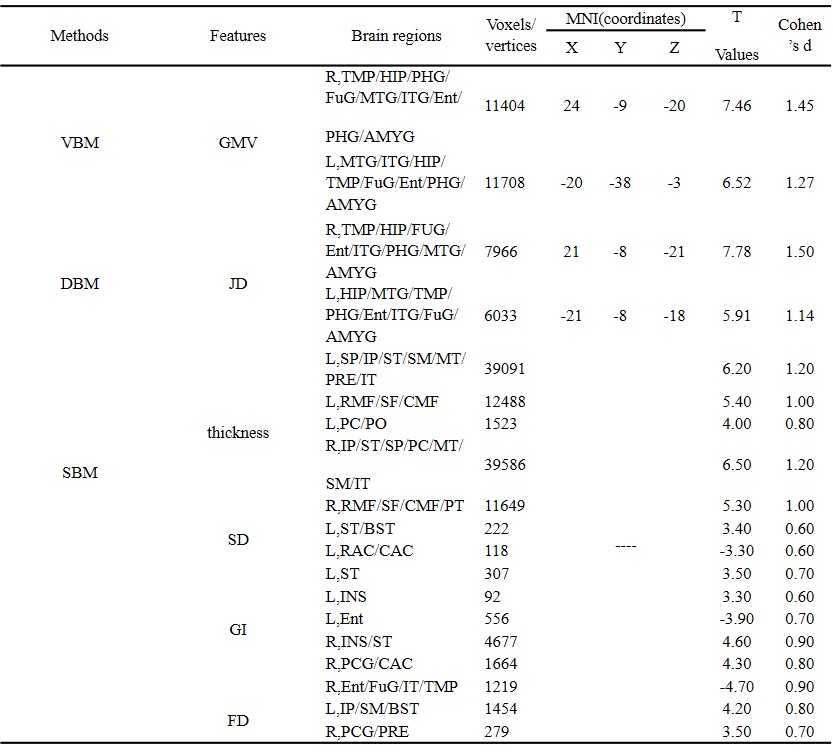
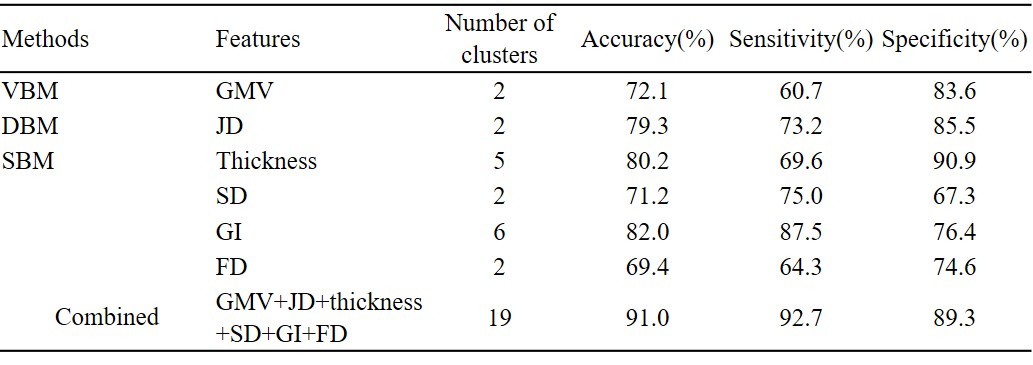
Fifty-six 3D T1W images of MCI patients and fifty-five T1W images of age- and sex- matched normal controls(NCs) were included in this study which obtained from the public Alzheimer’s Disease Neuroimaging Initiative(ADNI) database. Firstly, the structural MRI data were processed by VBM, DBM and SBM respectively using CAT12 toolbox based on SPM12. Then various morphological characteristics (gray matter volume (GMV) by VBM; Jacobian determinant value (JD) by DBM; thickness, sulcus depth (SD), gyrification index(GI) and fractal dimension(FD) by SBM ) were extracted based on the three morphometry analysis methods. Furtherly, multiple comparison two-sample t test (FWE correction with p<0.05 for GMV, JD and thickness; uncorrected with p<0.001 for SD, GI and FD) were performed on the processed images to detect the difference of MCI patients and NCs. Effect sizes are also reported using Cohen’s d. Finally, a classification based on support vector machine2 was adopted to discriminate MCI patients from NCs using the features extracted from the altered brain regions of VBM, DBM and SBM.Results
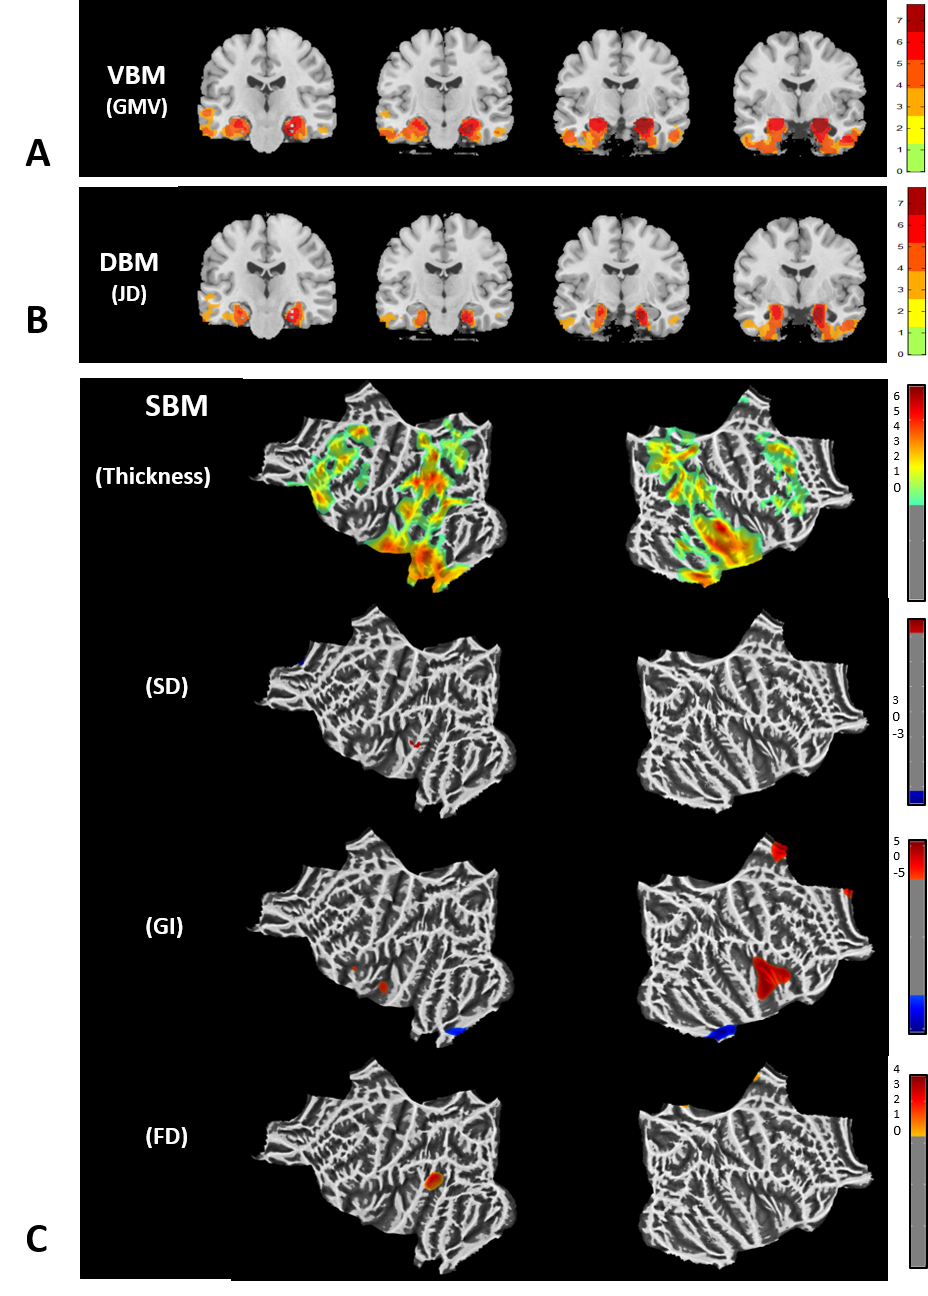
Details of demographics and neuropsychological information are presented in Table 1. Figure 1 shows the results of VBM, DBM and SBM and details were listed in Table 2. The best accuracy of 91% was obtained with combined morphological features extracted from VBM, DBM and SBM analysis. Table 3 listed the accuracy, sensitivity, and specificity for classification in detail.Discussion
Cerebral structural abnormalities in MCI patients could be detected from VBM, DBM and SBM. VBM detects altered brain regions primarily via evaluating the changes of gray matter volume, DBM reflects alterations mainly by Jacobian determinant produced during non-linearly registration process, which allows a direct estimation of the percentage change in volume in each voxel. Although the largest cluster was found by using VBM analysis, DBM revealed the largest cluster t-statistic and Cohen’s d. Different with other two methods focus on volume changes, SBM could reveal cerebral structural alterations in MCI patients from cortical properties with various surface morphological characteristics. Each method has its advantages and can be used to explore morphological abnormalities of human brain3. Using combined morphological features could enhance classification performance. The results are useful for the prediction of MCI patients in clinical practice.Conclusion
VBM, DBM and SBM methods both could detect cerebral morphological changes for MCI patients. Our results indicate that the features extracted from these methods could effectively identify the MCI patients and using combined morphological features could improve the performance of MCI prediction.Acknowledgements
No acknowledgement found.References
[1] Gaser C, Dahnke R. CAT-A computational anatomy toolbox for the analysis of structural MRI data. HBM 2016, 336-348.
[2] Carlos A, Eric W, Sebastian M, et al. Different multivariate techniques for automated classification of MRI data in Alzheimer’s disease and mild cognitive impairment[J]. Psychiatry Research: Neuroimging. 2013, 89-98.
[3] Scanlon C, Mueller S, Tosun D, et al. Impact of methodologic choice for automatic detection of different aspects of brain atrophy by using temporal lobe epilepsy as a model[J]. 2011, 1669-76.
Figures