3175
Susceptibility and Volume Changes of the Mammillary Bodies as a Function of Age for Healthy Individuals and Early Stage Dementia1Department of Radiology, Ruijin Hospital, Shanghai Jiao Tong University School of Medicine, Shanghai, China, 2Magnetic Resonance Innovations, Inc., Bingham Farms, MI, United States, 3The MRI Institute for Biomedical Research, Bingham Farms, MI, United States, 4Department of Neurology, Ruijin Hospital, Shanghai Jiao Tong University School of Medicine, Shanghai, China, 5Philips Healthcare, Shanghai, China, 6Department of Radiology, Wayne State University, Detroit, MI, United States
Synopsis
The mammillary bodies play an important role in episodic memory and spatial memory. However, few studies have focused on their properties in humans due to the limitations of the imaging techniques, their location and small size. In this study, we evaluate brain iron content and volume of the mammillary bodies in subjects with mild cognitive impairment (MCI), Alzheimer’s Disease and healthy individuals using quantitative susceptibility mapping and 3D T1-weighted imaging. There was a slight reduction in volume and increase in susceptibility with age and there were no differences of either susceptibility or volume among the three groups.
Introduction
Previous studies have shown excessive brain iron deposition and brain atrophy are associated with cognitive impairment in Alzheimer’s disease[1,2,3]. The mammillary body is an important component in Papez’ circuit, which is a network of related structures that support memory and cognition [4]. However, few studies have focused on the properties of the mammillary bodies in humans due to the limitations of imaging techniques, their location and small size. No one has yet investigated whether iron deposition and volume change in the mammillary bodies are associated with AD pathogenesis. In this work, we use quantitative susceptibility mapping (QSM) and 3DT1-weighted (T1W) imaging to investigate the susceptibility and volume change of the mammillary bodies in mild cognitive impairment (MCI), Alzheimer’s Disease and healthy individuals.Methods
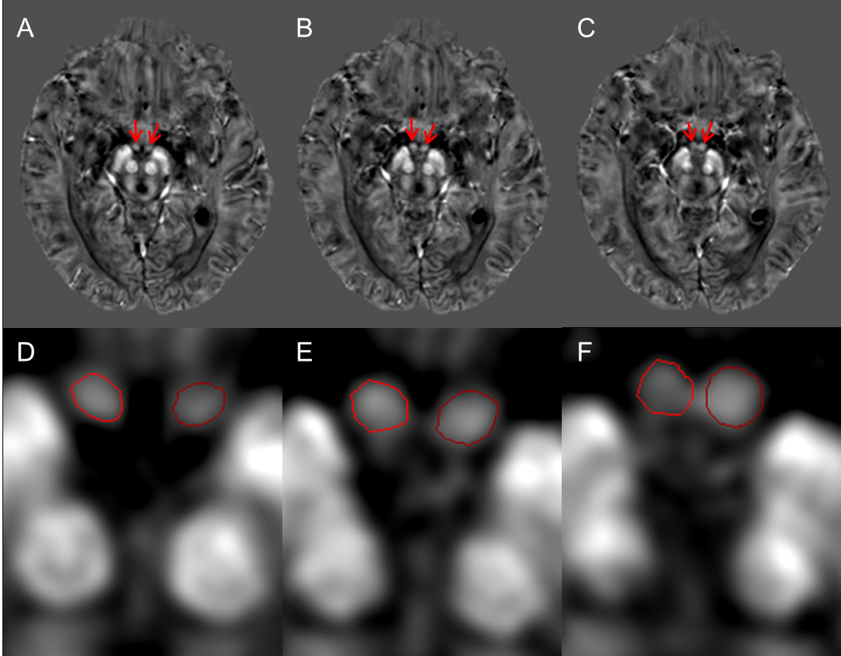
This study was approved by the local ethics committee and all subjects signed a consent form. Two sites were used in the QSM and T1 analysis. At site one, 171 healthy controls between 20 and 70 years old were imaged on a 1.5 Tesla GE Signa with a GRE sequence to collect magnitude and phase images with a voxel resolution of 0.46x0.46x3mm³. At site two, 16-echo GRE data and T1 data for 75 MCI subjects were collected on a 3.0 Tesla Philips Ingenia (27 QSM data were excluded due to head motion or other artifacts). In addition, 16-echo GRE data and T1 data for 51 age-matched healthy controls were collected on a 3.0 Tesla GE Signa HDxt scanner (33 QSM data were excluded due to head motion or other artifacts). All QSM data were collected with a voxel resolution of 0.86x0.86x1mm³ and T1 data were collected with a 1mm isotropic resolution. For the volume measurement, the mammillary bodies were traced on all T1 data (75 MCI, 9 AD, and 51 HC) zoomed 8x to collect volumes. For the susceptibility evaluation, QSM images of 171 healthy individuals at site 1 were processed using a custom algorithm [5]. At site 2, 16-echo GRE data for 48 MCI subjects and 18 HC were reconstructed using a custom algorithm [6]. The mammillary bodies were traced according to the contrast on QSM at a magnification of 8x (Fig. 1) using a full-width half maximum threshold, with manual adjustments as needed. Volumes, mean susceptibility, and maximum susceptibility were output. To determine clinical diagnosis, two neurologists with 3 years of experience each performed cognitive tests on the patients , including the Mini-Mental State Examination, the Clinical Dementia Rating, the Hamilton Depression Rating Scale, the Auditory Verbal Learning Test,the Rey–Osterrieth Complex Figure Test,the Boston Naming Test and the Activities of Daily Living Scale. The correlation of susceptibility and volume values with age was applied with Pearson’s correlation analysis.Results
For healthy individuals between 20 and 70 years old, there appears to be a slight increase in mean susceptibility and a significant increase in maximum susceptibility with age as shown in Figure 2. For MCI patients, AD patients and their age-matched healthy controls, Figure 3 shows a slight increase in mean susceptibility in HC group and it appears to be no change in the MCI group. Figure 4 shows a significant increase in maximum susceptibility with age in the HC group and no change in the MCI group. In addition, one MCI and 1 AD subject lie above the 95% prediction interval for maximum susceptibility. There was a slight reduction in volume with age for both MCI patients and HC as shown in Figure 5. Nevertheless, there appears no statistical differences of either susceptibility or volume among AD patients, MCI patients and healthy controls.Discussion
From the present work, we found there was a slight reduction in volume and increase in mean susceptibility of the mammillary bodies with age. Besides, A significant increase in maximum susceptibility with age is found in healthy individuals. One AD and MCI subject lie above the 95% prediction interval for maximum susceptibility. The increase of maximum susceptibility is likely due to the presence of increased local iron content, the source of which needs further investigation.Conclusion
In this work, a slight reduction in volume and a significant increase in local iron content with age was found in healthy individuals. These data serve as a starting point for incorporating age effects on volume and susceptibility for any future study of the mammillary bodies.Acknowledgements
The authors would like to acknowledge MR Innovations, India with assistance in data processing. The authors wish to thank all patients and healthy control subjects who participated in this study.References
1. Kim HG, Park S, Rhee HY, et al. Quantitative susceptibility mapping to evaluate the early stage of Alzheimer's disease. NeuroimageClin, 2017, 16:429-438.
2. Moon Y, Han SH, Moon WJ. Patterns of Brain Iron Accumulation in Vascular Dementia and Alzheimer’s Dementia Using Quantitative Susceptibility Mapping Imaging. J Alzheimer's Dis, 2016, 51(3):737-745.
3. Lopez OL, Becker JT, Chang YF, et al. Amyloid deposition and brain structure as long-term predictors of MCI, dementia, and mortality. Neurology, 2018, 90(21): e1920-e1928.
4. Vann SD, Nelson AJ, et al. The mammillary bodies and memory: More than a hippocampal relay. Prog Brain Res, 2015, 219:163-185.
5. Liu M, Liu S, Ghassaban K, et al. Assessing global and regional iron content in deep gray matter as a function of age using susceptibility mapping. J Magn Reson Imaging 2016,44:59-71.
6. Li W, Wu B, Liu C, et al. Quantitative susceptibility mapping of human brain reflects spatial variation in tissue composition. Neuroimage2011 55: 1645-1656.
Figures