3174
FLAIR-DTI joint analysis of periventricular white matter lesions for normal control, mild cognitive impairment, and Alzheimer’s disease1Psychiatry, New York University School of Medicine, New York, NY, United States, 2Radiology, New York University School of Medicine, New York, NY, United States
Synopsis
In patients with mild cognitive impairment from ADNI MRI database, joint analyses of FLAIR and diffusion-tensor MRI (DTI) find significant positive correlation between periventricular white matter lesion (PVWML) and ventricle volumes; and negative correlation between PVWML and grey matter thickness of four cortical regions. Furthermore, significant correlations were found between PVWML and DTI measures (FA, MD, AD and RD) within the WM in close proximity to four cortical regions, indicating the degenerative changes in remote subcortical WM regions that can be quantitatively evaluated with DTI. However, such correlations were not found in either normal controls or patients with AD.
Introduction
Recent studies showed age-related white matter lesions (WMLs) may play an important role in the neurodegeneration that leads to mild cognitive impairment (MCI)1,2 and eventually Alzheimer’s disease (AD)3,4. However, the exact mechanism has not been fully understood, partially due to the heterogeneous pathology of WMLs5. In this study we developed robust methods based on FLAIR and structural MRI to extract the periventricular WML (PVWML), a particular form of WMLs that is adjacent to the lateral ventricular system. We examined the relation between PVWML and the brain atrophy. Furthermore, using DTI fitting maps we examined the degenerative changes of white matter (WM) fibers connecting the PVWML and atrophic grey matter (GM) regions.Methods
Data: MRI data of 60 subjects with two time points (approximately 1 year apart) were downloaded from the Alzheimer’s Disease Neuroimaging Initiative database (ADNI). The subjects can be divided into three age- and gender-matched groups: normal control (NC), MCI and AD, with 20 subjects each. All subjects underwent whole-brain 3T MRI scans, including anatomical 3D T1-weighted SPGR6; 2D axial FLAIR (spin echo inversion recovery sequence, 5mm slice thicness, 256×256 matrix, TR=11000ms, TE=147ms)7, and diffusion-tensor imaging (DTI, 256×256 matrix; TR=9000ms, scan time=9min, b=1000s/mm2)6.
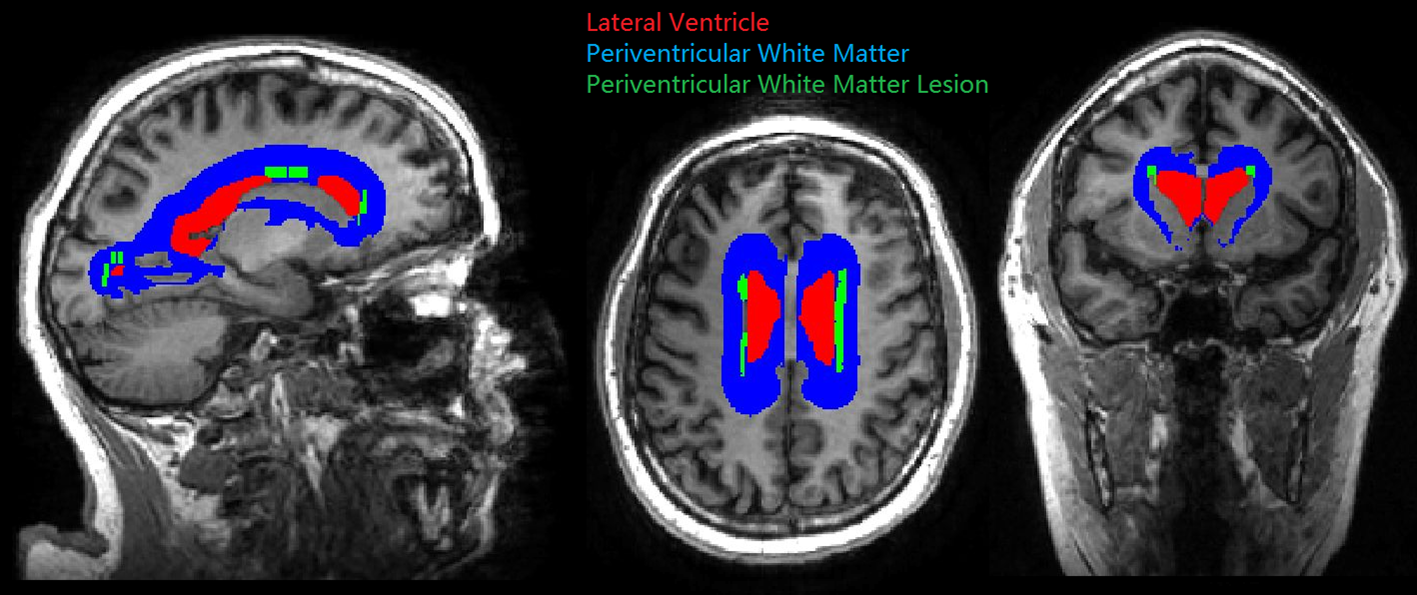
Image processing: Automated lesion segmentation was performed on FLAIR images with locally developed software. The generated lesion masks were quality controlled by a trained radiologist. The FLAIR images and lesion masks were co-registered to the structural images of same subject with FSL6.0. We generated the PVWML mask (Fig.1) by growing the lateral ventricle surface (using 10mm spherical kernel dilation) and then intersecting with the WM mask and co-registered lesion mask. Both the ventricle and WM masks were defined on structural images with Freesurfer6.0. The PVWML portion was computed by dividing the number of voxels of PVWML by total WML. The WML (i.e. without periventricular masking) and PVWML volumes were normalized by the total WM volume of same subject, and log-transferred for group difference tests and correlative studies. The longitudinal change of PVWML was computed by subtracting the normalized PVWML volume of the first time point from the second, then log-transferred. The DTI fitting maps were generated on DTI data with MRtrix3. Generated maps include Fractional Anisotropy (FA), mean diffusivity (MD), axial diffusivity (AD), and radial diffusivity (RD). The DTI images and fitting maps were co-registered to structural images with FSL6.0. The WM regions for local average DTI maps were derived (by proximity) from the Freesurfer GM parcellation on structural images with the Desikan-Killiany atlas8.
Statistical analyses: We performed two-sample t-tests on WML volumes, PVWML volumes, and PVWML portions between group pairs among NC, MCI and AD. We computed Pearson correlations between PVWML and ventricle volumes, and between PVWML volumes and cortical GM thickness (from Freesurfer, averaged over both hemispheres). For the cortical regions with thickness significantly correlated to PVWML volumes, we further computed the Pearson correlation between PVWML volumes (baseline, 2nd time point, and longitudinal change) and the DTI measures (mean FA, MD, AD, RD) in proximate WM.
Results and Discussion
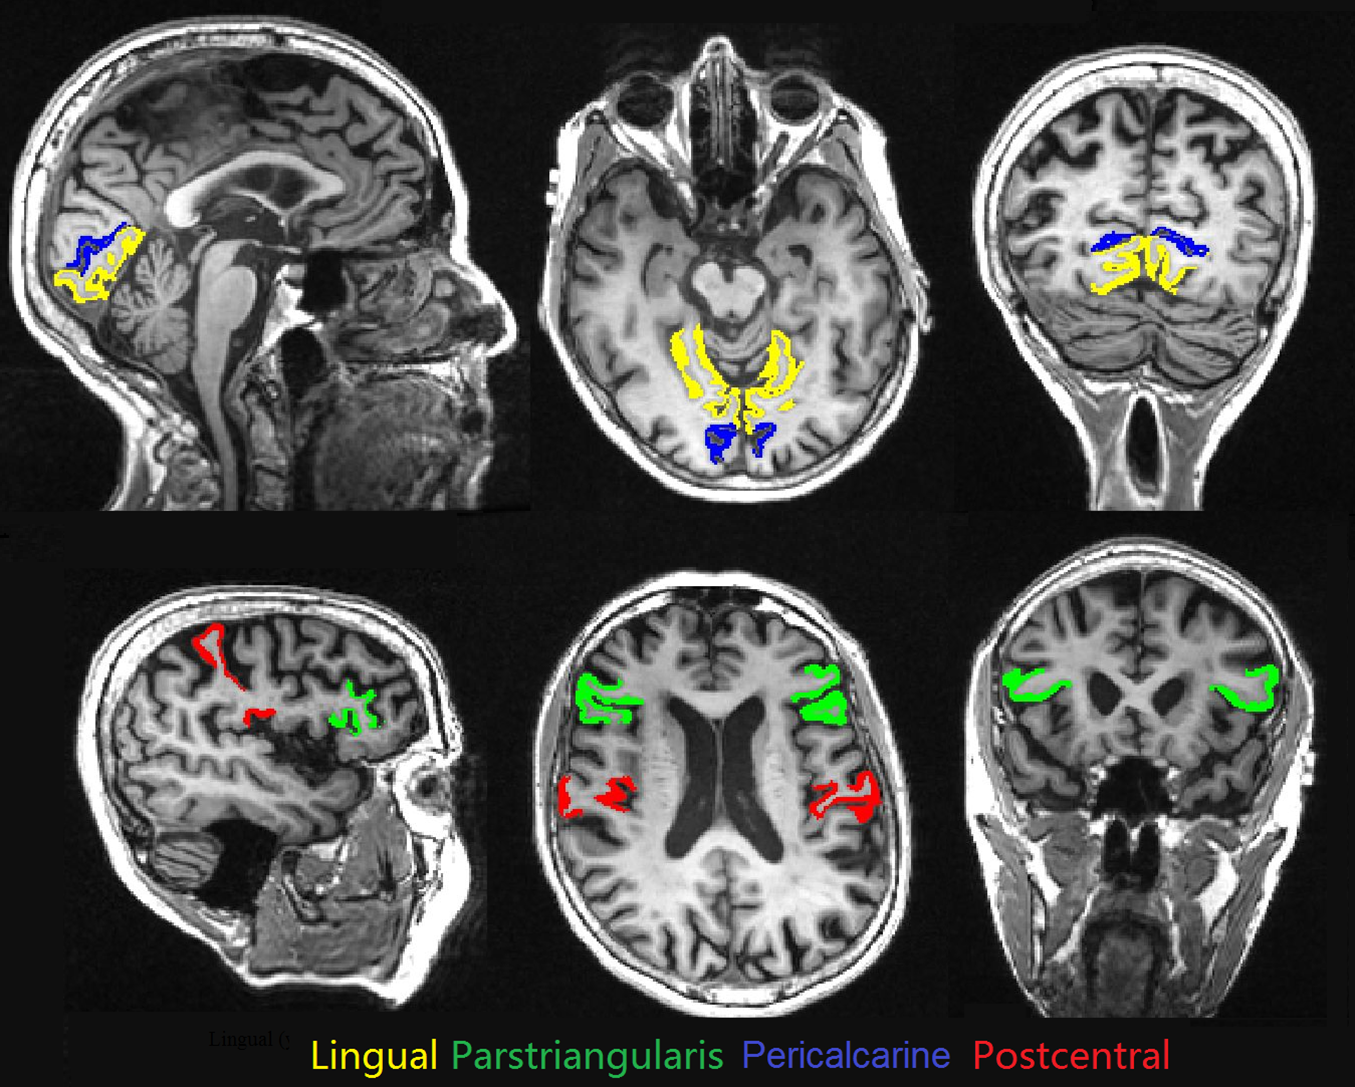
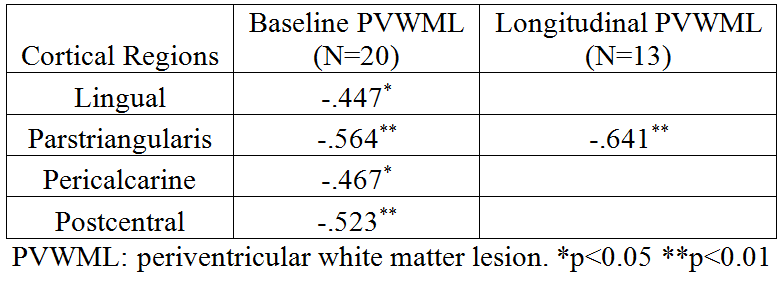
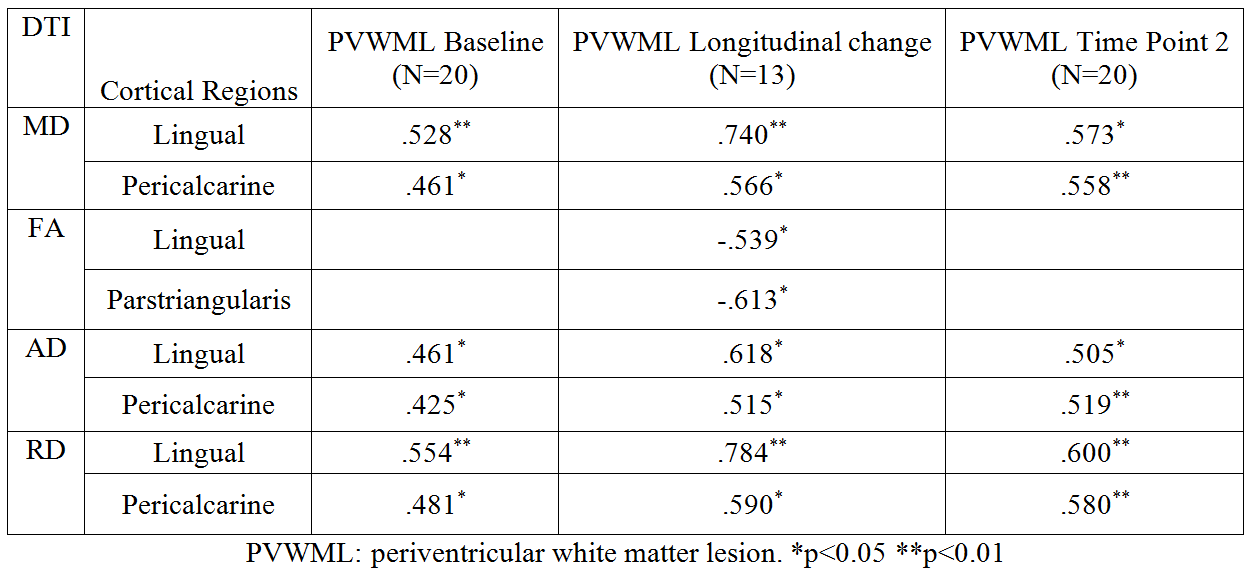
Significant group differences of WML volume were found between NC and MCI (p<0.01), and between NC and AD (p<0.01), but no significant difference detected between MCI and AD. Significant group differences of PVWML portion was found between NC and AD (p<0.05), but none detected between NC and MCI or between MCI and AD, suggesting similar prevalence of WM lesions in the whole brain between the two groups but higher for PVWML in AD than MCI. For MCI group, significant correlations were found between ventricle volume and baseline PVWML volume (r=0.50, p<0.05). This correlation was not detected in NC or AD, which may indicate that the central brain atrophy indicated by the enlarged ventricles is more correlated with the presence of PVWML at early than advanced stage of the disease. In MCI group, PVWML volume was found negatively correlated with the cortical thickness measurements of four cortical regions (Fig.2) (Tab.1). However, these significant correlations were not found in NC and AD groups. Also in MCI group, within the WM regions corresponding to the four detected cortical regions, the average DTI measures were found significantly correlated with PVWML volume (Tab.2).Conclusion
PVWML is particularly age-related and less pathologically heterogeneous than deep WML5,9. Robust PVWML masking method may lead to unbiased quantification of white matter abnormality in normal aging, MCI and AD. The findings of significant DTI changes in the remote subcortical WM regions indicate that diffusion MRI may provide valuable additional information of the hidden pathological changes of the fiber tracts between lesions and corresponding cortical GM.Acknowledgements
This work is supported in part by the National Institute of Health (NIH) grants: RF1 NS110041, R01 EB025133, and R01 EB025133-S2. This work is also supported in part by the Alzheimer's Disease Center (ADC) grant: P30 AG008051.
ADNI database was funded by the Alzheimer's Disease Neuroimaging Initiative (ADNI) (National Institutes of Health Grant U01 AG024904) and DOD ADNI (Department of Defense award number W81XWH-12-2-0012). ADNI is funded by the National Institute on Aging, the National Institute of Biomedical Imaging and Bioengineering, and through generous contributions from the following: AbbVie, Alzheimer’s Association; Alzheimer’s Drug Discovery Foundation; Araclon Biotech; BioClinica, Inc.; Biogen; Bristol-Myers Squibb Company; CereSpir, Inc.; Cogstate; Eisai Inc.; Elan Pharmaceuticals, Inc.; Eli Lilly and Company; EuroImmun; F. Hoffmann-La Roche Ltd and its affiliated company Genentech, Inc.; Fujirebio; GE Healthcare; IXICO Ltd.; Janssen Alzheimer Immunotherapy Research & Development, LLC.; Johnson & Johnson Pharmaceutical Research & Development LLC.; Lumosity; Lundbeck; Merck & Co., Inc.; Meso Scale Diagnostics, LLC.; NeuroRx Research; Neurotrack Technologies; Novartis Pharmaceuticals Corporation; Pfizer Inc.; Piramal Imaging; Servier; Takeda Pharmaceutical Company; and Transition Therapeutics. The Canadian Institutes of Health Research is providing funds to support ADNI clinical sites in Canada. Private sector contributions are facilitated by the Foundation for the National Institutes of Health (www.fnih.org). The grantee organization is the Northern California Institute for Research and Education, and the study is coordinated by the Alzheimer’s Therapeutic Research Institute at the University of Southern California. ADNI data are disseminated by the Laboratory for Neuro Imaging at the University of Southern California.
References
1. Bilello M, Doshi J, Nabavizadeh SA, Toledo JB, Erus G, Xie SX, et al. Correlating Cognitive Decline with White Matter Lesion and Brain Atrophy Magnetic Resonance Imaging Measurements in Alzheimer's Disease. Journal of Alzheimer's disease : JAD. 2015;48:987-94. doi:10.3233/JAD-150400.
2. Boyle PA, Yu L, Fleischman DA, Leurgans S, Yang J, Wilson RS, et al. White matter hyperintensities, incident mild cognitive impairment, and cognitive decline in old age. Annals of clinical and translational neurology. 2016;3:791-800. doi:10.1002/acn3.343.
3. Nasrabady SE, Rizvi B, Goldman JE, Brickman AM. White matter changes in Alzheimer's disease: a focus on myelin and oligodendrocytes. Acta neuropathologica communications. 2018;6:22-. doi:10.1186/s40478-018-0515-3.
4. de Leeuw F-E, Barkhof F, Scheltens P. Progression of cerebral white matter lesions in Alzheimer’s disease: a new window for therapy? Journal of Neurology, Neurosurgery and Psychiatry. 2005;76:1286-8. doi:10.1136/jnnp.2004.053686.
5. Kim KW, MacFall JR, Payne ME. Classification of white matter lesions on magnetic resonance imaging in elderly persons. Biological psychiatry. 2008;64:273-80. doi:10.1016/j.biopsych.2008.03.024.
6. Nir TM, Jahanshad N, Villalon-Reina JE, Toga AW, Jack CR, Weiner MW, et al. Effectiveness of regional DTI measures in distinguishing Alzheimer's disease, MCI, and normal aging. NeuroImage Clinical. 2013;3:180-95. doi:10.1016/j.nicl.2013.07.006.
7. Dadar M, Maranzano J, Ducharme S, Carmichael OT, Decarli C, Collins DL. Validation of T1w-based segmentations of white matter hyperintensity volumes in large-scale datasets of aging. Human brain mapping. 2018;39:1093-107. doi:10.1002/hbm.23894.
8. Desikan RS, Segonne F, Fischl B, Quinn BT, Dickerson BC, Blacker D, et al. An automated labeling system for subdividing the human cerebral cortex on MRI scans into gyral based regions of interest. NeuroImage. 2006;31:968-80. doi:10.1016/j.neuroimage.2006.01.021.
9. Gouw AA, Seewann A, van der Flier WM, Barkhof F, Rozemuller AM, Scheltens P, et al. Heterogeneity of small vessel disease: a systematic review of MRI and histopathology correlations. Journal of neurology, neurosurgery, and psychiatry. 2011;82:126-35. doi:10.1136/jnnp.2009.204685.
Figures