3173
Glutamate Weighted Imaging (GluCEST) as a Biomarker of Cognitive Function: Preliminary Findings from GluCEST MRI in Older Adults1Center for Magnetic Resonance and Optical Imaging, University of Pennsylvania, Philadelphia, PA, United States, 2Penn Memory Center, University of Pennsylvania, Philadelphia, PA, United States
Synopsis
We used glutamate weighted Chemical Exchange Saturation Transfer (GluCEST) imaging to investigate changes in glutamate concentrations in the brains of older adults. These are preliminary findings representing the data from subjects presenting with Mild Cognitive Impairment (MCI) (n=5) and similarly-aged healthy controls (n=5). In this cohort, we observed a trend of decreasing GluCEST contrast in multiple regions of the brain of MCI subjects when compared to control subjects. Especially interesting is the apparent global decrease in GluCEST contrast throughout the white matter of the MCI subjects.
Introduction
Alzheimer’s disease (AD) is the sixth leading cause of death in the US (1). It tends to present with progressive memory loss followed by decline in other cognitive domains, functional impairment, and often neuropsychiatric symptoms. The hallmark brain neuropathologies of AD include accumulations of extracellular amyloid-b (Ab) plaques and intracellular neurofibrillary tangles (NFTs). Accumulation of these protein deposits are associated with early synaptotoxicity and neurotransmitter alterations, gliosis, and ultimately loss of neurons and gross brain atrophy (2-6). Mounting evidence indicates that early cognitive changes in AD may result from dysregulation of excitatory glutamatergic neurotransmission by soluble Ab oligomers, leading to tau phosphorylation, glutamatergic over-stimulation of extra-synaptic N-methyl-D-aspartate receptors (ENMDARs) and synaptic alterations (1). It has been shown that synapse loss, rather than Ab plaques or NFTs, is the best correlate of memory deficits in AD (7, 8). Previous work in animal models of AD from our lab has demonstrated that decreasing GluCEST signal is correlated with synapse loss (9). In this study, we extend use of this technique to image the brains of human patients experiencing cognitive decline.Methods
Acquisition and Post-Processing
In routine experimental acquisition of GluCEST data, we acquire: the CEST
images at positive offset, the CEST images at negative offset, a water
saturation shift reference (WASSR) scan for B0 mapping, a flip/crush
GRE sequence for B1 mapping, a T1 map (MP2RAGE) and a
reference scan without any saturation. CEST data were corrected for B0
inhomogeneity as previously described in (10). The method used in this study
for correcting the data for B1 inhomogeneity is newly developed, and
particularly improves results in slices with a high degree of B1
drop-off and a diversity of anatomical structures (12). B1-corrected
negative and positive images are subtracted and normalized by the negative
offset image to give the B1-corrected CEST contrast. CEST-related
images are collected only for single slice. Whole-brain T1 and T2
weighted images are also collected.
Analysis
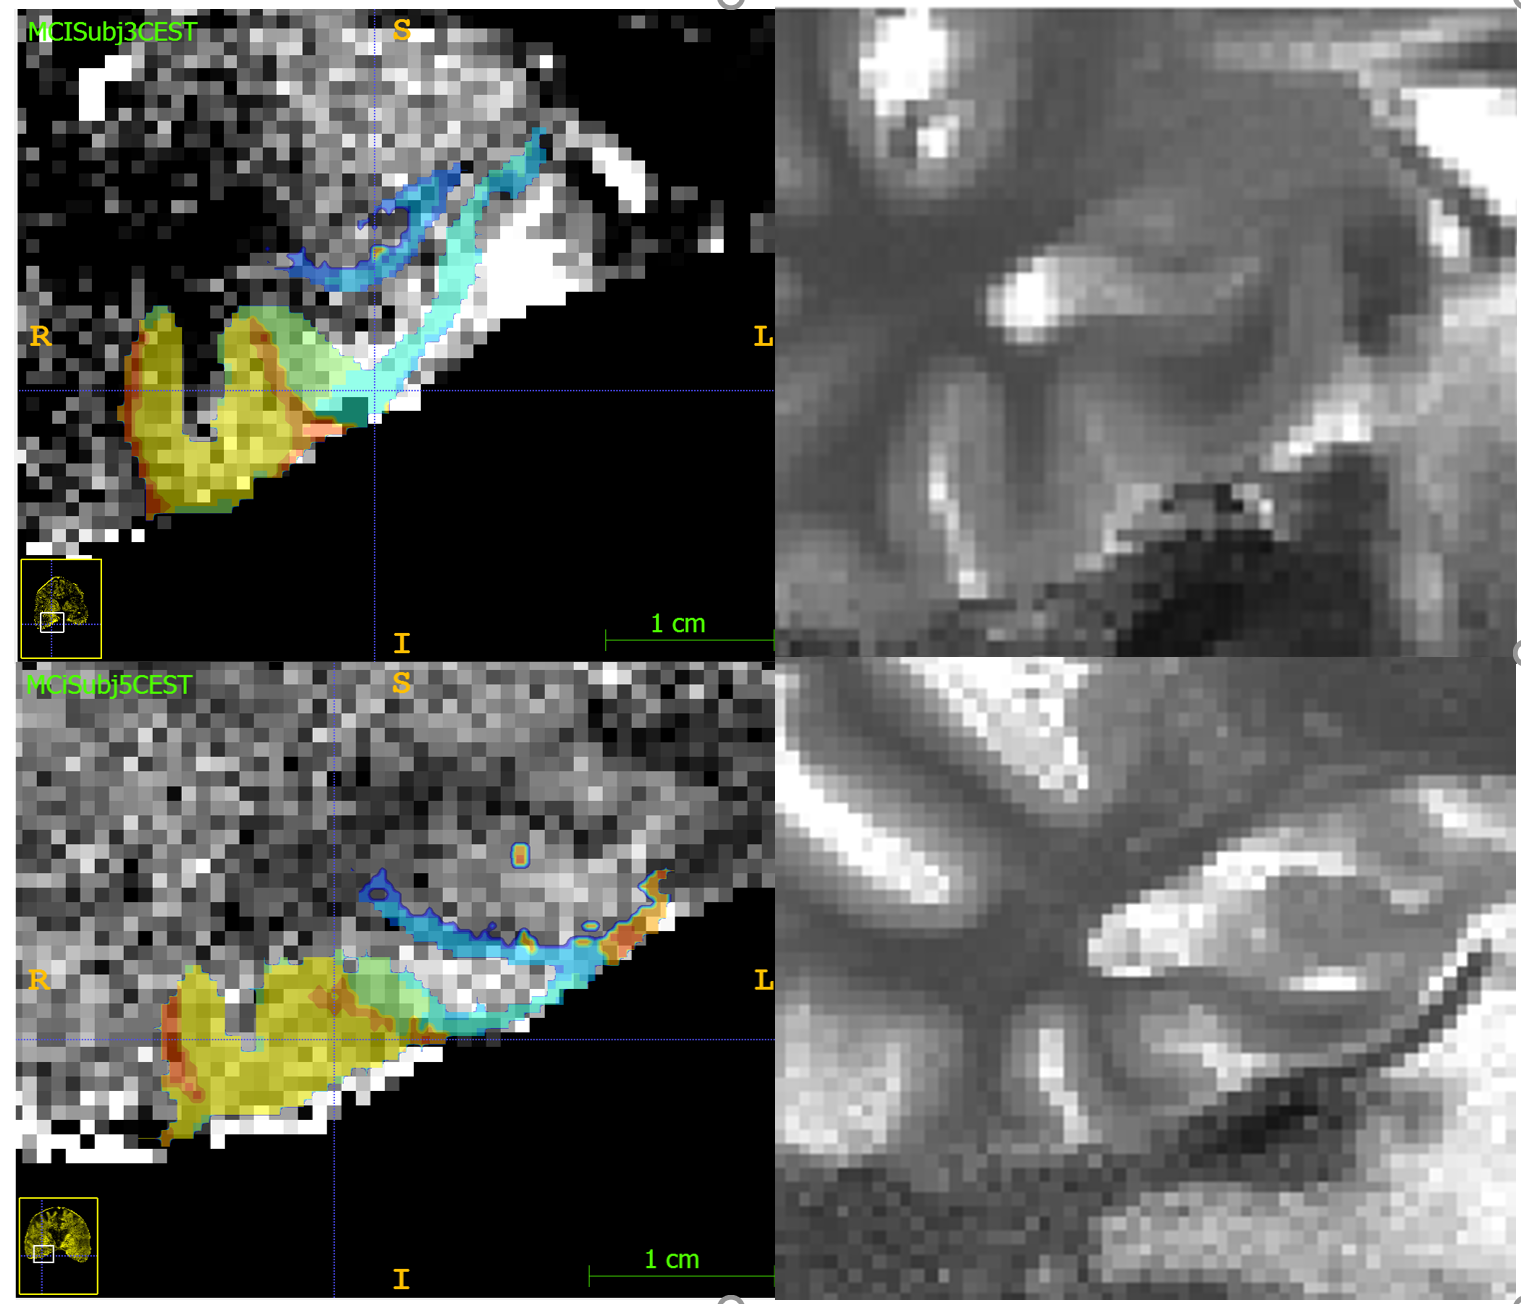
T1 and T2-weighted images were used to perform
segmentation of Medial Temporal Lobe structures using the Penn Memory Center
(PMC) atlas available in ITK-SNAP’s Distributed Segmentation Service (11). CEST
images are registered to the T2 images, allowing for MTL sub-region
segmentation. Functions from the c3d library available in ITK-SNAP were then
used to calculate thresholded averages over pixels assigned to a particular region.
Results
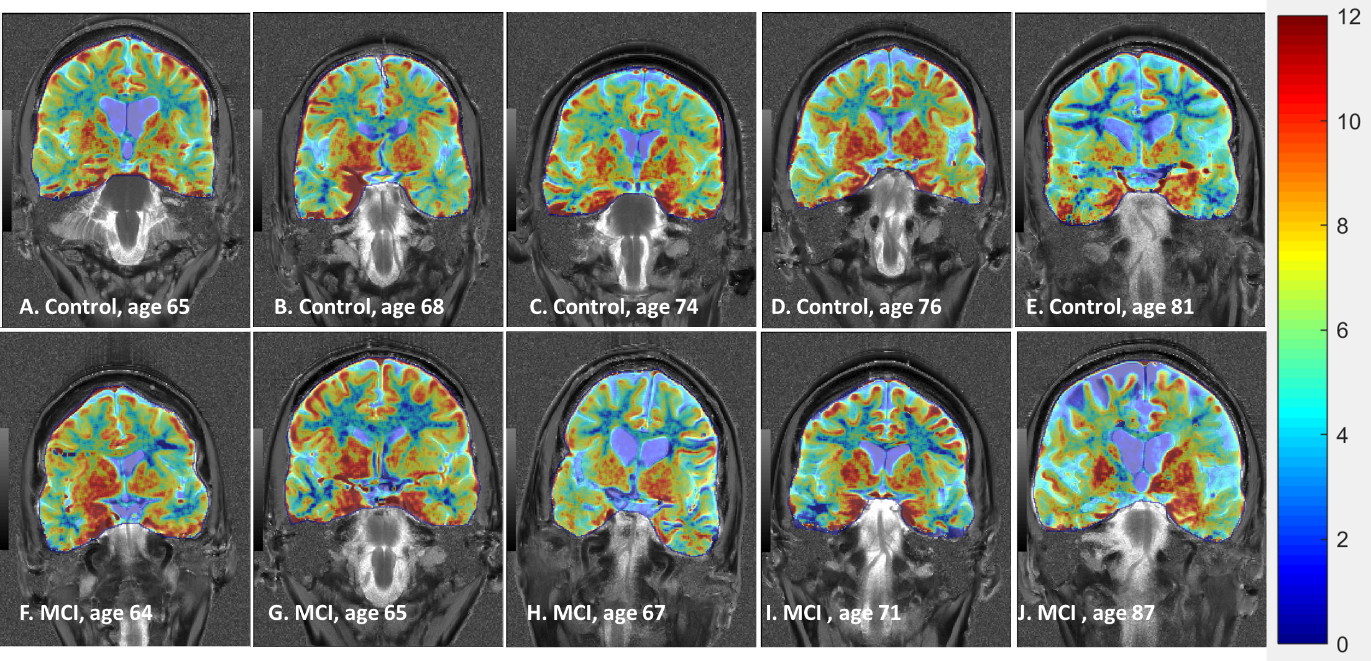
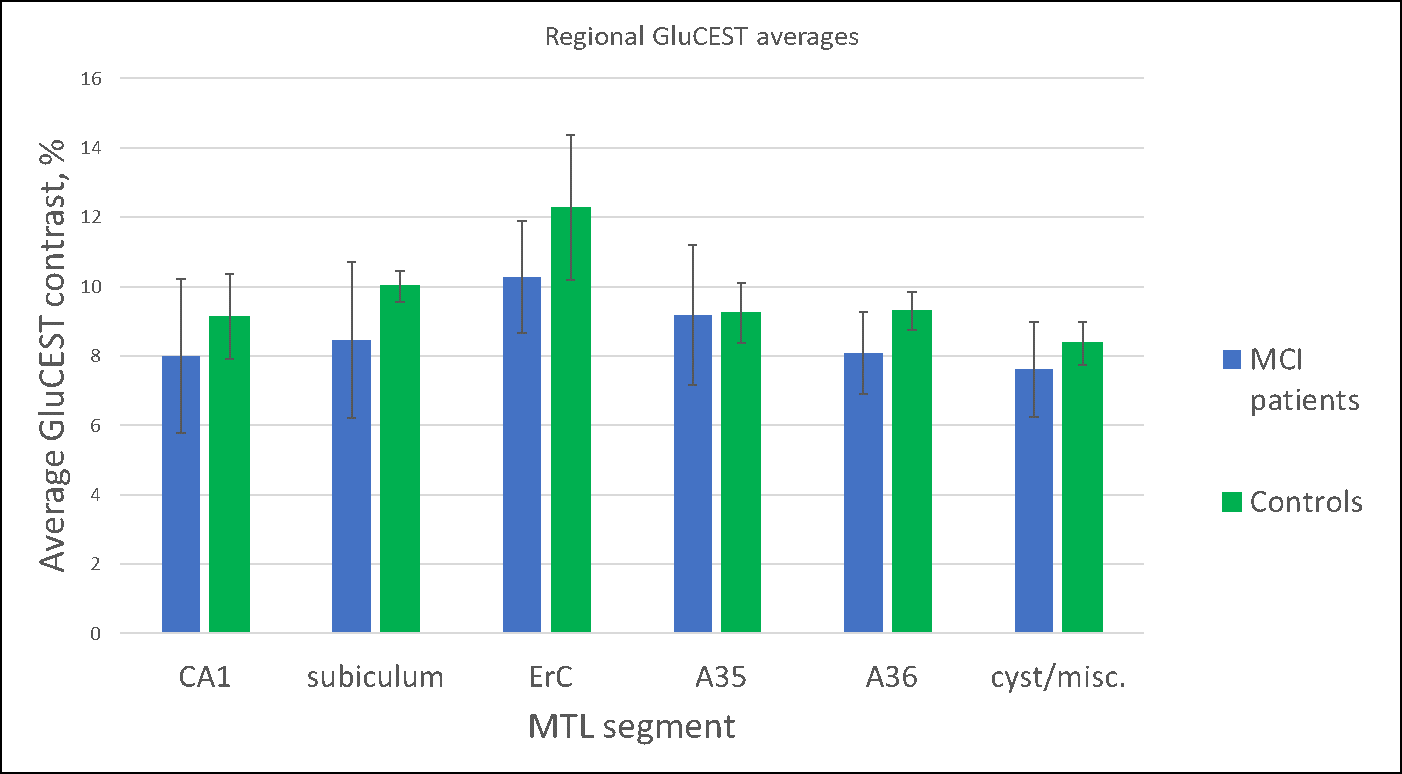
Our preliminary results to date (5 MCI subjects; 5 controls) exhibit trends in the GluCEST signals in both gray and white matter. On average, healthy subjects had higher GluCEST values in both medial temporal lobe (MTL) regions of interest (Plot 1) and in white matter throughout the whole imaging slice (see Figure 1). However, the GluCEST signal from gray matter averaged over the whole slice did not show a noticeable trend.Discussion
We found that GluCEST appears to be reduced in the medial temporal lobe of MCI patients, consistent with reductions previously demonstrated in an AD model (9).However, more data are required to draw definitive inferences. It appears that there is a trend of lower GluCEST values across the entire slice in MCI subjects relative to healthy controls. This trend held in all cases other than in a pair of subjects above 80 years of age. In this case, the MCI subject (87 y.o.a.) shows significant overall atrophy, such that direct comparison is difficult and segmentation is less reliable. The low white matter GluCEST values in our oldest control subject (81 y.o.a.) suggest that this decrease may be a component of normal aging, and that subjects suffering from Mild Cognitive Impairment may begin experiencing this loss much earlier than their healthy counterparts.Summary
To our knowledge, this is the first study using GluCEST to image the brains of human subjects with mild cognitive impairment. Although observed GluCEST is only ~70% specific to glutamate, it offers large advantages over MR spectroscopy-- the dominant non-invasive technique for metabolite detection-- in sensitivity and spatial resolution. Our findings to date are consistent with existing literature demonstrating decreases in glutamate in the brains of MCI or AD patients (13-16). We may be able to apply what was learned previously in GluCEST and histology experiments in animals to interpret findings in human patients. Further studies are ongoing.Acknowledgements
Research reported in this publication was supported by the National Institute of Biomedical Imaging and Bioengineering of the National Institutes of Health under award Number P41EB015893. The authors wish to thank the subjects for their participation and Jacqueline Lane for excellent efforts as study coordinator.References
1. Rudy C, Hunsberger H, Weitzner D, Reed M. The Role of the Tripartite Glutamatergic Synapse in the Pathophysiology of Alzheimer's Disease. Aging and Disease. 2015;6(2):131-48. Epub DOI : 10.14336/AD.2014.0423. doi: 10.14336/AD.2014.0423. 2. Yankner BA. Mechanisms of neuronal degeneration in Alzheimer's disease. Neuron. 1996;16(5):921-32. PubMed PMID: 8630250. 3. Heininger K. A unifying hypothesis of Alzheimer's disease. III. Risk factors. Hum Psychopharmacol. 2000;15(1):1-70. doi: 10.1002/(SICI)1099-1077(200001)15:1<1::AID-HUP153>3.0.CO;2-1. PubMed PMID: 12404343. 4. Bell KF, Claudio Cuello A. Altered synaptic function in Alzheimer's disease. Eur J Pharmacol. 2006;545(1):11-21. Epub 2006/06/27. doi: 10.1016/j.ejphar.2006.06.045. PubMed PMID: 16887118. 5. Citron M. Alzheimer's disease: strategies for disease modification. Nat Rev Drug Discov. 2010;9(5):387-98. doi: 10.1038/nrd2896. PubMed PMID: 20431570. 6. Braak H, Braak E, Bohl J. Staging of Alzheimer-related cortical destruction. Eur Neurol. 1993;33(6):403-8. doi: 10.1159/000116984. PubMed PMID: 8307060. 7. Terry RD, Masliah E, Salmon DP, Butters N, DeTeresa R, Hill R, Hansen LA, Katzman R. Physical basis of cognitive alterations in Alzheimer's disease: synapse loss is the major correlate of cognitive impairment. Ann Neurol. 1991;30(4):572-80. Epub 1991/10/01. doi: 10.1002/ana.410300410. PubMed PMID: 1789684. 8. Makin S. The amyloid hypothesis on trial. Nature. 2018;559(7715):S4-S7. doi: 10.1038/d41586-018-05719-4. PubMed PMID: 30046080. 9. Crescenzi R, DeBrosse C, Nanga RPR, Reddy S, Haris M, Hariharan H, Iba M, Lee VMY, Detre JA, Borthakur A, Reddy R. In vivo measurement of glutamate loss is associate with synapse loss in a mouse model of tauopathy. NeuroImage 101 (2014) 185-192. 10. Cai K, Haris M, Singh A, Kogan F, Greenburg JH, Hariharan H, Detre JA, Reddy R. 2012. Magnetic Resonance Imaging of Glutamate. Nature Medicine, 18:22 (302). 11. Yushkevich PA, Piven J, Hazlett HC, Smith RG, Ho S, Gee JC, Gerig G. User-guided 3D active contour segmentation of anatomical structures: Significantly improved efficiency and reliability. Neuroimage 2006 Jul 1;31(3):1116-28. 12. Cember et al, in preparation 13. Greenamyre JT, Maragos WF. 1993. Neurotransmitter receptors in Alzheimer-disease. Cerebrovasc. Brain Metab. Rev. 5 (2), 61-94. 14. Minkeviciene R, Ihalainen J, Malm T, Matilainen O, Keska-Goldstein V, Goldsteins G, Iivonen H, Leguit N, Glennon J, Koistinaho J, Banerjee P, Tanila H. 2008. Age-related decrease in stimulated glutamate release and vesicular glutamate transporters in APP/PS1 transgenic and wild-type mice. J. Neurochem. 105 (3), 584-594. 15. Nilsen LH, Rae C, Ittner LM, Goetz J, Sonnewald U. 2013. Glutamate metabolism is impaired in transgenic mice with tau hyperphosphorylation. J. Cereb. Blood Flow Metab. 33 (5), 684-691. 16. Rupsingh R, Borrie M, Smith M, Wells JL, Bartha R. 2001. Reduced hippocampal glutamate in Alzheimer disease. Neurobiol. Aging 32 (5), 802-810.Figures