3170
Does obesity cause limbic neuroglia changes that may precede Alzheimer's disease? An MRI causal analysis investigation using quantitative magnetisation transferFabrizio Fasano1, John Evans2, Cyril Charron2, Derek Jones2, and Claudia Metzler-Baddeley2
1Siemens Healthcare Ltd, Frimley, Camberley, United Kingdom, 2CUBRIC, Cardiff University, Cardiff, United Kingdom
Synopsis
By a causal analysis approach, we investigated the effect that an “intervention” on healthy population weight would produce on hippocampus macromolecular exchange rates. The quantitative magnetisation transfer index forward exchange rate (kf) is recognised to be lowered by myelin/axonal membrane loss and neuroinflammation. We found that, especially in over 56 years aged male subjects, forcing the weight to stay below the overweight threshold (waist-to-hip ratio 0.9) may dramatically reduce low macromolecular exchange rate occurrences in the population.
Introduction
Obesity and age are well-known risk factors for Alzheimer's disease. Previous investigations showed a reduction in the quantitative Magnetisation transfer (qMT) forward exchange index (kf) in both grey and white matter areas involved in Alzheimer disease progression. The reduced capacity of macromolecules to exchange magnetisation with surrounding water molecules is believed to be a signal of axonal membranes, myelin damage and neuroinflammation1-4. We recently proposed a model assuming obesity may produce early limbic grey matter regions changes through the mediation of white matter limbic connections5. We focus here specifically on kf index in Fornix and Hippocampus. We investigated the model through a causal analysis approach. Causal inference6 is today used intensively in epidemiology, social sciences and econometrics. The distinct power of causal analysis approaches is to actively use both prior knowledge and experimenter hypothesis to simulate a true-experiment (i.e. an "interventional" study like a random trial) only on the basis of observational data (i.e. by performing an "observational" study).Aim
Our aim is to answer to the following counterfactual questions: “which percentage of the study population would have presented reduced macromolecular exchange in the hippocampus, given the whole study population would have been forced to be not overweight?”.Methods
We collected age, waist-to-hip ratio (whr) and Magnetic resonance imaging (MRI) data on a cohort of 151 healthy volunteers (85 females and 56 males, aged 56±8y). MRI acquisitions were performed on a 3T MAGNETOM Prisma clinical scanner equipped with a 32-channel receiver head coil (Siemens Healthcare, Erlangen, Germany). We acquired: 1) a qMT dataset, as reported in7; 2) a High Angular Resolution Diffusion Imaging (HARDI) dataset; 3) a high resolution 3D-T1 magnetization-prepared rapid gradient-echo (MPRAGE). From them we extracted respectively: 1) qMT maps, including kf, as previously reported by Cercignani et al.7; 2) fornix tracts, using an home made artificial intelligence based automated tract recognition script and ExploreDTI8; 3) hippocampus volumes of interest, using Freesurfer9. For each subject, after inter-modality mutual information affine registration by ANTs10, we calculated the mean kf on fornix (fornix_kf) and bilateral hippocampus (hc_kf). We performed analysis in both a continuous, by Structured Equation model (SEM), and discretised way, by Probabilistic SEM (PSEM). Continuous approach was realised on the original data (age, whr, hc_kf, fornix_kf) using TETRAD software (Carnegie Mellon University, Pittsburgh, PA, UShttp://www.phil.cmu.edu/tetrad/). Discretised approach was realised on discrete data (gender plus binned age, whr, hc_kf, fornix_kf) using BayesiaLab software (Bayesia S.A.S.,Changé, France https://www.bayesia.com). Firstly, we instantiated a SEM in TETRAD, and evaluated it against our data (see Figure 1). As we know gender may affect whr, hc_kf and fornix_kf, but being a discrete variable cannot be used in our continuous variable SEM, we stratified data by gender (i.e. performed separate analysis for male and female groups). SEM coefficients were computed by multilinear regression, and p-value was estimated, being null-hypothesis a zero coefficient. Model was estimated by comparing the covariance matrix implied by estimated coefficients with the true data covariance matrix. A chi-square statistics was produced and a p-value was determined, being null-hypothesis a correctly specified model. Secondly, we crated a PSEM in BayesiaLab (see Figure 2), and estimated the model Joint Probability Distribution. We examined its fitness by Contingency Table Fit (CFT) score, based on log-likelihood11, and ranging between 0% (completely disconnected network) and 100% (fully connected). We set whr as intervention variable and simulated the effect of eliminating overweight occurrences in males and female subpopulations for both age ranges.Results
In males, all effects in the SEM were found to be highly significant, and the analysis of induced covariance matrix showed that the null hypothesis cannot be rejected, confirming our causal model is consistent with the data. Differently than for male group, in female group only age was found to cause kf variations. The CTF score for the model was find to be 85%. For pre-intervention probability distribution and for intervention results see respectively Figure 2 and Figure 3. As expected from TETRAD analysis, intervention on females’ whr did not produce significant effects. On the contrary, on males’ group, the intervention did decrease the occurrence of lower kf values in the population.Discussion
Our results show that the age is an important factor in determining kf decrease, and that the body weight may affect in a different ways males and females, as well as the different ages. In particular, on older than 56 years males, intervention on weight may reduce dramatically the occurrence of low macromolecular exchange rates, possible indicator of inflammation and myelin/axonal damages.Acknowledgements
We acknowledge Lionel Jouffe and Bayesial S.A.S. for providing a trial licence of ByesiaLab software, as well as Greg D Parker, for sharing with CUBRIC community his automated script for white matter tracts extraction.References
- Harrison NA et al. Quantitative Magnetization Transfer Imaging as a Biomarker for Effects of Systemic Inflammation on the Brai. Archival Report 2015; 78:49-57.
- Kiefer C et al. Multi-parametric classification of Alzheimer's disease and mild cognitive impairment: The impact of quantitative magnetization transfer MR imaging. Neuroimage. 2009;48:657-667
- Giulietti G et al. Quantitative magnetization transfer provides information complementary to grey matter atrophy in Alzheimer's disease brains. Neuroimage. 2012; 59:1114-1122.
- Makovaca et al. Quantitative Magnetization Transfer of White Matter Tracts Correlates with Diffusion Tensor Imaging Indices in Predicting the Conversion from Mild Cognitive Impairment to Alzheimer’s Disease. JAD. 2018;63:561-575
- Pearl J. Causality: Models, Reasoning and Inference 2nd Ed Cambridge University Press, New York, NY, USA. 2009
- Mettzler-Baddeley C et al. The causal structure of age-dependent limbic decline: fornix white matter glia damage causes hippocampal grey matter damage, not vice versa. BioXriv preprint. https://doi.org/10.1101/440917
- Cercignani M and Alexander DC. Optimal acquisition schemes for in vivo quantitative magnetization transfer MRI. Magn Reson Med. 2006 56(4):803-810.
- Leemans A et al. ExploreDTI: a graphical toolbox for processing, analyzing, and visualizing diffusion MR data. Proc Intl Soc Mag Reson Med. 2009:3537
- Reuter M et al. Within-Subject Template Estimation for Unbiased Longitudinal Image Analysis. Neuroimage. 2012;61(4):1402-1418.
- Avants, BB. Symmetric diffeomorphic image registration with cross-correlation: evaluating automated labeling of elderly and neurodegenerative brain. Med. Image Anal. 2008;12(1):26–41.
- Koller D, Friedman N. Probabilistic Graphical Models: Principles and Techniques. Chapter 21. MIT Press, Cambridge. 2009.
Figures
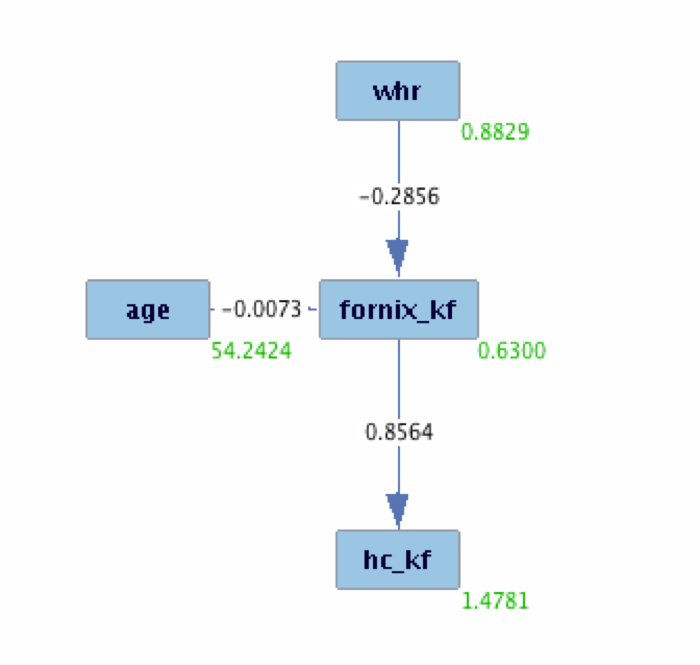
Our Causal Model directed acyclic graph (DAG) in TETRAD. In SEM implementation, the gender discrete variable is not included in the DAG, and data are stratified by gender groups. We also analysed models connecting age with whr and hc_kf, but age was found to not correlate with whr and hc_kf, thus we did not depict those connections. The values superimposed are the ones estimated for males group. In black the SEM Coefficient, i.e. the effect of unitary changes in the value of one variable on the variable connected by the arrow. In green, the mean values on the population.
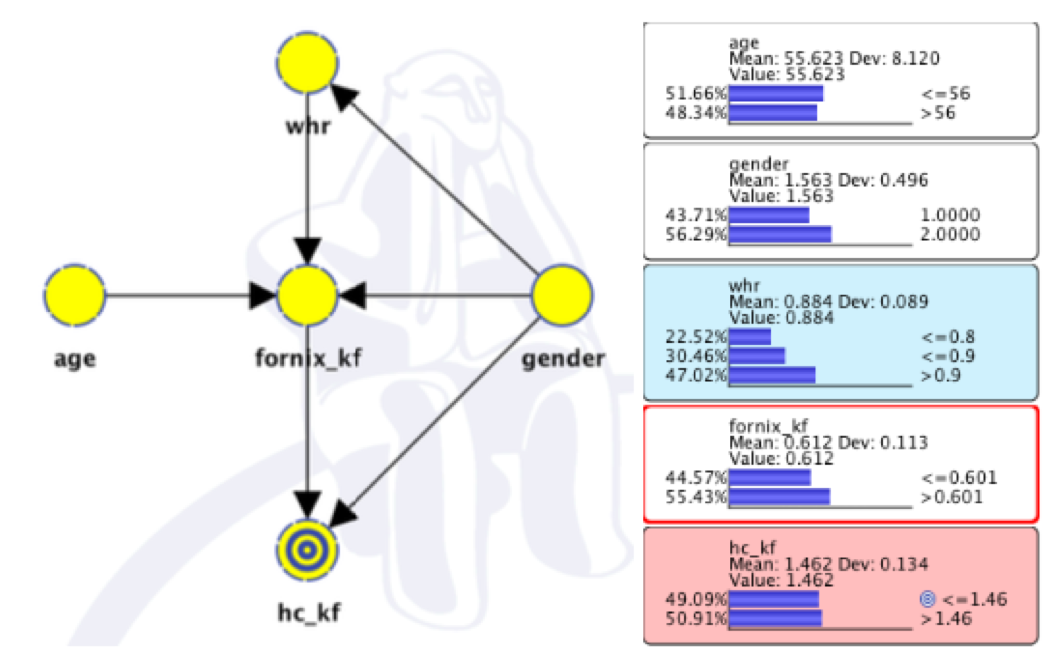
Our Causal Model DAG in BayesiaLab. Here gender is integrated in the DAG.
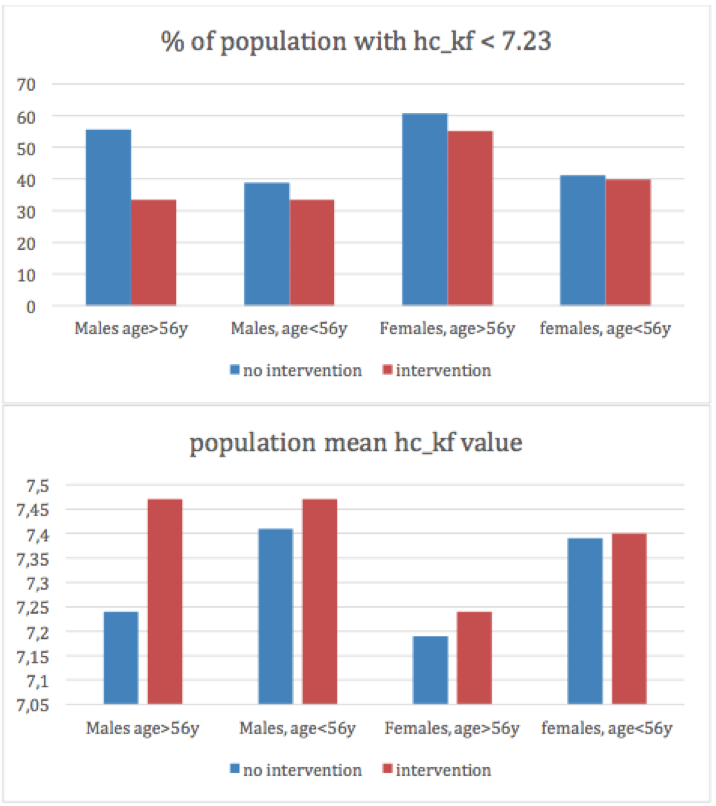
Effect of intervention on different subgroups. Intervention entails whr being forced below overweight thresholds, set 0.9, for males, and 0.8 for females