3169
Reference Regions for Computing Relative Cerebral Blood Flow in Mild Cognitive Impairment1Department of Radiology, University of Pennsylvania, Philadelphia, PA, United States, 2Department of Neurology, University of Pennsylvania, Philadelphia, PA, United States
Synopsis
Alzheimer’s disease (AD) is characterized by reduced cerebral blood flow (CBF) both globally and in AD specific regions, however there is considerable CBF variability even in healthy population. Relative CBF using mean CBF in AD-spared regions as reference removes this variability and can provide higher sensitivity and specificity for regional changes. We compared the effects of using different reference regions in discriminating patients with amnestic mild cognitive impairment (aMCI) and elderly controls using two different arterial spin labeling acquisitions. Putamen and primary motor cortex were most spared in the aMCI cohort and provided best patient-diagnosis when used as reference regions.
Introduction
Reductions in regional and global cerebral blood flow (CBF) using Arterial Spin Labeled (ASL) perfusion MRI are observed in the Alzheimer’s disease (AD) continuum,1,2 and are potential biomarkers for diagnosis, prediction, and monitoring. However, there are large variations in CBF, even in healthy subjects,3 and accurate absolute CBF quantification requires knowledge of the proton density (M0), blood T1, and labeling efficiency that are not always available. Relative CBF computed by normalizing to a reference region controls for individual differences in CBF and can reliably demonstrate regions with altered CBF, even in non-quantitative ASL data. However, the optimal reference region for normalization has not been identified. Reference regions may be best determined in a disease specific manner since they should be relatively spared by the disease process of interest. In AD, Fluorodeoxyglucose Positron Emission Tomography data are typically normalized to cerebellum or pons,4,5 but ASL-CBF in these regions are less reliable.6 Here we aimed to compare different reference regions to compute relative CBF in two cohorts of amnestic mild cognitive impairment (aMCI) compared to older adult controls with two different types of ASL acquisitions obtained with pseudo-continuous ASL (PCASL) and imaged with and without background suppression (BS).Methods
Two dimensional PCASL (2D-PCASL) data was acquired from 50 aMCI patients (age=73.0±7.0 years, 16 female) and 35 older adult controls (age=70.2±6.9 years, 20 female) recruited from the Penn Memory Center with a labeling time=1.5s and post labeling delay (PLD)=1.5s. 45 label/control pairs were acquired with a non-BS 2D echo planar imaging readout with in plane resolution=3.4x3.4mm2, slice thickness=6mm with a 20% distance factor. 3D-BS-PCASL was acquired from 40 aMCI patients (age=72.4±6.7years, 16 female) and 66 elderly controls (age=72.9±6.7years, 42 female) with labeling time=1.8s and, PLD=1.8s. 10 label/control pairs were obtained with a 4-shot spiral acquisition and isotropic voxel size=2.5mm3. The data was processed to obtain CBF maps.7,8 As candidates for reference region, we compared the performances of putamen, primary motor (M1) and visual (V1) cortices. Additionally, cortical grey matter (GM), which is expected to provide more reliable CBF, and cerebellum which is commonly used as a reference in FDG-PET were also included in the comparison, although cerebellum often has incomplete coverage in ASL acquisition. Our goal was to identify a reference region that provides no statistical difference between control and patients with absolute CBF, while maximizing their difference in AD-sensitive regions when used as reference to compute relative CBF. Effect sizes between the controls and aMCI groups were obtained in posterior cingulate cortex (PCC), precuneus and hippocampus, which were previously shown to demonstrate AD-hypoperfusion.1,9 We also used global CBF and cortical GM to obtain a measure of a global CBF reduction. For comparison, CBF using each of the reference regions, viz. cerebellum, putamen, M1 and V1 were used as control regions in the comparison. Effect sized were shown with 95% confidence interval and statistically significant group differences were obtained when the 95% interval do not include zero.Results
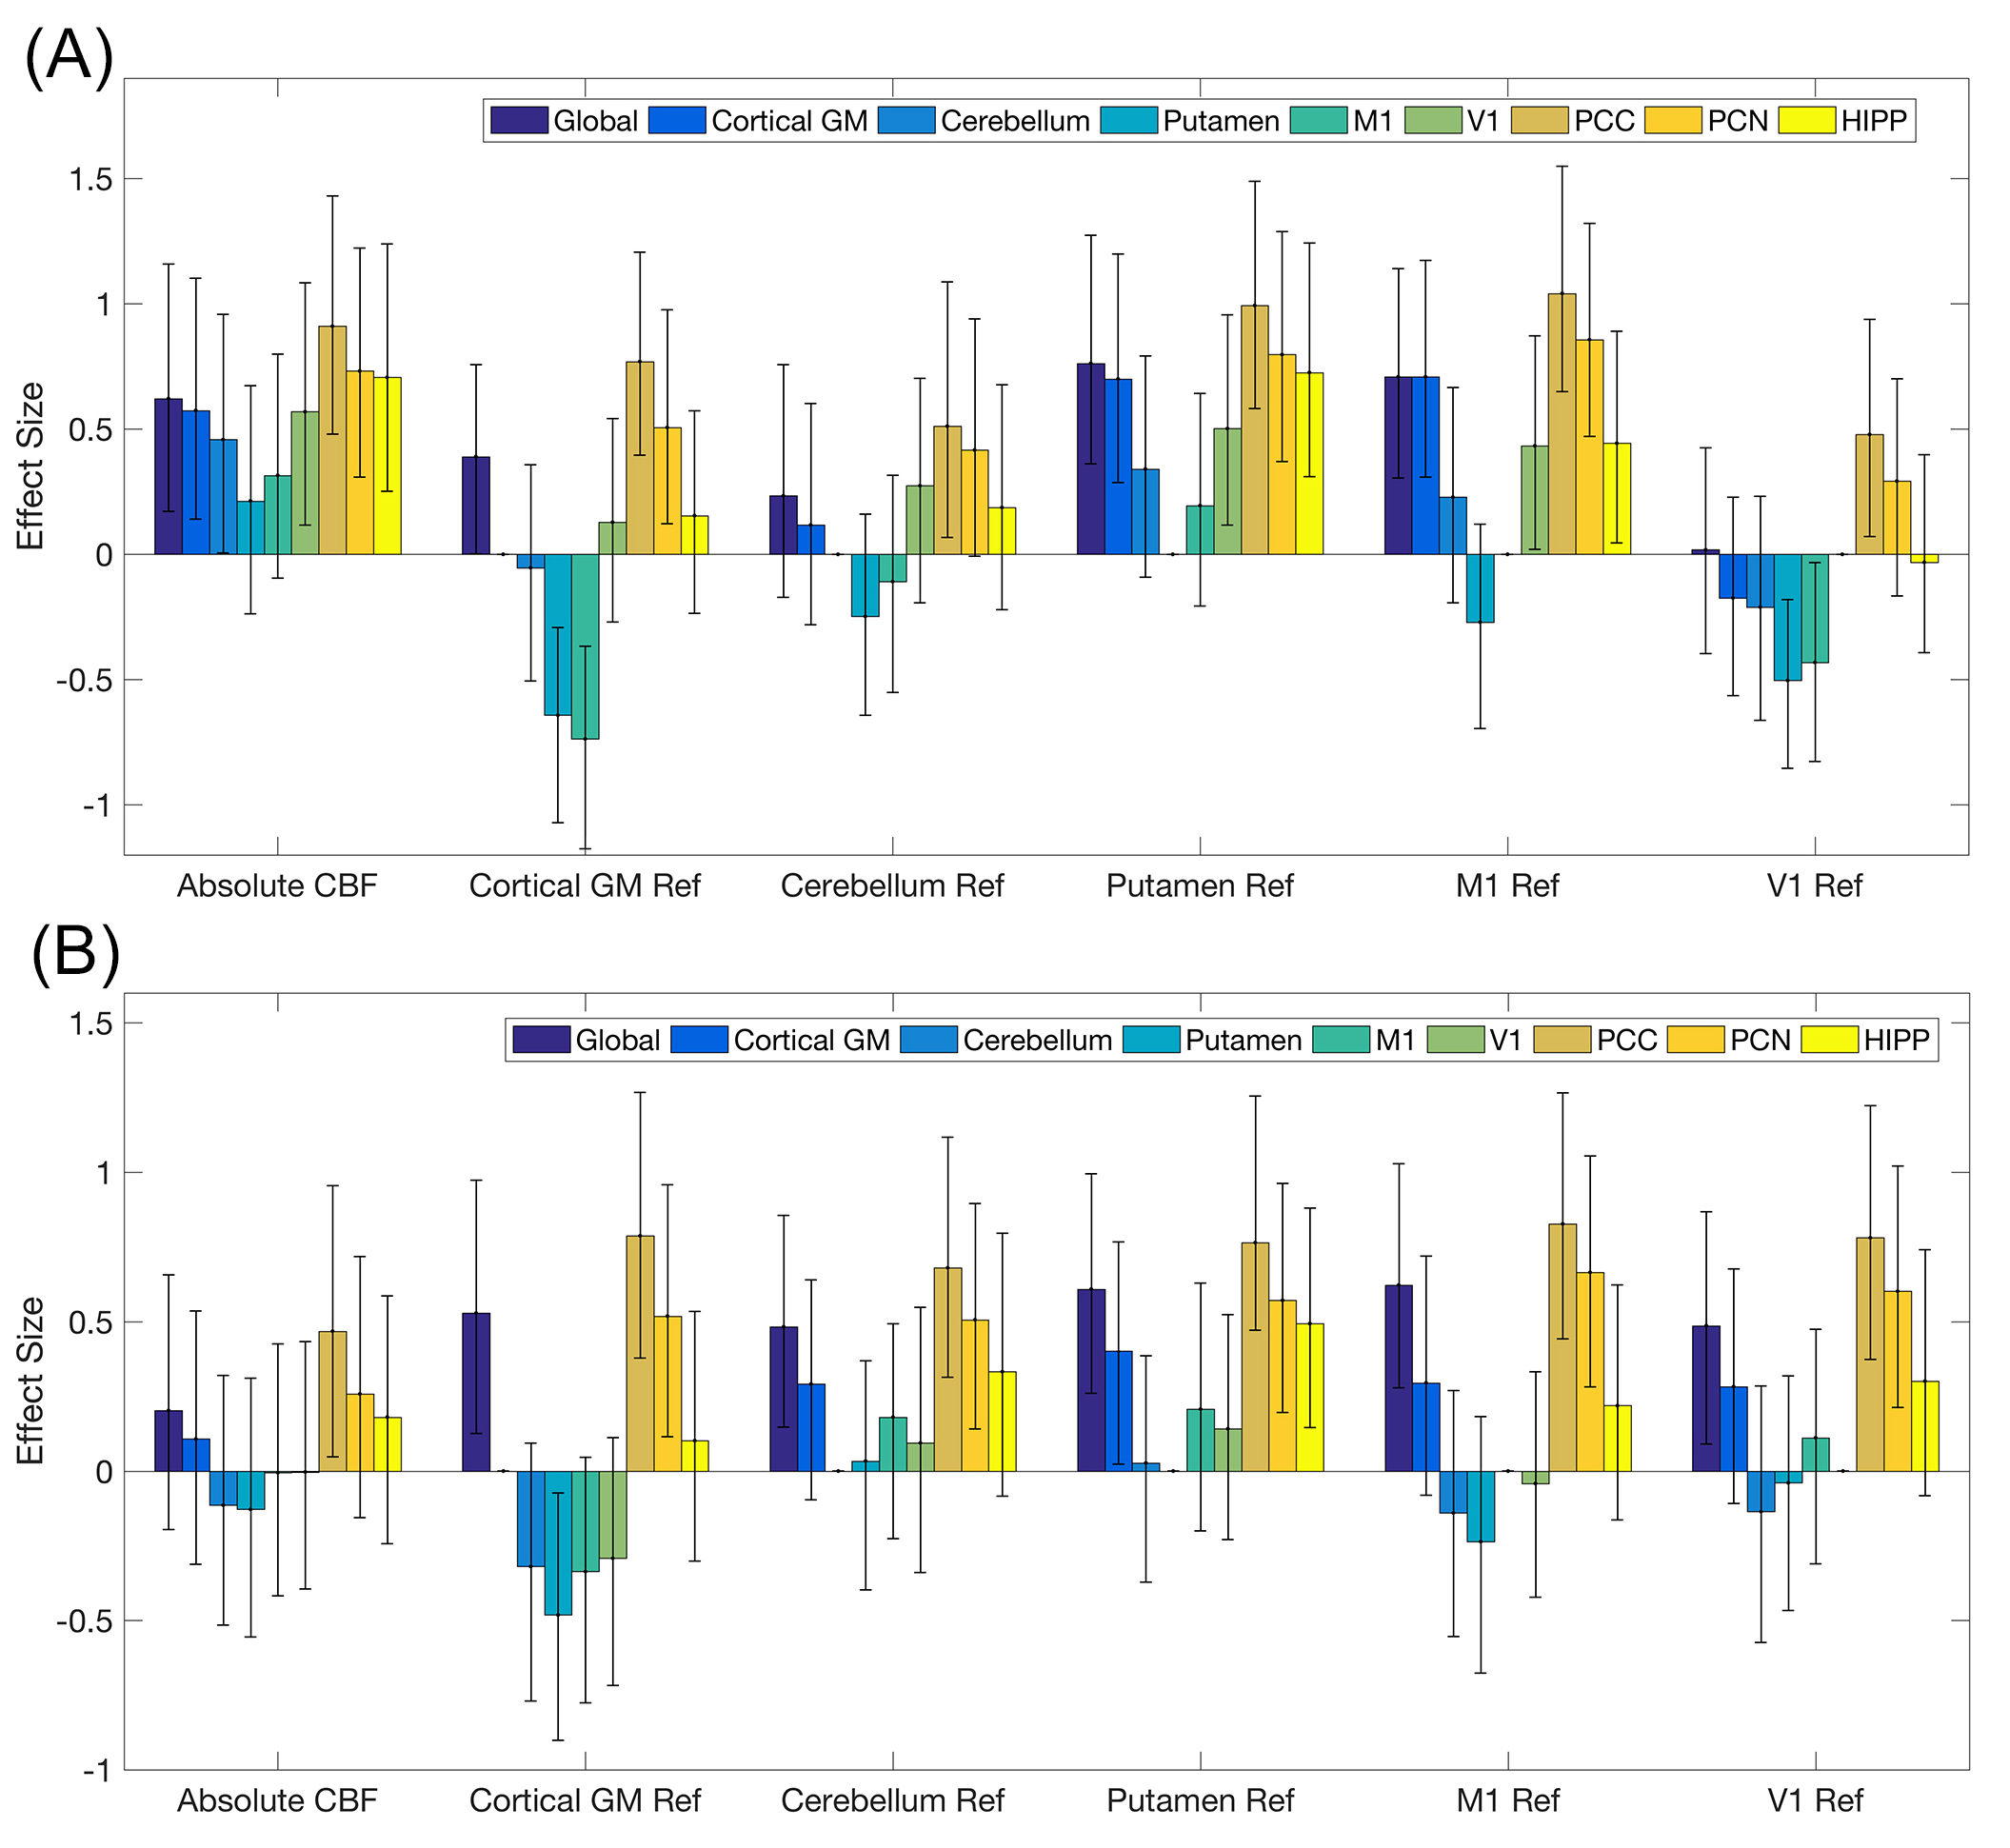
The top and bottom subplots of Figure 1 show the results for 2D-PCASL and 3D-BS-PCASL data respectively. Each image shows the effect sizes and the 95% confidence interval corresponding to absolute CBF, and normalizations with cortical GM, cerebellum, putamen, M1 and V1. With 2D PCASL, putamen and M1 did not demonstrate statistically significant group difference in absolute CBF while other regions including V1 and cerebellum differed between the groups. Absolute CBF with 3D-BS-PCASL did not differ between groups in any ROI except PCC. In both datasets, PCC showed the largest and most consistent group difference irrespective of use of absolute or relative CBF and choice of reference region. Precuneus also showed medium-to-large effect size with relative CBF although lower than PCC while hippocampus showed significant group difference with use of putamen reference in both the datasets and additionally M1 in 2D-PCASL. Use of cortical GM or cerebellar reference region showed lower effect sizes in AD-signature regions with small to significantly negative effect sizes in putamen and M1 further demonstrating that these regions are relatively spared compared to the whole brain CBF decline.Discussion and Conclusion
Putamen and M1 appear to be among the most spared regions in these aMCI cohorts and provided the highest group difference in AD specific regions when used as regions to normalize. PCC, followed by precuneus showed the highest sensitivity in discriminating aMCI subjects. Further evaluations with different datasets and more advanced stages of AD are required to establish putamen and M1 as regions of normalization in the AD continuum.Acknowledgements
This study was supported by NIH grants R01 MH080729, P41 EB015893, R01 AG040271, R01 AG010124 and R01 AG055005.References
1. Johnson NA, Jahng GH, Weiner MW, et al. Pattern of cerebral hypoperfusion in Alzheimer disease and mild cognitive impairment measured with arterial spin-labeling MR imaging: initial experience. Radiology 2005;234(3):851-859.
2. Chen Y, Wolk DA, Reddin JS, et al. Voxel-level comparison of arterial spin-labeled perfusion MRI and FDG-PET in Alzheimer disease. Neurology 2011;77(22):1977-1985.
3. Dolui S, Wang Z, Wang DJ, et al. Comparison of non-invasive MRI measurements of cerebral blood flow in a large multisite cohort. Journal of cerebral blood flow and metabolism : official journal of the International Society of Cerebral Blood Flow and Metabolism 2016;36(7):1244-1256.
4. Foster NL, Heidebrink JL, Clark CM, et al. FDG-PET improves accuracy in distinguishing frontotemporal dementia and Alzheimer's disease. Brain : a journal of neurology 2007;130(Pt 10):2616-2635.
5. Dukart J, Mueller K, Horstmann A, et al. Differential effects of global and cerebellar normalization on detection and differentiation of dementia in FDG-PET studies. NeuroImage 2010;49(2):1490-1495.
6. Vidorreta M, Zhao L, Shankar S, et al. In-Vivo Evaluation of PCASL Labeling Scheme and Position. Proceedings of the International Society of Magnetic Resonance in Medicine. Volume 3618. Honolulu, USA; 2017.
7. Dolui S, Wang Z, Shinohara RT, Wolk DA, Detre JA, Alzheimer's Disease Neuroimaging I. Structural Correlation-based Outlier Rejection (SCORE) algorithm for arterial spin labeling time series. Journal of magnetic resonance imaging : JMRI 2016;45(6):1786-1797.
8. Dolui S, Wolk DA, Detre JA. SCRUB: A Structural Correlation and Empirical Robust Bayesian Method for ASL Data. Proceedings of the International Society of Magnetic Resonance in Medicine. Singapore; 2016.
9. Dolui S, Vidorreta M, Wang Z, et al. Comparison of PASL, PCASL, and background-suppressed 3D PCASL in mild cognitive impairment. Hum Brain Mapp 2017.
Figures