3162
Spatial distribution of multiple sclerosis lesions along the brain and spinal motor tracts and correlation with functional deficits1NeuroPoly Lab, Institute of Biomedical Engineering, Polytechnique Montreal, Montreal, QC, Canada, 2Neurology, CHU de Rennes, Rennes, France, 3Radiology, CHU de Rennes, Rennes, France, 4Univ Rennes, Inria, CNRS, Inserm, IRISA UMR 6074, Visages U1128, Rennes, France, 5CHU Montpellier, Montpellier, France, 6McConnell Brain Imaging Center, Montreal neurological institute, Montreal, QC, Canada, 7Xuanwu Hospital, Beijing, China, 8Karolinska Institutet, Stockholm, Sweden, 9Zuckerberg San Francisco General Hospital, University of California, San Francisco, CA, United States, 10National Institute of Radiological Sciences, Chiba, Japan, 11Juntendo University Hospital, Tokyo, Japan, 12Hopital Cochin, Paris, France, 13National Institute of Neurological Disorders and Stroke, National Institutes of Health, Bethesda, MD, United States, 14Neuroimaging Research Unit, INSPE, Division of Neuroscience, San Raffaele Scientific Institute, Vita-Salute San Raffaele University, Milan, Italy, 15Brigham and Women's Hospital, Harvard Medical School, Boston, MA, United States, 16Functional Neuroimaging Unit, CRIUGM, University of Montreal, Montreal, QC, Canada
Synopsis
We describe the spatial distribution of multiple sclerosis (MS) lesions in the corticospinal tracts (CST), from the cortex to the lower cervical cord, using an open-source automated pipeline. We confirm the high frequency of CST focal damage in MS patients from the first year of relapsing-remitting MS and identify areas of predilection for MS lesions along the CST in the cervical spinal cord. At baseline, no significant correlation was observed between brain or spinal cord CST lesion volume fraction and physical disability scores. However, the baseline spinal cord CST lesion volume fraction correlated with the EDSS at 2 years.
Introduction
The clinicoradiologic paradox, or the weak relationship between radiological findings and clinical consequences, is a still unsolved issue in multiple sclerosis (MS) 1. One contributor might be that most studies have either focused on the brain or on the spinal cord, whereas functional deficit is likely caused by a cumulative damage within a specific tract entity. In particular, the motor tracts hold important prognostic value in both brain 2 and spinal regions 3,4. Thus, the aims of this study were to (1) describe the spatial distribution of MS lesions along the CST tracts from the brain to the cervical cord and (2) study the link between CST lesions and disability at baseline and 2 years.Methods
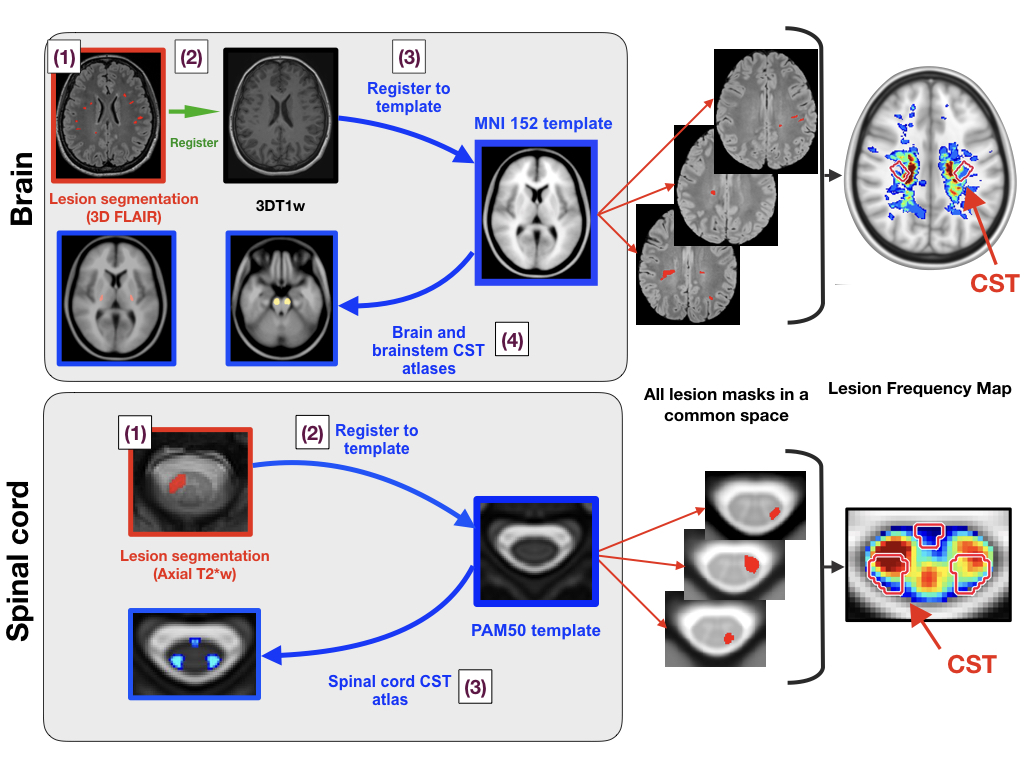
Forty-two early relapsing-remitting MS (RRMS) patients (disease duration <18 months) from two centers were included. Imaging was performed using 3T scanners. Sequences included: 3D FLAIR, axial PDw and T2w (for brain lesion identification), 3D T1w (for brain CST identification) and axial T2*w and sagittal T2w (for cord lesion identification). The processing pipeline is summarized in Figure 1 and is based on the Spinal Cord Toolbox 5 for spinal cord processing and Anima 6,7 for brain processing. Focal lesions were manually segmented, while brain lesions were automatically segmented 8 and manually corrected. The CST was identified after registering brain and brainstem atlases 9,10 to the FLAIR brain data and spinal cord atlas 11 to the cord axial T2*w data. For the brain, the CST descending from the primary motor cortex (M1-CST), and the CST including projections from both M1 and the premotor areas (brain-CST), were considered. For the spinal cord, both the lateral and ventral CST were considered. For a given region of interest (ROI), the lesion volume fraction was computed by dividing the lesion volume in this ROI by its total volume. The explored ROIs were the M1-CST, brain-CST, brainstem-CST and spinal cord-CST, as well as the combination of the last three (whole-CST). Lesion frequency maps were computed from the cortex to the lower cervical cord. Finally, associations between lesion volume fraction in the CST at baseline and clinical scores at baseline and 2 years were assessed.Results
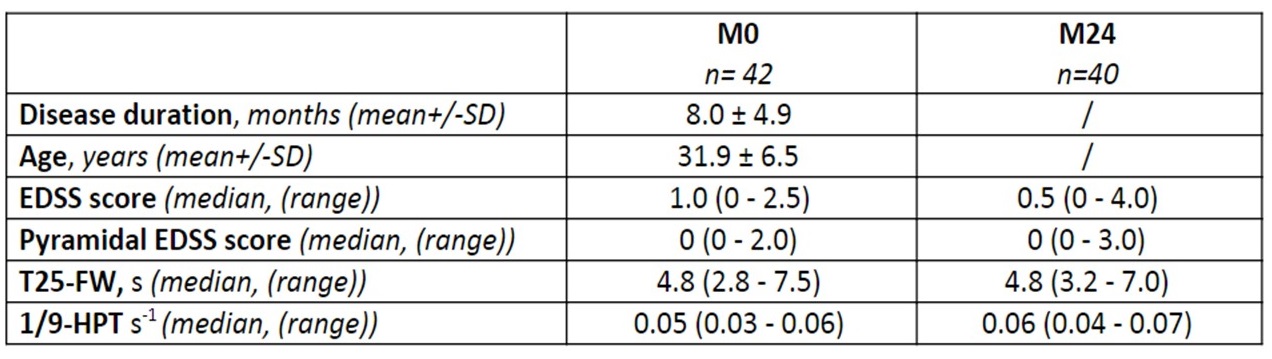
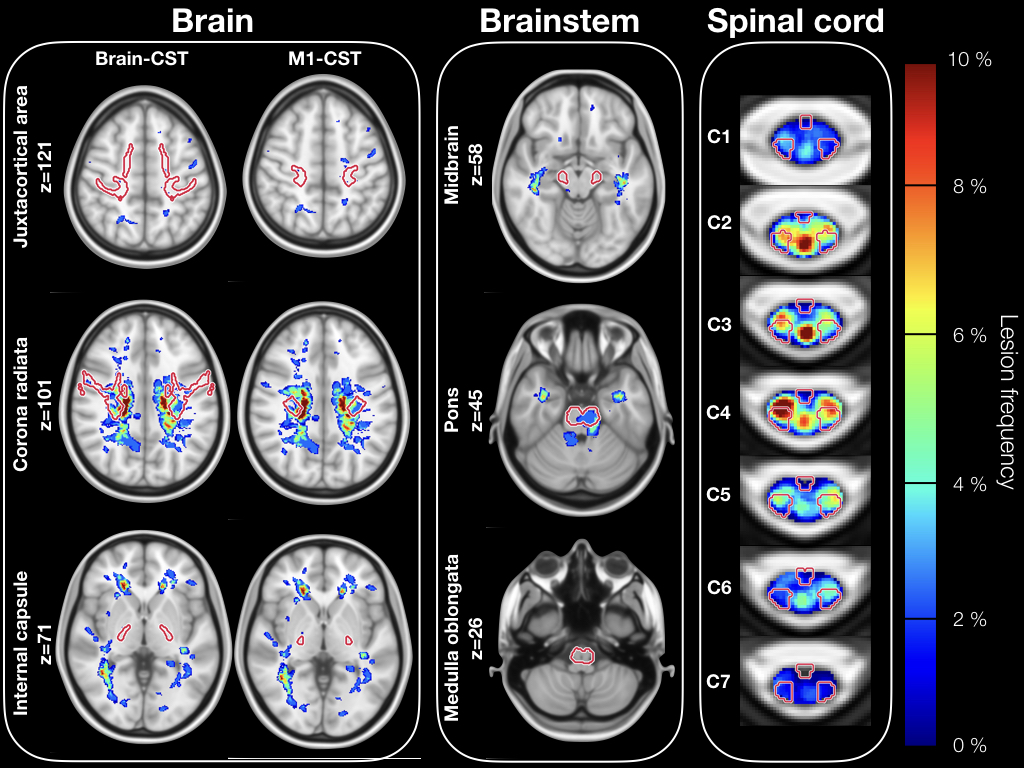
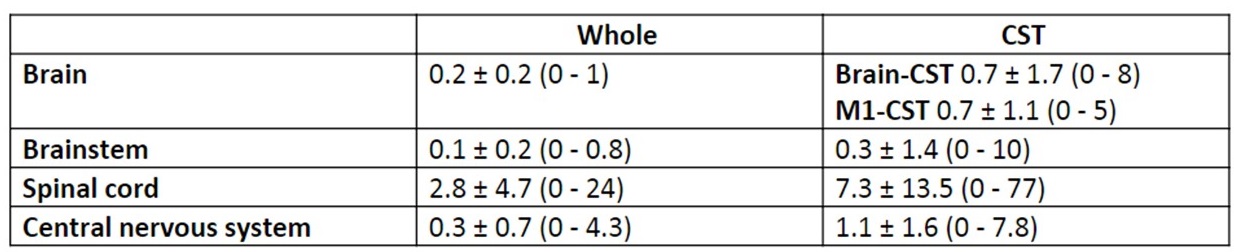
The clinical characteristics of the population are summarized in Table 1. Forty out of 42 patients had at least one lesion in their CST. Lesions were not homogeneously distributed along the CST, and were predominately found in the corona radiata for the brain, the pons for the brainstem, and C3-C4 for the spinal cord, as illustrated in Figure 2. Overall, the CST focal damage was more pronounced in the spinal cord compared to the brain or the brainstem (detailed results in Table 2). Lesion volume fractions in the whole spinal cord and in the spinal cord CST were highly correlated (r=0.96, p<0.0001). We observed a less pronounced correlation in the brain (r=0.46, p<0.003). By contrast, we did not observe evidence of correlation between the lesion volume fraction in the spinal cord and in the brain CST. No significant correlation was observed between CST lesion volume fraction in the brain and the spinal cord and disability scores at baseline. The baseline spinal cord CST lesion volume fraction was, however, correlated with the EDSS and pyramidal EDSS at 2-year follow-up (r=0.53, p=0.0005 and r=0.63, p<0.0001, respectively). No significant correlation was observed with baseline brain CST lesion volume fraction.Discussion
Our results confirmed the high frequency of CST focal damage in MS patients 2. We also identified an area of predilection for MS lesions in the spinal cord portion of the CST. No significant correlation was found between lesion fraction in the CST and disability at baseline. This was expected as the range of disability was low in our recently diagnosed RRMS population. By contrast, we highlighted the potential prognostic value of early spinal cord CST focal damage on subsequent physical disability. However, the evaluation of the spinal cord was only limited to the cervical cord. Another limitation is that the CST delineation is only an approximation, even when using dedicated atlases and an automated pipeline.Conclusion
Our study illustrates the feasibility of an analysis of the MS lesions in the CST, taking into account its brain and cervical spinal cord portions. We provide a description of lesion location and frequency in early RRMS patients. Ongoing work includes a large cohort of patients with various MS phenotype, disease duration, and disability.Acknowledgements
The MRI acquisitions were funded by the French Hospital Programme of Clinical Research (PHRC).
Charley Gros was funded by IVADO (EX-2018-4).
References
1. Healy BC, Buckle GJ, Ali EN, Egorova S, Khalid F, Tauhid S, et al. Characterizing Clinical and MRI Dissociation in Patients with Multiple Sclerosis. J. Neuroimaging 2017; 27: 481–485.
2. Daams M, Steenwijk MD, Wattjes MP, Geurts JJG, Uitdehaag BMJ, Tewarie PK, et al. Unraveling the neuroimaging predictors for motor dysfunction in long-standing multiple sclerosis. Neurology 2015; 85: 248–255.
3. Zackowski KM, Smith SA, Reich DS, Gordon-Lipkin E, Chodkowski BA, Sambandan DR, et al. Sensorimotor dysfunction in multiple sclerosis and column-specific magnetization transfer-imaging abnormalities in the spinal cord. Brain 2009; 132: 1200–1209.
4. Eden D, Gros C, Badji A, Dupont S, Maranzano J, Zhuoquiong R, et al. Spatial Distribution of Multiple Sclerosis lesions in the Cervical Cord. In: Proceedings of the 26th Annual Meeting of ISMRM. 2018.
5. De Leener B, Lévy S, Dupont SM, Fonov VS, Stikov N, Louis Collins D, et al. SCT: Spinal Cord Toolbox, an open-source software for processing spinal cord MRI data. Neuroimage 2017; 145: 24–43.
6. Commowick O, Wiest-Daessle N, Prima S. Block-matching strategies for rigid registration of multimodal medical images. In: 2012 9th IEEE International Symposium on Biomedical Imaging (ISBI). 2012. Available from: http://dx.doi.org/10.1109/isbi.2012.6235644
7. Suarez RO, Commowick O, Prabhu SP, Warfield SK. Automated delineation of white matter fiber tracts with a multiple region-of-interest approach. Neuroimage 2012; 59: 3690–3700.
8. Galassi F, Commowick O, Barillot C. Integration of Probabilistic Atlas and Graph Cuts for Automated Segmentation of Multiple Sclerosis lesions. In: Proceedings of the 26th Annual Meeting of ISMRM. 2018.
9. Archer DB, Vaillancourt DE, Coombes SA. A Template and Probabilistic Atlas of the Human Sensorimotor Tracts using Diffusion MRI. Cereb. Cortex 2018; 28: 1685–1699.
10. Tang Y, Sun W, Toga AW, Ringman JM, Shi Y. A probabilistic atlas of human brainstem pathways based on connectome imaging data. Neuroimage 2018; 169: 227–239.
11. Lévy S, Benhamou M, Naaman C, Rainville P, Callot V, Cohen-Adad J. White matter atlas of the human spinal cord with estimation of partial volume effect. Neuroimage 2015; 119: 262–271.
Figures