3161
White Matter Tract-Defined Lesion Loads in Relapsing-Remitting Multiple Sclerosis1Radiology & Clinical Neuroscience, University of Calgary, Calgary, AB, Canada, 2Healthy Brain Aging Lab, University of Calgary, Calgary, AB, Canada
Synopsis
Lesions in multiple sclerosis (MS) present at various locations throughout the brain. 207 relapsing-remitting MS (RRMS) patients were scanned at 3T. T2w and T1w images were used to segment white matter (WM) hyper- and hypo-intensities, respectively. Using an atlas of WM tracts, the lesion burden was computed for each tract. The dominant lesion load was found in the periventricular regions. The tract percent load is highest in the anterior thalamic radiation, inferior fronto-occipital fasciculus, the forceps major, and forceps minor tracts. The uncinate fasciculus, superior longitudinal fasciculus, and the four cingulum tracts have the lowest lesion loads.
Introduction
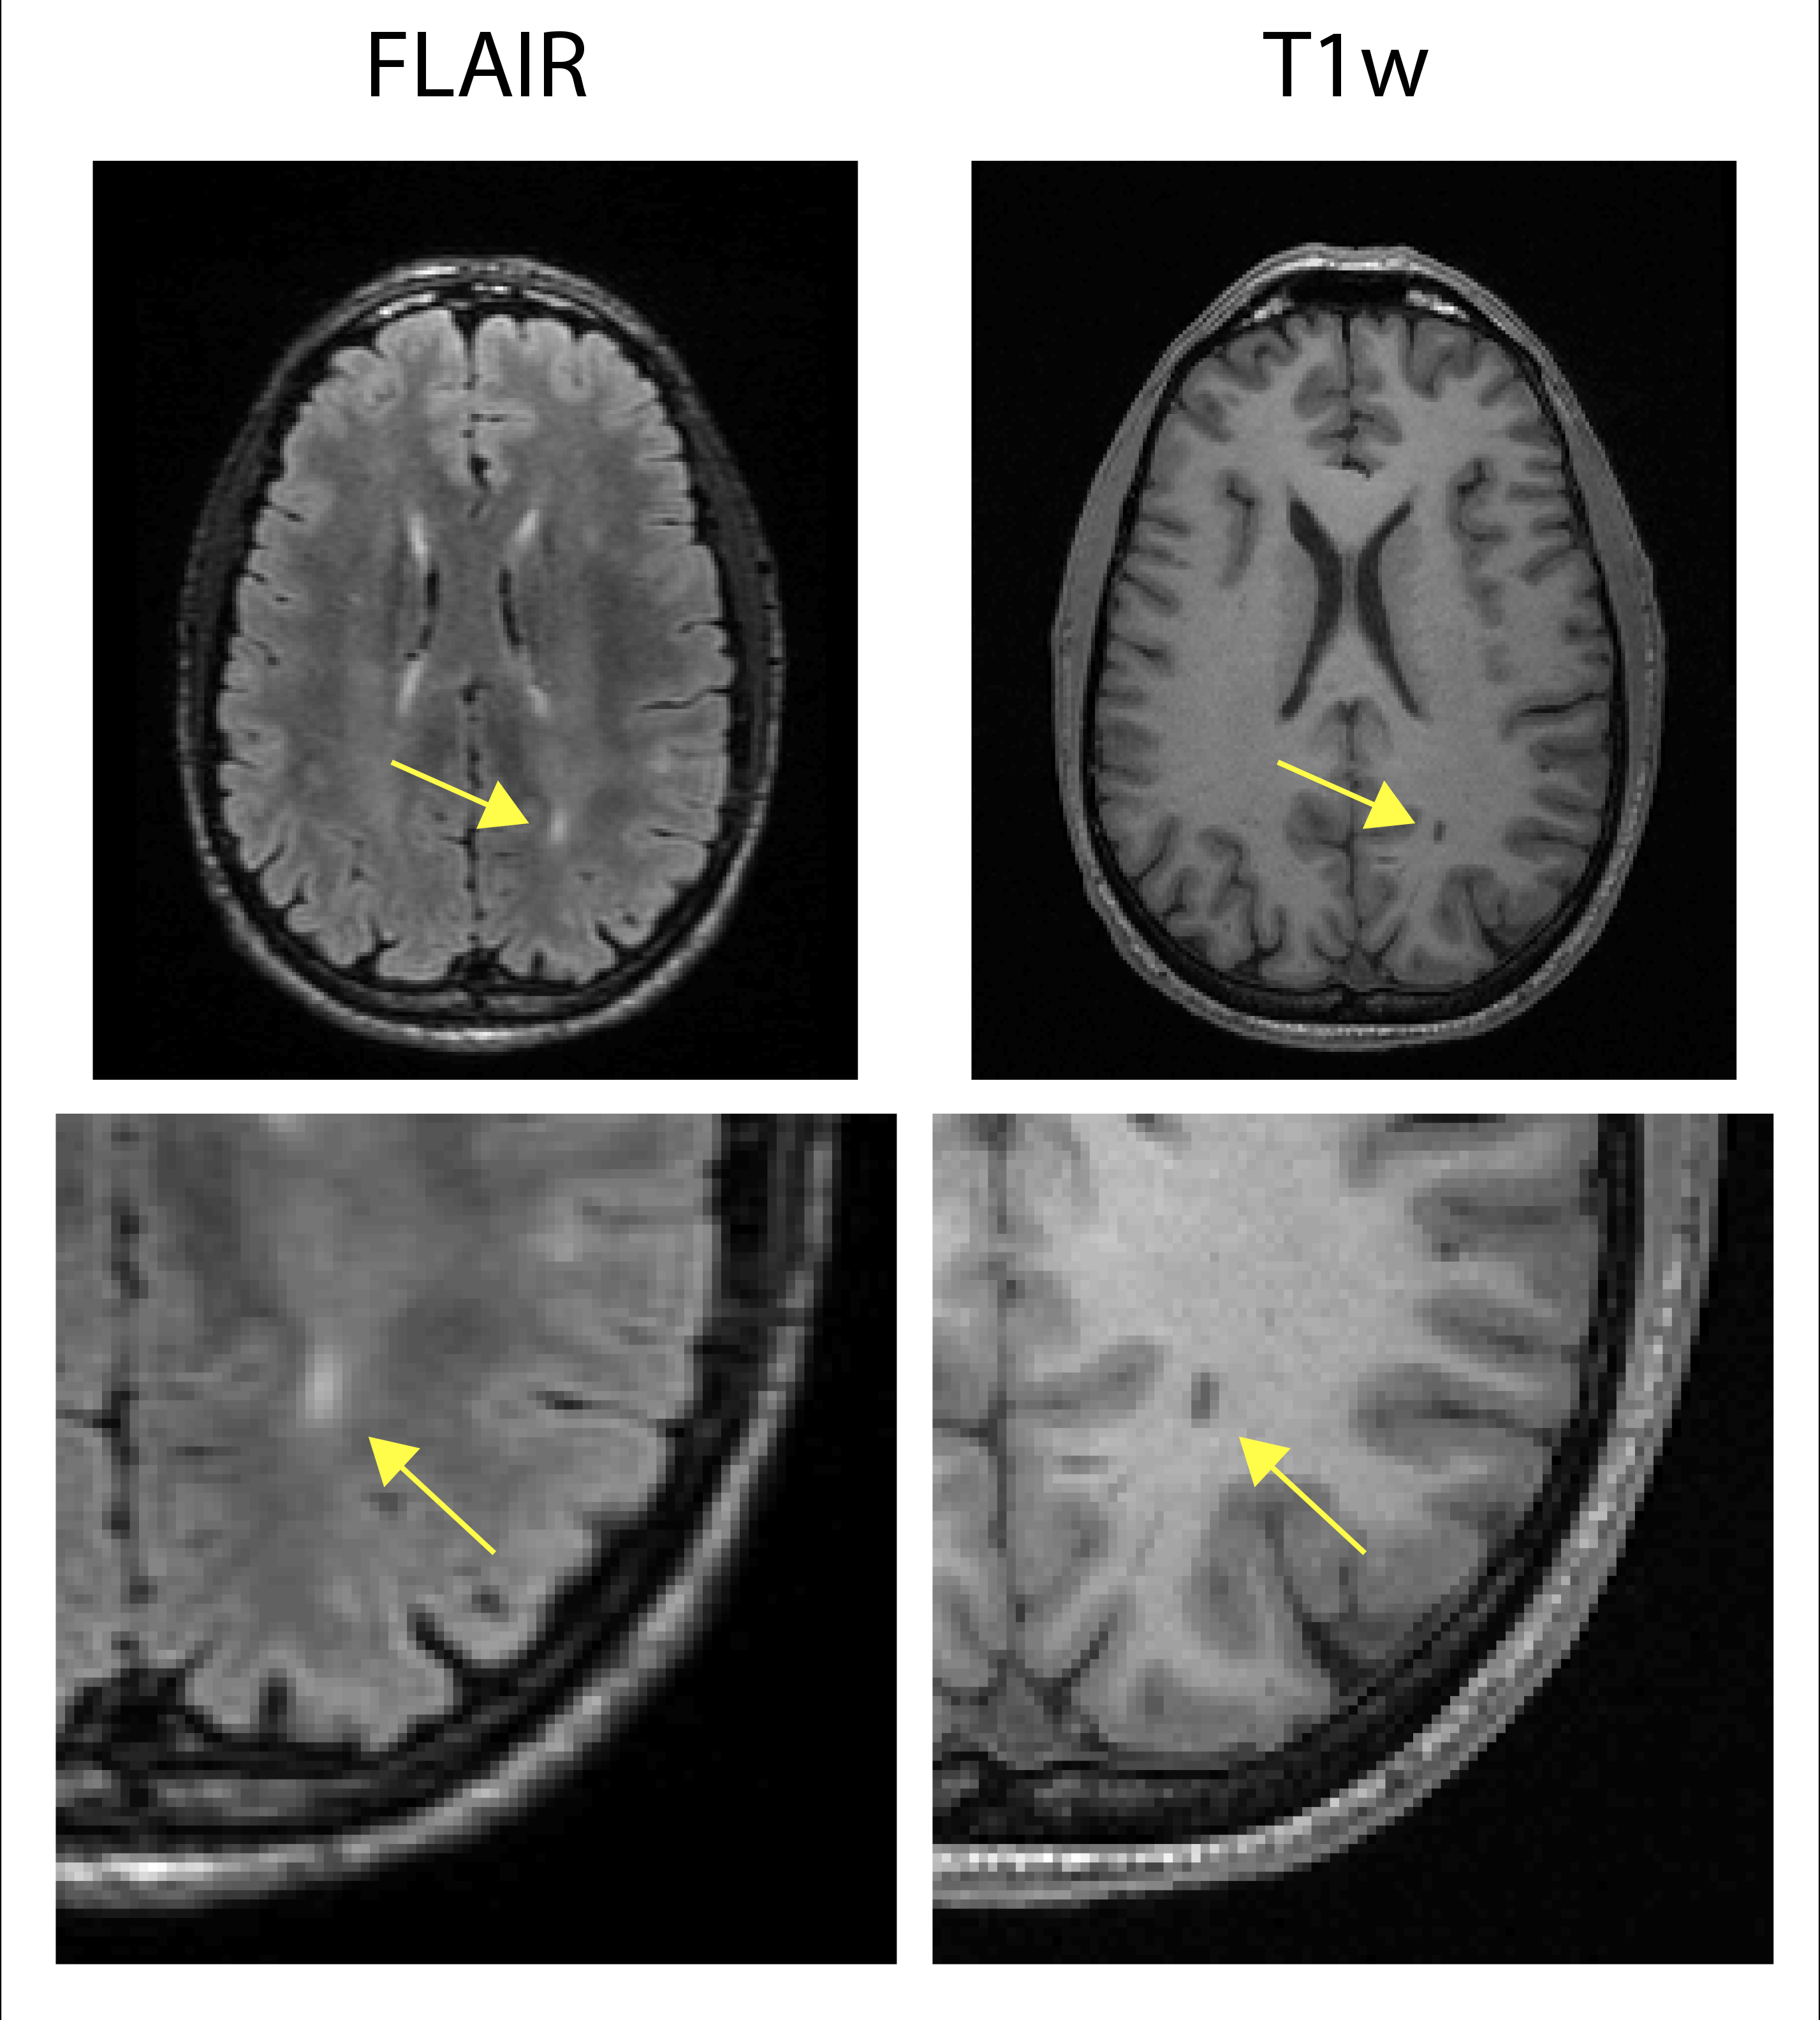
MS an immune-mediated degenerative disease affecting the central nervous system and is characterized by inflammatory and demyelinating white matter lesions visible on MRI using T2-weighted fluid attenuated inversion recovery imaging (FLAIR) images and T1-weighted (T1w) images [1,2]. Lesions appear hyper-intense on FLAIR with a subset of these appearing hypo-intense on T1w images. Lesion probability maps have been computed in the past to characterize how these lesions are distributed [3,4]. The current study extends these findings by computing the lesion burden on a tract-by-tract basis. To this end, the variation of lesion count, total lesion volume, and percent lesion volume across tracts is determined.Methods
207 relapsing remitting MS (RRMS) patients undergoing approved disease modifying therapy (155-F, mean age 44,ranging 23 to 60, mean EDSS mean and standard deviation or 2.218±41.4603, ranging 0.0 to 6.5) were scanned in a 3T MR scanner (GE Discovery 750). FLAIR and T1w images were acquired. The FLAIR (acquisition matrix 224x224x100 and a FOV of 240x240x180 mm3, TI/TR/TE/α of 2062 ms/7000 ms/129.4 ms/90°, echo train length of 160 and acceleration factor of 2x2) was obtained in 4:50, while the T1w (acquisition matrix 256x256x192, isotropic resolution 1 mm3, TI/TR/TE/α 650 ms/6.66 ms/2.93 ms/10°, acceleration factor of 2) had an imaging time of 4:31. FLAIR and T1w lesion segmentations were obtained with the lesion prediction algorithm in LST toolbox version of SPM [5]and FreeSurfer [6], respectively, with visual review of all data.
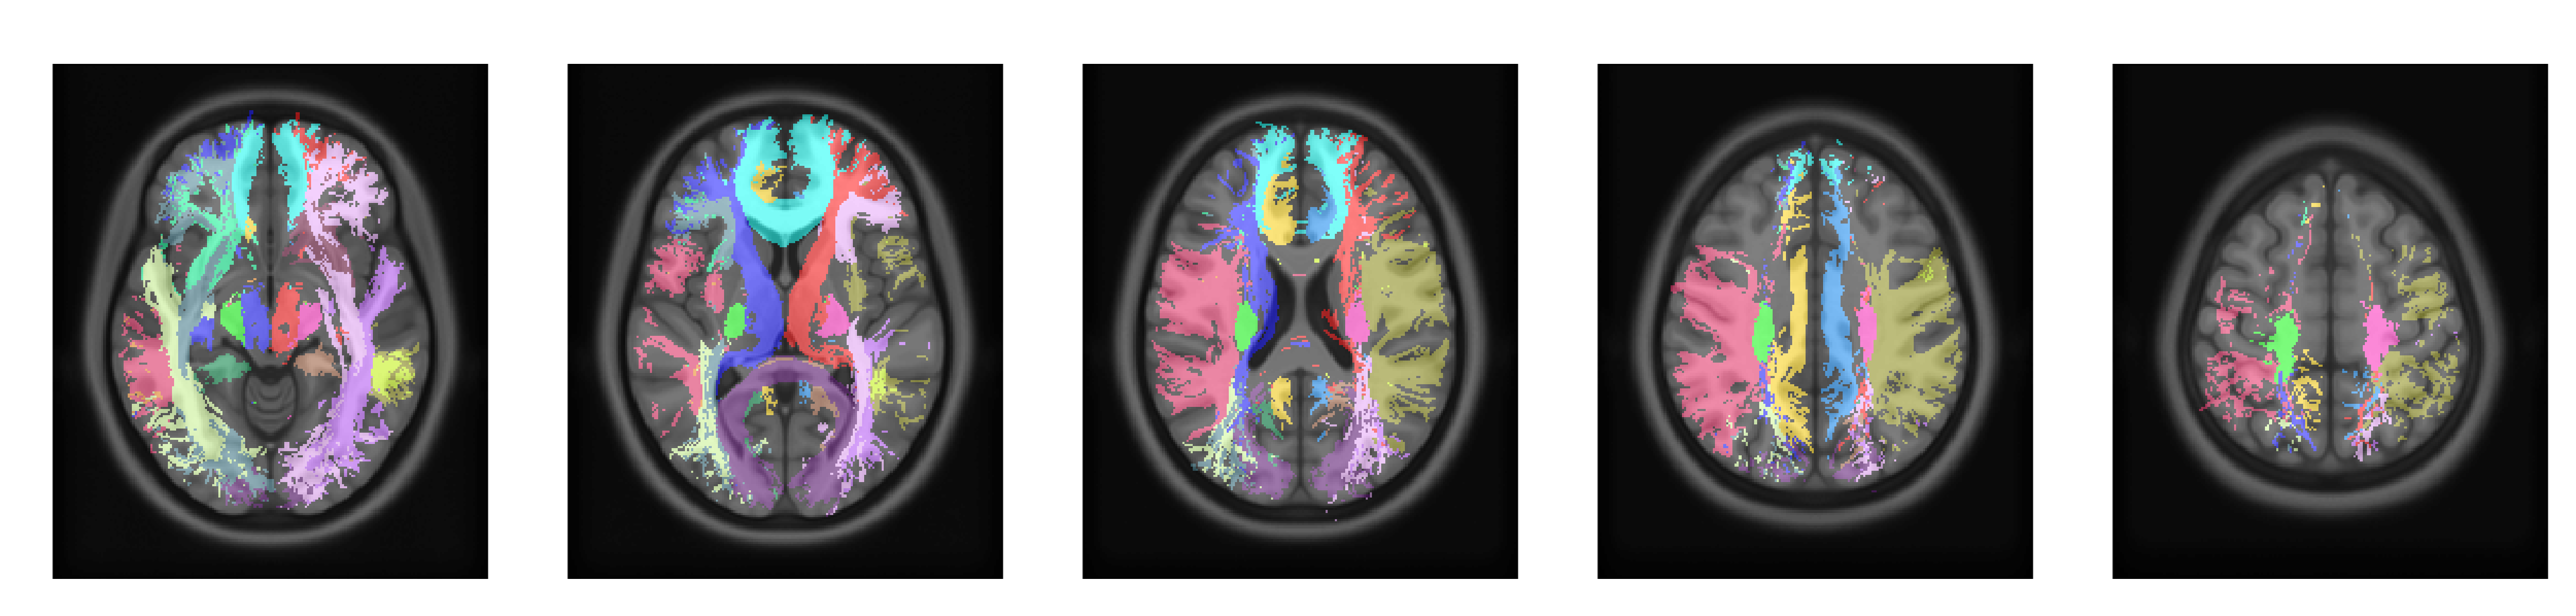
FLAIR images were registered to the T1w images using a rigid transformation. Examples of lesion visibility are seen in Figure 1. T1 images were then registered to the International Consortium of Brain Mapping (ICBM) atlas [7] and John Hopkins University DTI (JHUDTI) atlases [8] using a non-linear transform with Advanced Normalization Tools [9]. Figure 2 shows five slices of the JHUDTI atlas tracts. Quality assurance was performed by visually inspecting and manually correcting the SPM generated lesion masks, the FreeSurfer outputs, and all registrations.
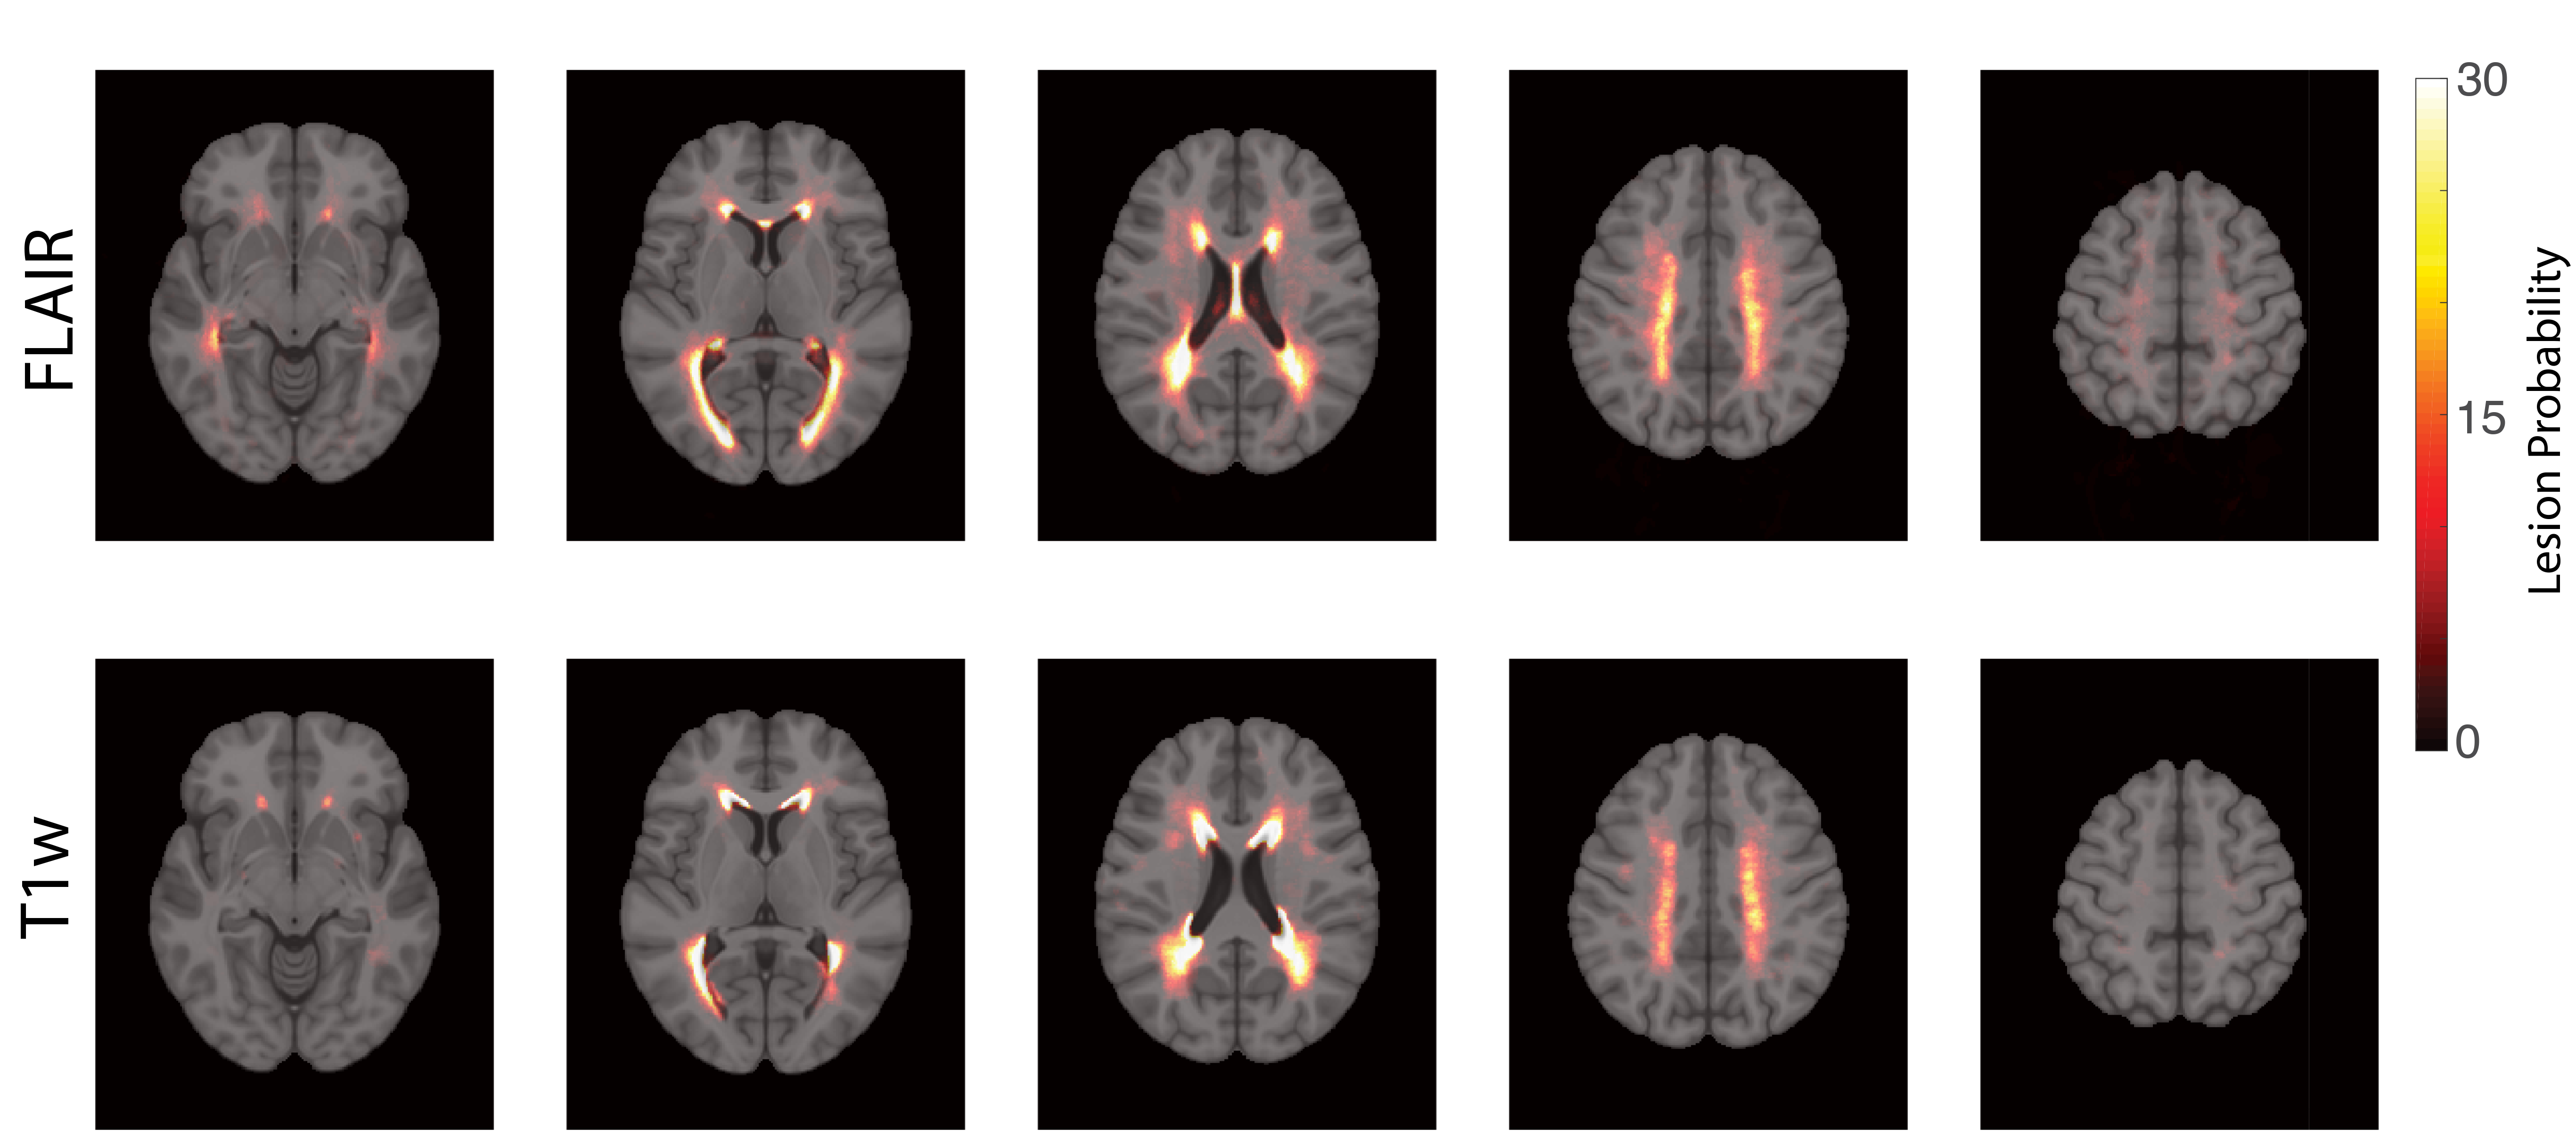
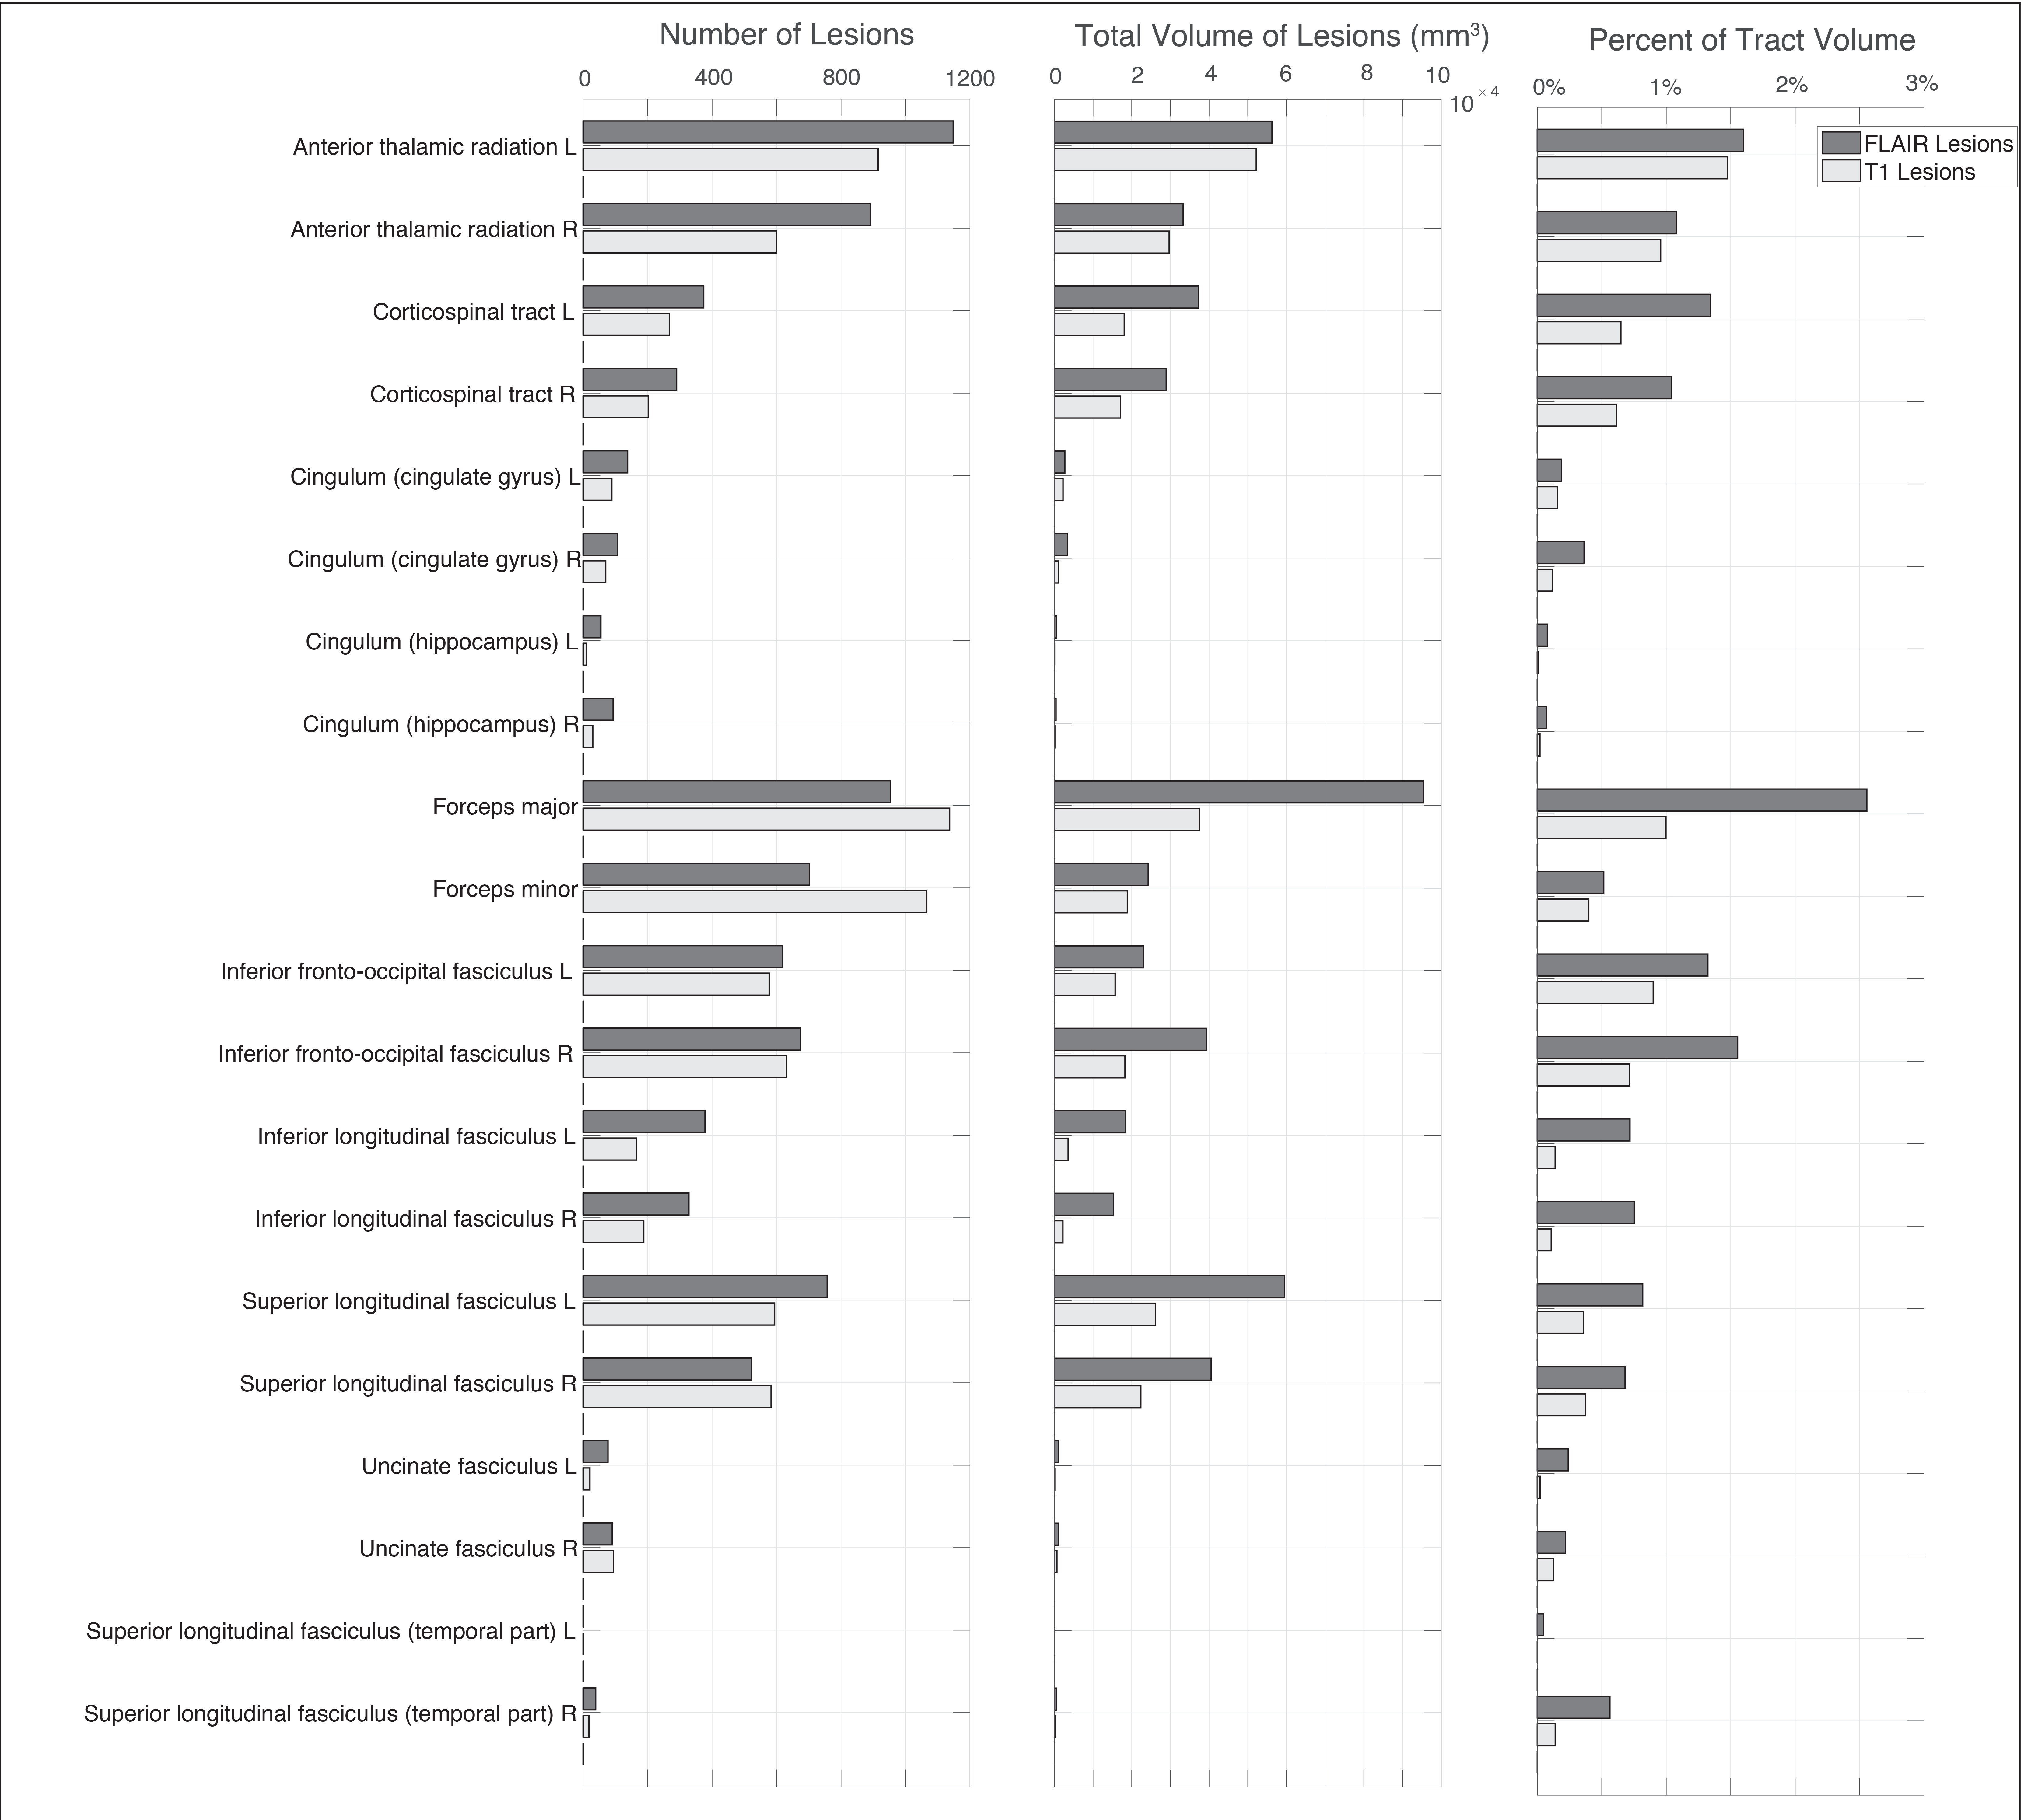
Lesion probability maps for both FLAIR and T1w lesions were calculated to determine the regional distribution of lesions, and to determine if the distributions were consistent with previous findings. Then lesion counts, total lesion volume, and percent of tract volume, were calculated for each WM tract of the JHUDTI atlas.
Results
Figure 3 illustrates several slices of the probability map for each lesion type. This figure demonstrates the spatial similarity of the probabilistic lesion location between FLAIR and T1w images. The highest probability of lesions is in the periventricular region. The lesion load is generally symmetric between the left and right hemispheres.
Figure 4 shows the total number of discrete lesions in each of the tracts across all the subjects. From this chart, it is clear the highest number of lesions, the greatest lesion volume, and the highest percent of lesioned tract, involve the anterior thalamic radiation, the forceps major, inferior fronto-occipital fasciculus, and the superior longitudinal fasciculus, much of which traverse the periventricular region. Furthermore, while the lesion count and total lesion volumes were smaller for the corticospinal, inferior longitudinal, cingulum, uncinate fasciculus, and superior longitudinal fasciculus tracts, the percent volume is higher proportionally for these tracts relative to those within the periventricular region.
Discussion
This work demonstrates new findings by determining the FLAIR and T1w lesion burden on a tract-specific basis in MS patients, whereas previous studies have only produced the probability maps of the lesions.
FLAIR and T1w lesions have similar spatial distributions. Importantly, higher lesion counts sometimes existed on the T1w images (i.e., forceps), whereas on FLAIR the lesions merged. In general, the T1w lesions were smaller than those found on FLAIR, however, the acquisition resolutions were different and thus it is inappropriate to compare.
Future work will include determining whether subjects with lesions in specific tracts have impairments associated with the functions of those tracts [10]. It will also include assessing other MRI-based lesion measurements available in these patients, including: magnetization transfer ratio, quantitative susceptibility mapping, fractional anisotropy and mean diffusivity to determine if they vary between tracts, and vary as a function of lesion burden within the tract.
Conclusion
This work confirms the predominance of MS lesion in the periventricular region but also provides a distribution within specific WM tracts. There are relatively higher lesion loads in the anterior thalamic radiation, corticospinal, the forceps major, forceps minor, Inferior fronto-occipital fasciculus, and the superior longitudinal fasciculus, while the uncinate fasciculus, superior longitudinal fasciculus, and the cingulum tracts have the lowest lesion burden.Acknowledgements
This work was supported by grants from Alberta Innovates Health Solutions (AIHS); Canadian Institutes of Health Research (CIHR) (FDN-143290); Campus Alberta Innovates Program (CAIP).References
1. Filippi, M. and M.A. Rocca, MR Imaging of Multiple Sclerosis. Radiology, 2011. 259(3): p. 659-681.
2. Louapre, C., Conventional and advanced MRI in multiple sclerosis. Rev Neurol (Paris), 2018. 174(6): p. 391-397.
3. Altermatt, A., et al., Clinical Correlations of Brain Lesion Location in Multiple Sclerosis: Voxel-Based Analysis of a Large Clinical Trial Dataset. Brain Topography, 2018(31).
4. Kincses, Z., et al., Lesion probability mapping to explain clinical deficits and cognitive performance in multiple sclerosis. Multiple Sclerosis Journal, 2011. 17(6): p. 681-689.
5. Schmidt, P., et al., An automated tool for detection of FLAIR-hyperintense white-matter lesions in Multiple Sclerosis. NeuroImage, 2012. 59(4): p. 3774-3783.
6. FreeSurfer v6.0.0. 2018.
7. Mazziotta, J., et al., A probabilistic atlas and reference system for the human brain: International Consortium for Brain Mapping (ICBM).Philosophical Transactions of the Royal Society of London. Series B: Biological Sciences, 2001. 356(1412): p. 1293-1322.
8. Hua, K., et al., Tract probability maps in stereotaxic spaces: Analyses of white matter anatomy and tract-specific quantification. NeuroImage, 2008. 39(1): p. 336-347.
9. Advanced Normalization Tools v2.1. 2018.
10. Roosendaal, S.D., et al., Regional DTI differences in multiple sclerosis patients. NeuroImage, 2009. 44(4): p. 1397-1403.
Figures