3160
Transient enlargement of brain ventricles during Multiple Sclerosis and Experimental Autoimmune Encephalomyelitis1Berlin Ultrahigh Field Facility, Max Delbrück Center for Molecular Medicine, Berlin, Germany, 2Institute for Vegetative Anatomy, Charité - Universitätsmedizin Berlin, Berlin, Germany, 3NeuroCure Clinical Research Center, Charité - Universitätsmedizin Berlin, Berlin, Germany, 4Experimental and Clinical Research Center, Charité - Universitätsmedizin Berlin, Berlin, Germany, 5Institute for Medical Immunology, Charité - Universitätsmedizin Berlin, Berlin, Germany
Synopsis
Brain ventricle volumes (VV) increased sharply during initial disease in the experimental autoimmune encephalomyelitis model of multiple sclerosis (MS), normalizing upon clinical remission. A cohort of MS patients with 13 monthly MRI scans over one year showed significantly greater VV volatility than healthy controls. Most patients showed VV contractions greater than the ±6% range of variation in healthy controls, and these patients had significantly lower disease severity compared to non-contracting patients. For some patients, the time series of changes in VV showed significant cross-correlations with other MRI and clinical parameters, suggesting that VV variations reflected disease processes related to inflammation.
Introduction
Inflammatory processes tend to predominate during the relapsing-remitting phase of multiple sclerosis (MS). Neurodegeneration on the other hand dominates the progressive phase and is accompanied by brain atrophy with resulting enlargement of the cerebral ventricles1. We previously reported an increase in brain ventricle volume (VV) in the animal model of MS, experimental autoimmune encephalomyelitis (EAE)2, before the emergence of clinical signs. This was surprising, since profound neurodegeneration at this stage was unlikely to be the explanation for the expansion. In the current study, we determined whether the VV changes remain stable over time, and whether correlations with other disease activity measures existed. We extended the length of serial MRI measurements following EAE induction. To examine the implications of these results on MS pathology, we investigated retrospectively data from a clinical MS study, in which patients had undergone a series of 13 monthly MRI scans over one year3, to determine whether: 1. MS patients show dynamic variations in VV over time exceeding the range of normal variation; and whether 2. Fluctuations in VV in MS patients show any temporal correlations with other MRI or clinical parameters.Methods
Preclinical Study: Animal experiments were approved by the local authority (LAGeSo, Berlin), in accordance with guidelines 86/609/EEC. EAE was induced in SJL/J mice using proteolipid protein as previously2. Mice were scored daily and imaged every 2-3 days, until day 64 after immunization, using a 9.4T animal scanner (Bruker BioSpin, Ettlingen, Germany). Coronal fast spin-echo T2-weighted brain images were acquired (TE=14.345ms, TR=3000ms, in-plane resolution=32μm, repetitions=16, slices=15, thickness=500μm, TA=33min36sec). Slice positioning was consistent throughout the study. VV was quantified using FSL5.0 and manually corrected. Clinical Study: MRI data from MS patients was obtained from our previously published atorvastatin clinical trial in RRMS3. Patients with clinically definite MS, having at least one contrast-enhancing lesion (CEL) underwent 13 monthly MRI examinations (n=33). Scans were performed on a 1.5T clinical MRI scanner. Spin-echo T2-weighted images were acquired; spin-echo T1-weighted images were obtained pre- and post-administration of 0.1 mmol/kg Gd-DTPA. Volumes and numbers of CEL and T2 lesions number and volume were measured using a semi-autonomous procedure, by experienced raters blinded to clinical outcomes. Absolute ventricle volume was quantified using FSL5.0, and corrected manually using ITK-SNAP. A cohort of n=6 healthy individuals who had undergone multiple serial MRI scans over several months served as controls4.Results
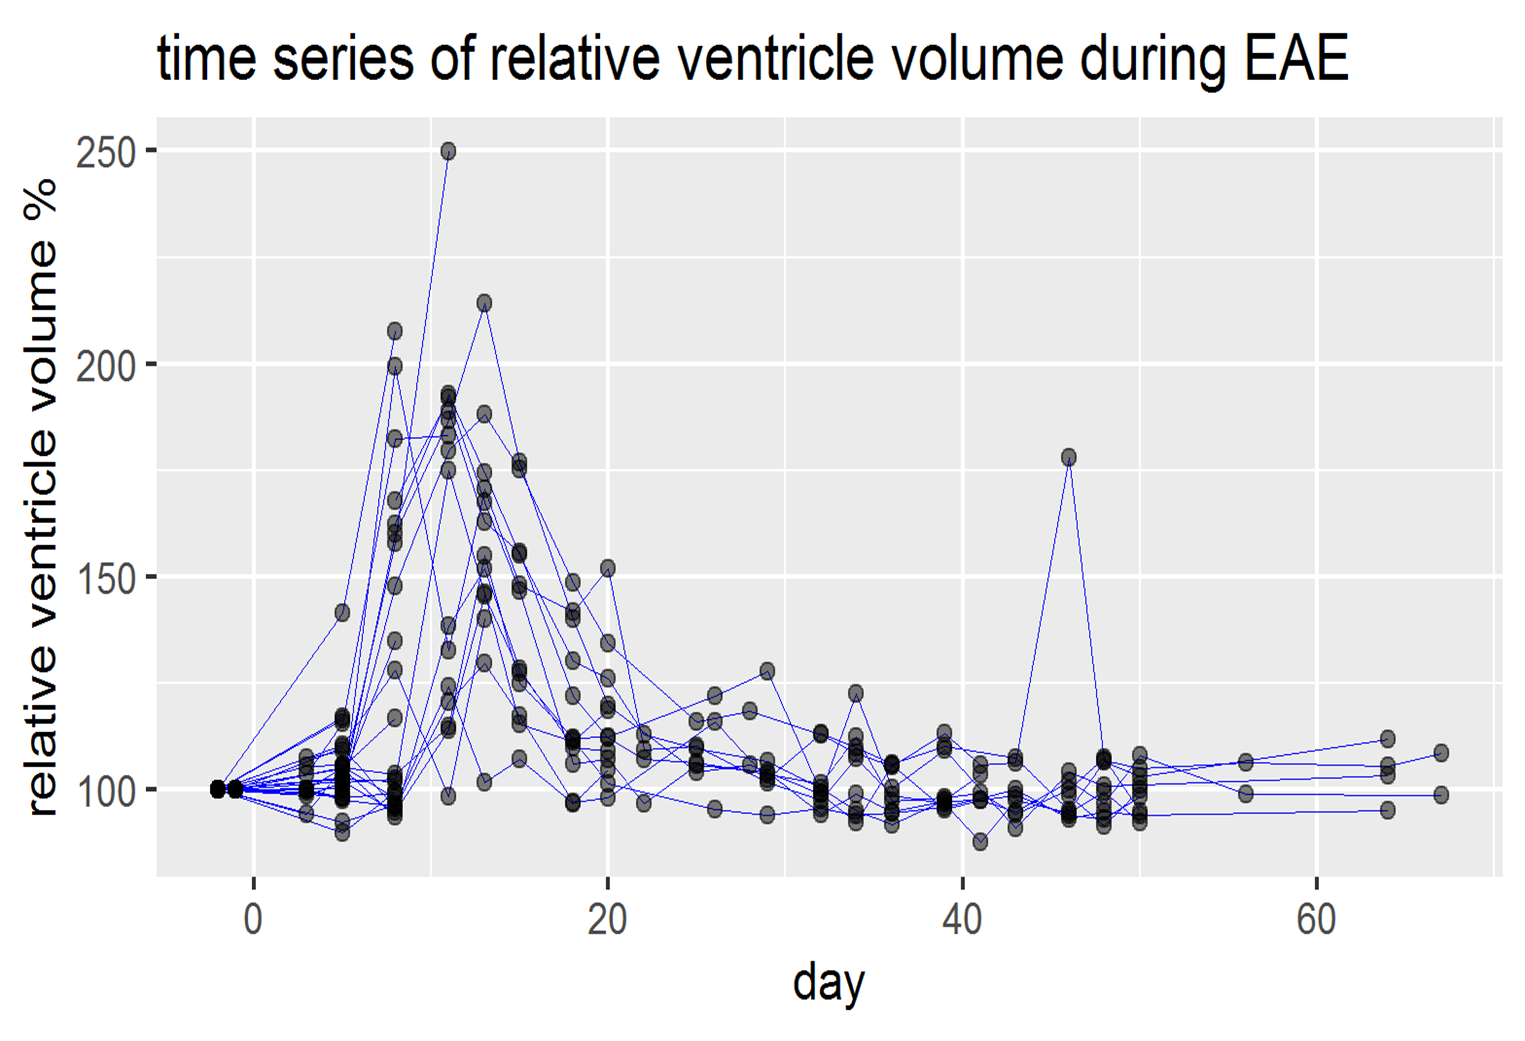
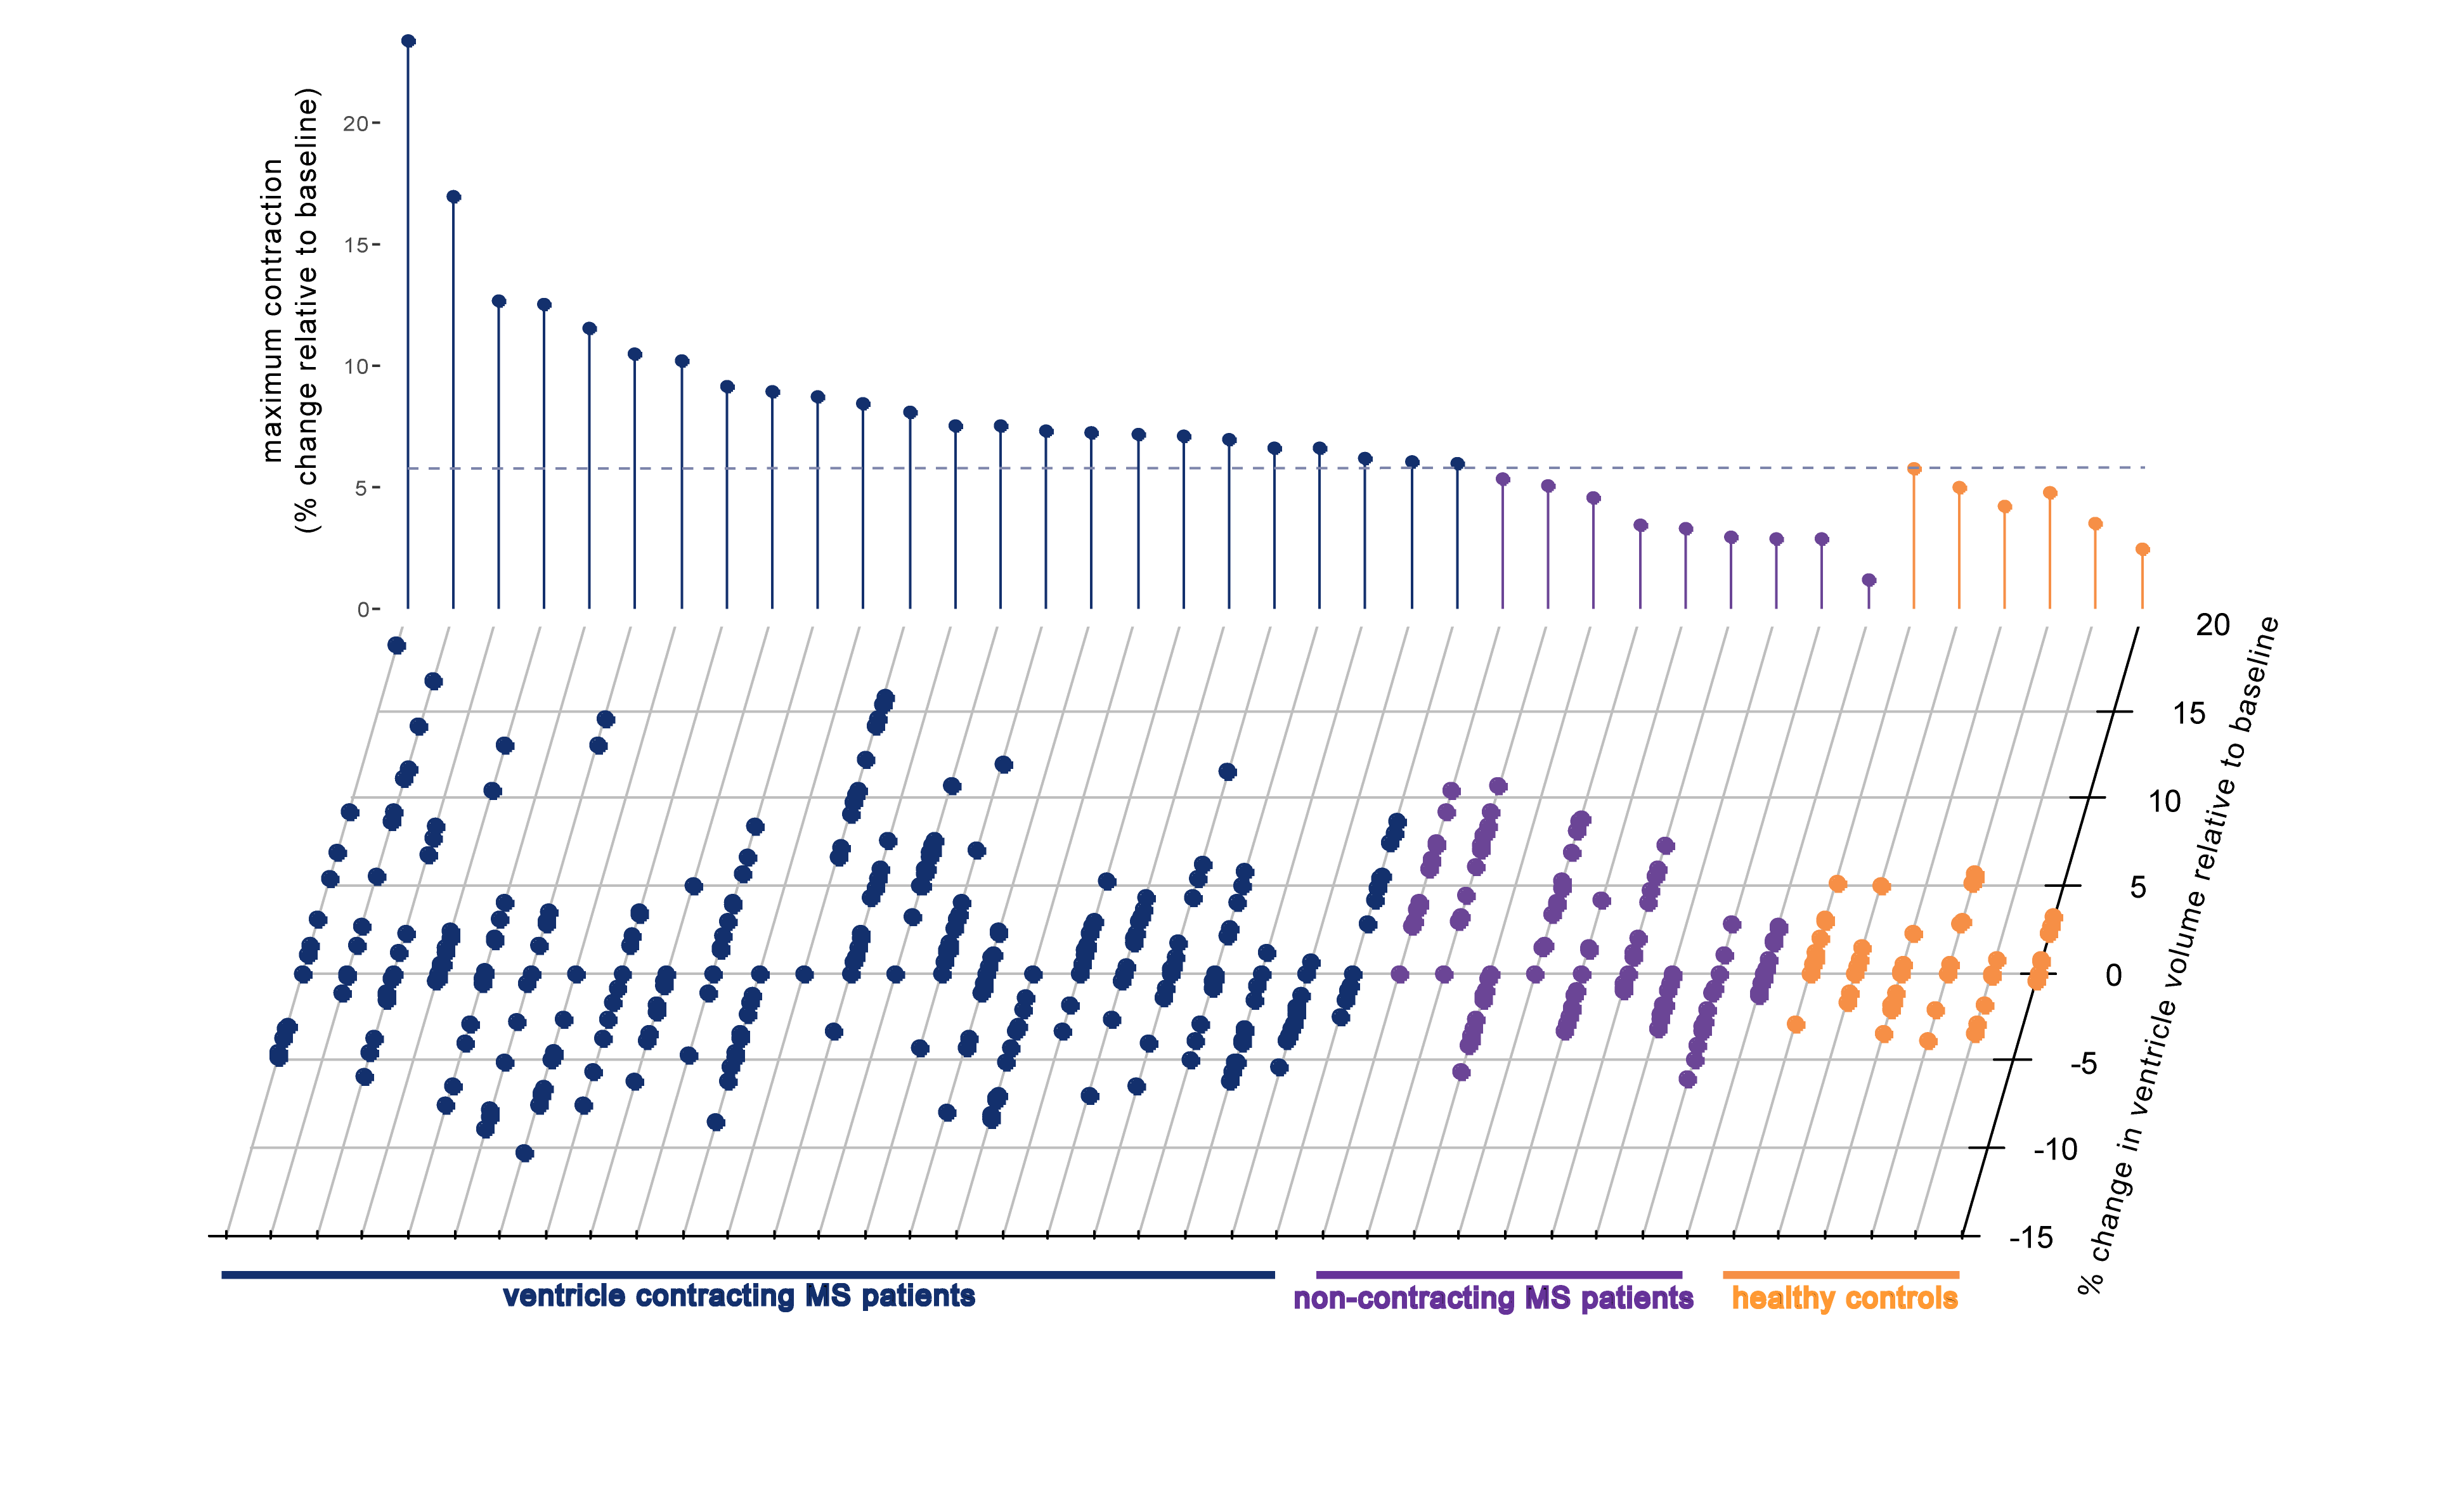
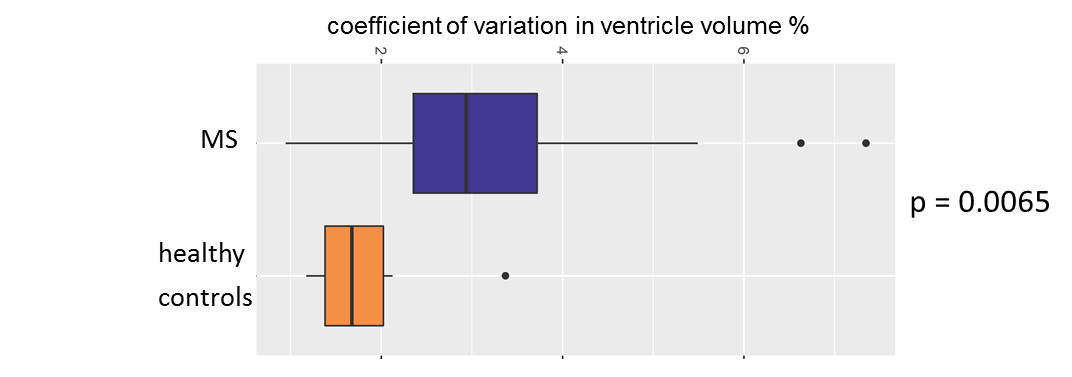
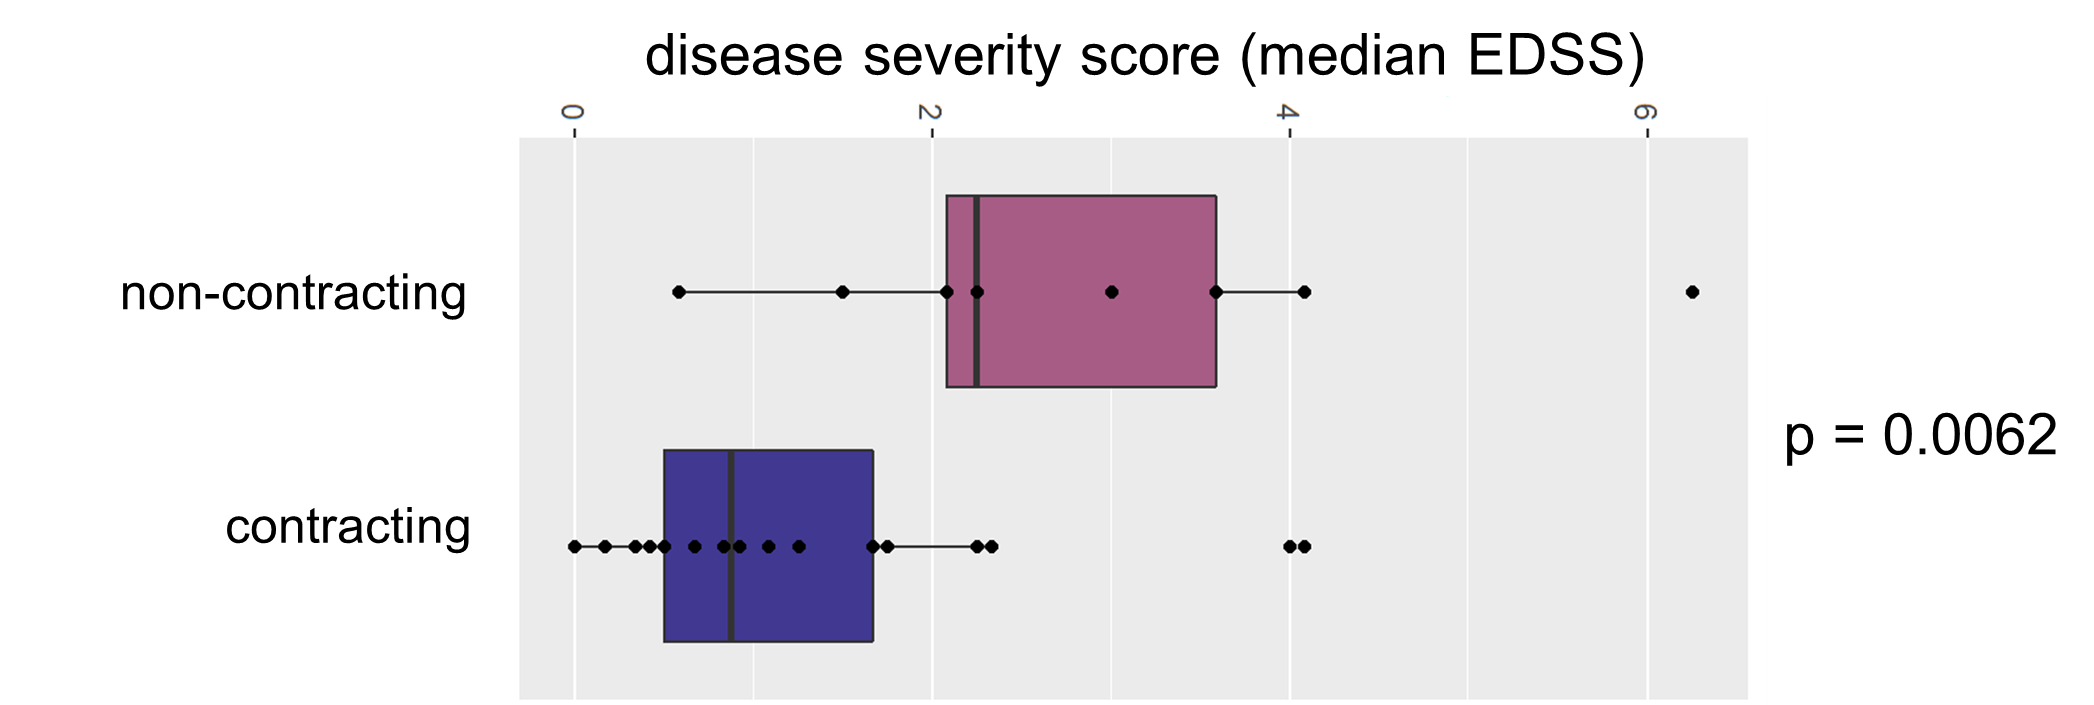
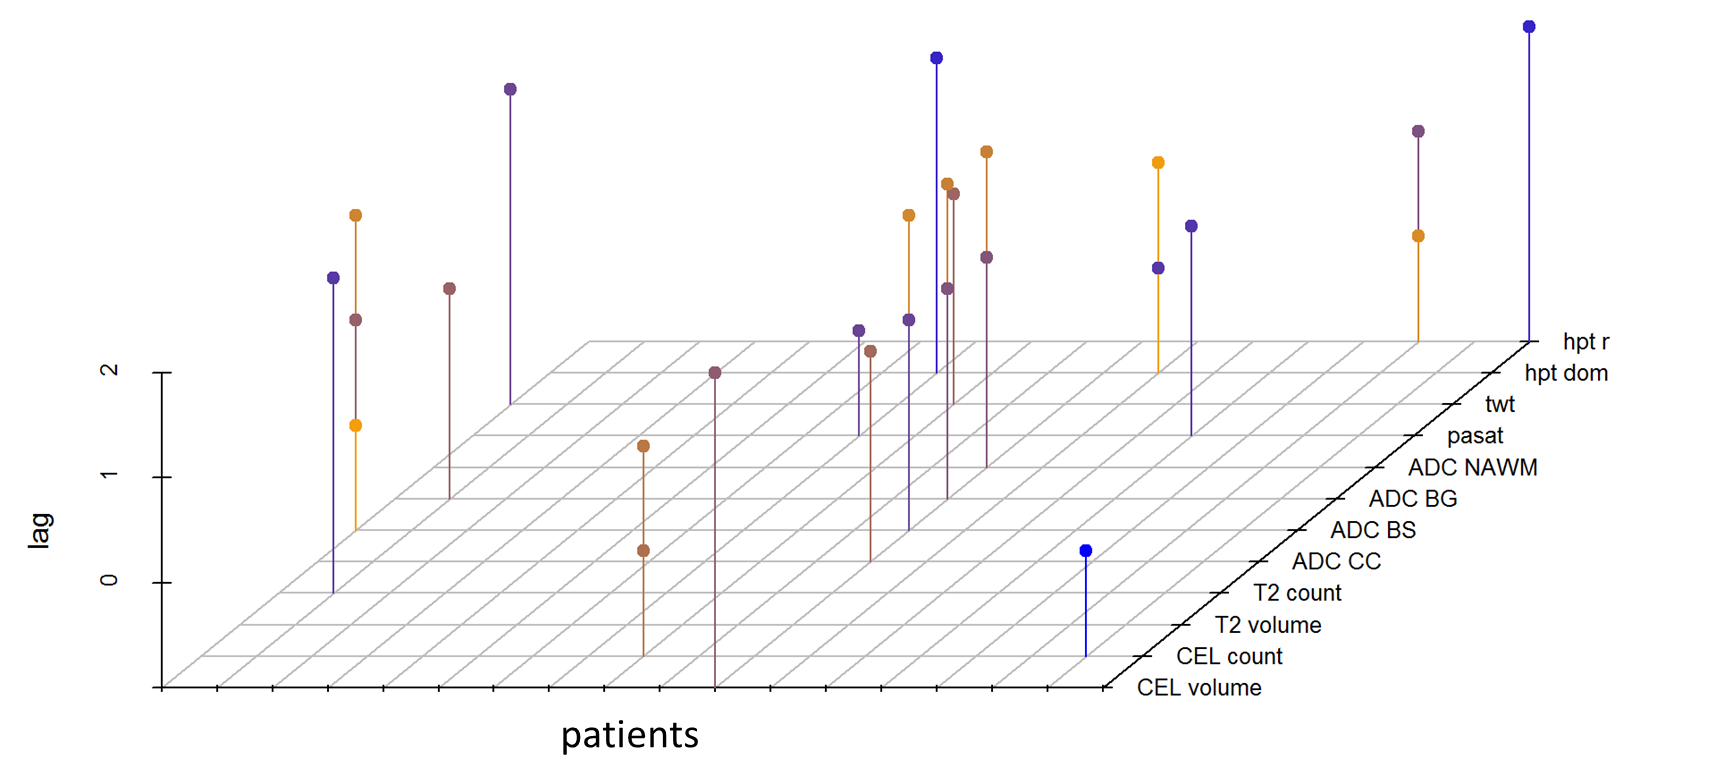
In EAE mice we observed a dramatic increase in VV prior to the onset of clinical signs. VV of all mice returned to normal upon remission of clinical signs (Fig.1). Subsequent VV fluctuations occurred in parallel to clinical exacerbations, but were less pronounced than during the initial disease phase. In MS patients, we observed substantial heterogeneity in VV volatility (VVV) relative to baseline when compared to the ±6% range of VV changes in the control group (Fig.2). Several MS patients (24/33) showed VV changes exceeding this 6%threshold (VVV+ group) indicating that VV changes were not a monotonic increase in volume during the study period (Fig.2). The MS cohort had significantly greater coefficient of variation in VV compared to controls (Fig.3). Interestingly, MS patients with contractions >6% had significantly lower disease severity than non-contracting patients (VVV-) (Fig.4). Time series analysis was used to assess temporal correlations between VV changes, and changes in 12 other MRI (CEL and T2 lesion counts and volumes, DWI) and clinical parameters in the VVV+ group. Nearly half (n=10) of the 24 VVV+ MS patients showed significant cross-correlation coefficients between VV and other parameters (after correcting for multiple comparisons) (Fig.5).Conclusions
Here we show dynamic VV changes occurring during the disease course in the animal model, and also in RRMS patients. The fact that VV often contracted following expansion argues that these variations are not merely the result of brain atrophy and neurodegeneration, but rather reflect processes related to the inflammatory status. This hypothesis is further supported by the observation that VVV+ patients appear to be in an earlier disease stage (lower severity) compared to VVV- patients. Since the timing of VV changes in some patients correlated with the timing of other MRI and clinical parameter changes, VV alterations may reflect underlying disease activity. This relationship is complex, as no single parameter dominated the set of significant correlations with VV. However, this was also the case for one of the gold standard MR parameters (CEL volume) used as disease activity indicator. The mechanisms underlying this phenomenon, and the prognostic and diagnostic value of VV as a contrast-free MRI parameter for MS patients, remain topics for further investigation.Acknowledgements
We thank Stefanie Münchberg for technical assistance.References
1. Fox, N.C., et al. Progressive cerebral atrophy in MS: a serial study using registered, volumetric MRI. Neurology, 2000;54:807-812.
2. Lepore, S., et al. Enlargement of cerebral ventricles as an early indicator of encephalomyelitis. PloS One, 2013; 8, e72841.
3. Paul, F., et al. Oral high-dose atorvastatin treatment in relapsing-remitting multiple sclerosis. PloS One, 2008; 3, e1928.
4. Filevich, E., et al. Day2day: investigating daily variability of magnetic resonance imaging measures over half a year. BMC Neuroscience, 2017; 18, 65.
Figures