3159
Brain volume measurements in multiple sclerosis patients: a novel combination approach for routine clinical assessment in MS PATHS1Biogen, Cambridge, MA, United States, 2LTS5, École Polytechnique Fédérale de Lausanne (EPFL), Lausanne, Switzerland, 3Department of Radiology, Centre Hospitalier Universitaire Vaudois (CHUV), Lausanne, Switzerland, 4Advanced Clinical Imaging Technology, Siemens Healthcare AG, Lausanne, Switzerland, 5Cleveland Clinic, Cleveland, OH, United States, 6Johns Hopkins University, Baltimore, MD, United States, 7New York University, New York, NY, United States
Synopsis
Highly precise measurements from fully automated techniques are required to quantify brain atrophy in individual multiple sclerosis (MS) patients. We developed a novel approach to reliably estimate brain atrophy in MS that combines two techniques applied to different image contrasts and incorporates inter-scanner calibrations. We validated this approach using data acquired in a scan-rescan study. Mean coefficient of variation (CV) for the new brain parenchymal fraction measurement was 0.18%, which was lower than the CV attained for the individual techniques. This new metric will next be integrated into the radiology workflow in MS PATHS institutions for further testing.
Introduction
Group-level evidence from multiple sclerosis (MS) clinical trials suggest that MRI-based brain atrophy measurements reflect disease severity, progression, and neuroprotective effects of therapies.1,2 Brain volume (BV) measurements may also be useful for monitoring individual MS patients and to inform treatment decisions. However, several challenges have prevented widespread application of BV measurements in routine clinical practice. One of the biggest challenges is the requirement for highly precise measurements because the brain atrophy rate in MS patients is only 0.5%/year, on average.3 Furthermore, BV measurements fluctuate over time, even when using standardized MR imaging and precise measurements. In a direct comparison of available techniques applied in a scan-rescan study, variability in commercially available brain atrophy measurements ranged from 0.25%-0.46%,4 indicating the need for a more precise approach.
The Multiple Sclerosis Partners Advancing Technology and Health Solutions (MS PATHS)5 initiative was designed to enable the generation of standardized, quantitative data from routine medical visits. One of the specific goals of MS PATHS is to develop technology that will enable the generation of reliable MRI metrics as part of routine radiology workflow. To that end, the objective of this study was to demonstrate a novel approach that combines results from two fully automated brain segmentation techniques to compute brain parenchymal fraction (BPF), a precise metric to measure brain atrophy in MS patients.
Methods
Thirty MS patients (male/female = 13/17; mean age = 39.3 years) from three MS PATHS institutions participated in a scan-rescan study. Each patient was imaged four times over two visits within one week on two different Siemens 3T scanners (including MAGNETOM Verio, Skyra, Prismafit and Biograph mMR, Siemens Healthcare, Erlangen, Germany). The MS PATHS standardized image acquisition protocol included T1- and T2-weighted 1-mm isotropic 3D sequences (MPRAGE: TR=2300ms, TE=2.96ms, TI=900ms; FLAIR: TR=5000ms, TE=392ms, TI=1800ms).
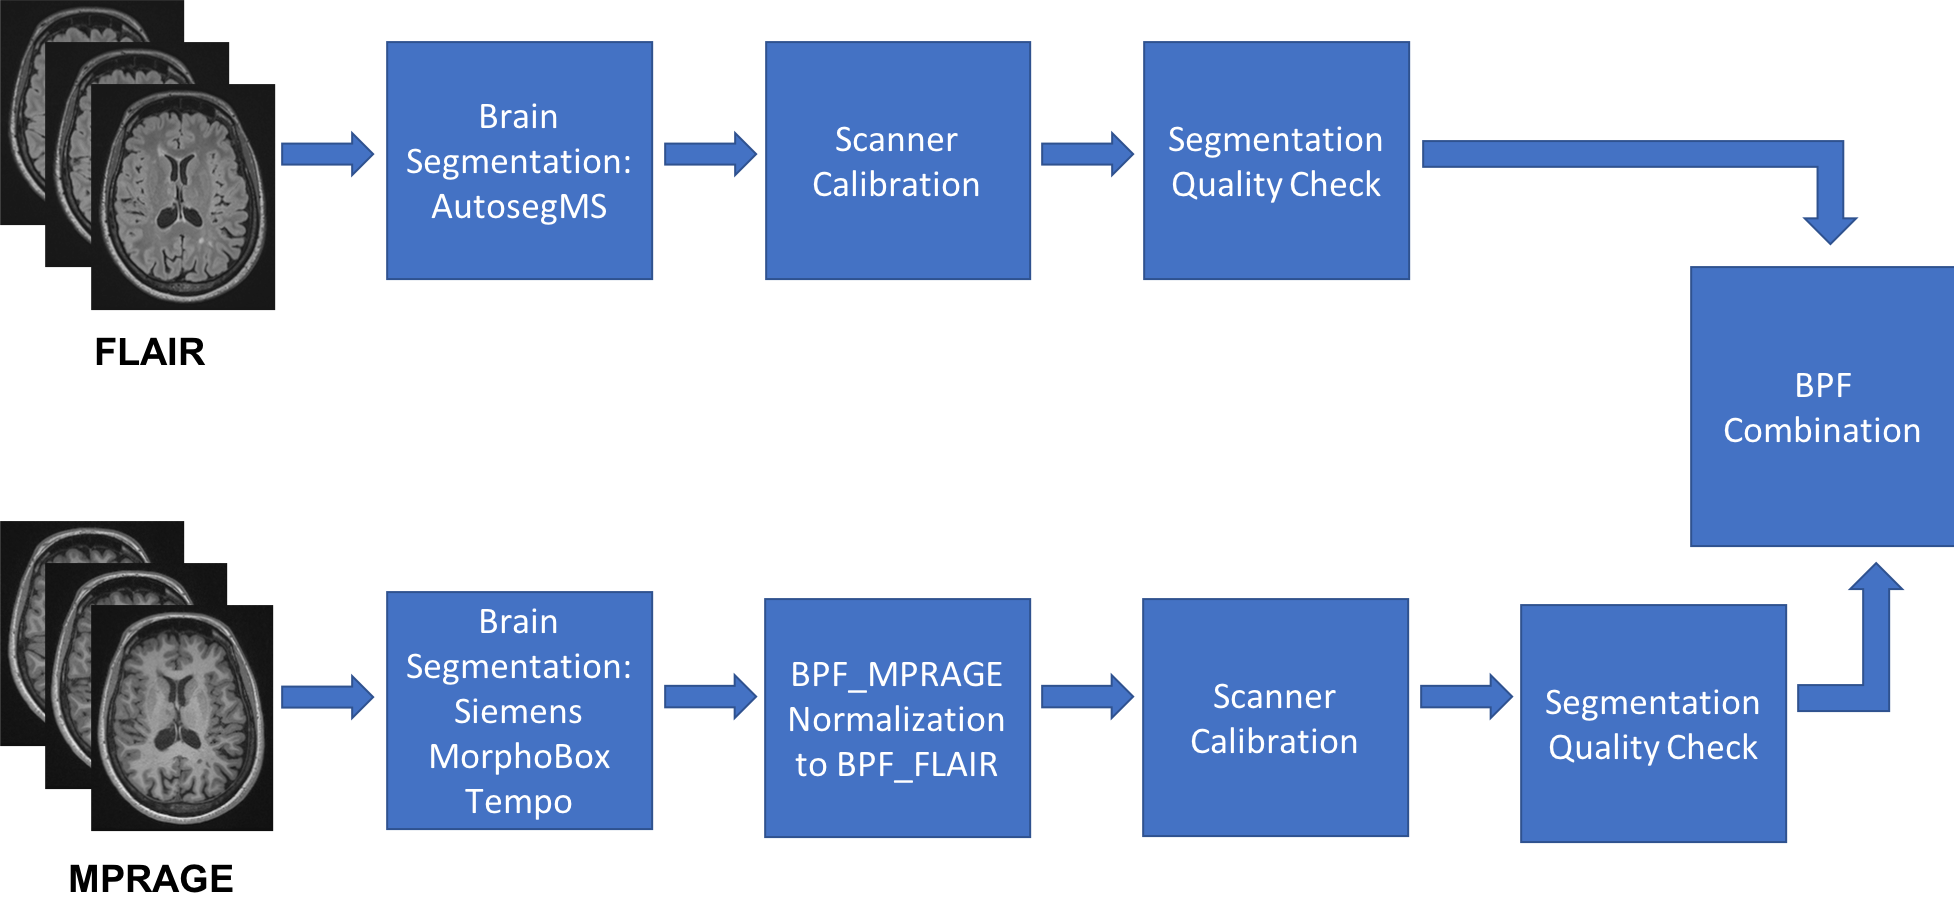
The images were analyzed using the new algorithm, where BPF is computed using a pipeline that independently runs two fully automated methods (Figure 1). Specifically, FLAIR images are analyzed using a modified version of autosegMS (Cleveland Clinic)6-7 and MPRAGE images are analyzed using the MorphoBox-Tempo prototype (Siemens Healthcare, Erlangen, Germany)8-9 to yield two BPF measurements: BPF_FLAIR and BPF_MPRAGE, respectively. Next, BPF_MPRAGE is normalized to BPF_FLAIR using a polynomial regression model and then each BPF measurement is calibrated across scanners within each institution, if necessary, using a linear regression model. Segmentation quality is estimated for each BPF using Hausdorff distance and Dice coefficient metrics in relation to a standardized template. The final combined BPF (BPF_Combo) is computed using a weighted average of the two BPF values, where the weights are based on the segmentation quality measures. Coefficient of variation (CV) was computed to estimate and compare variability in BPFs. We repeated the analyses to investigate the effects of different order of operations on mean CV of BPF_Combo measurements.
Results
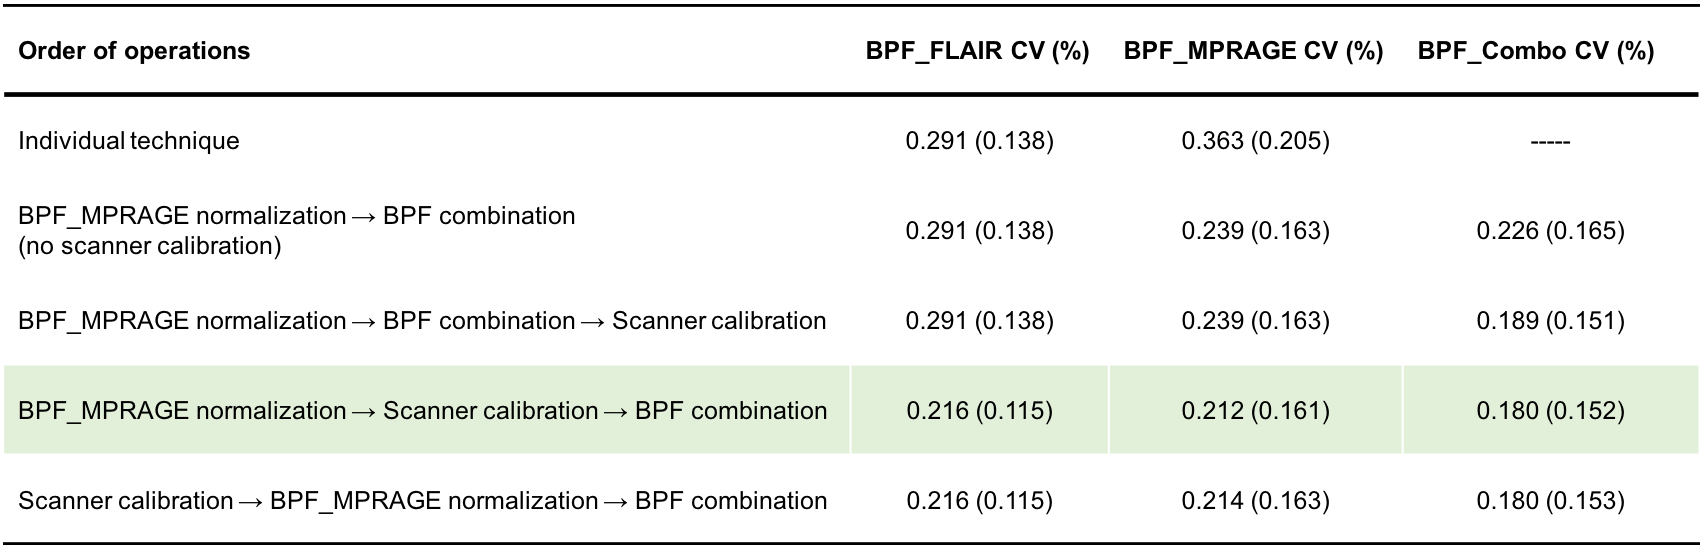
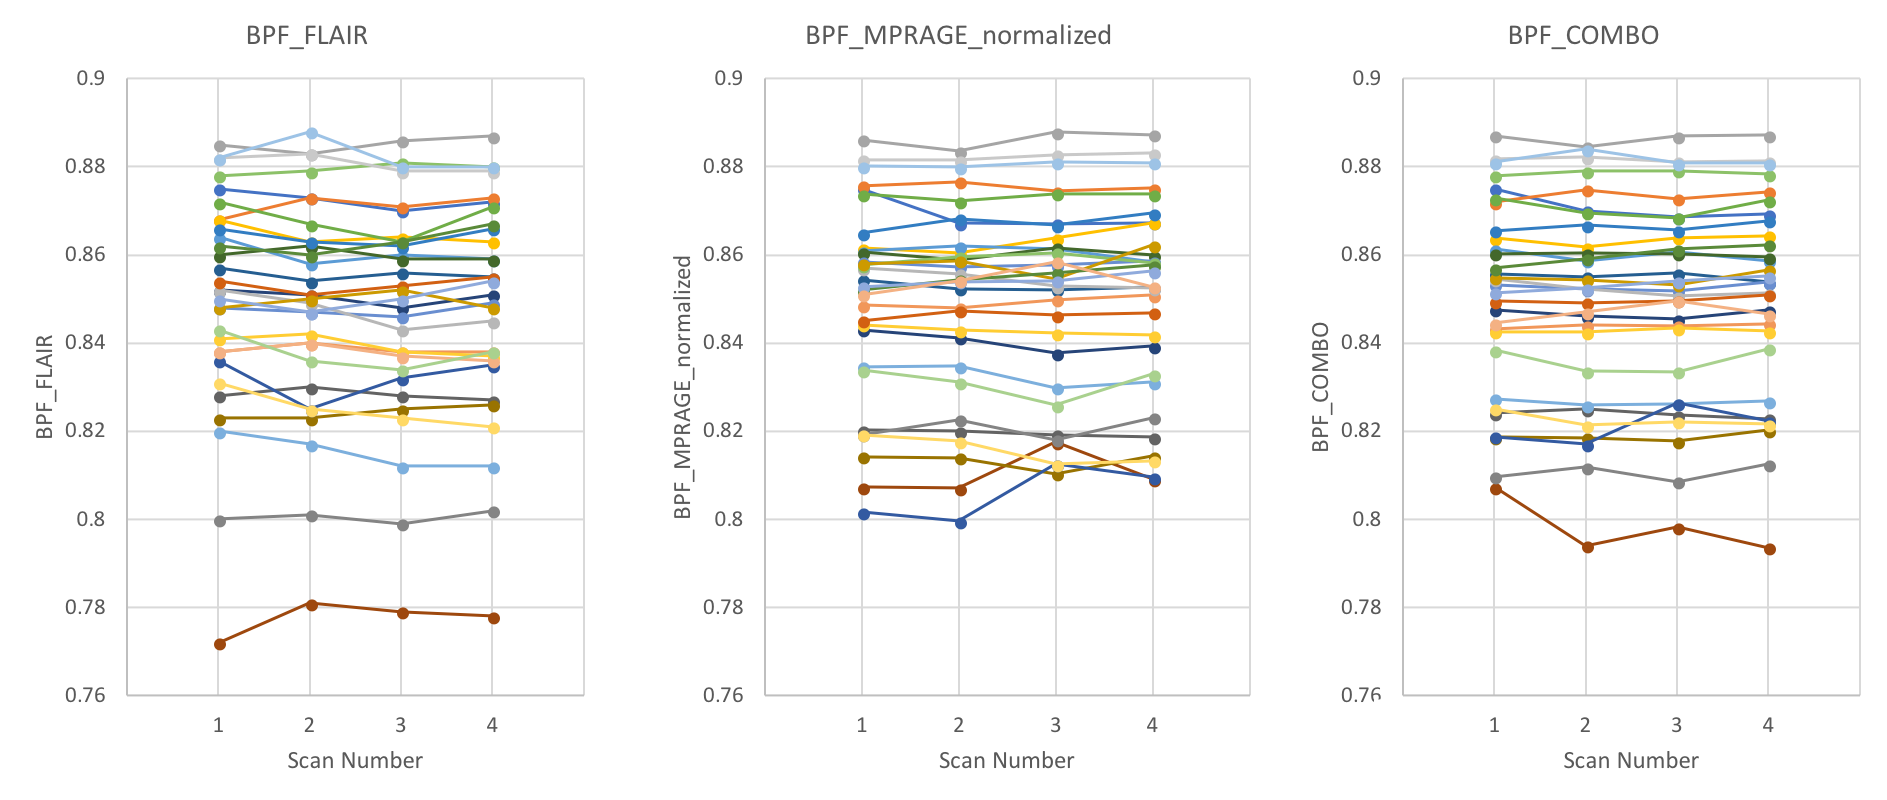
Results for all 30 patients are shown in the Table and Figure 2. CVs tended to be higher for BPF_FLAIR and BPF_MPRAGE and lower for BPF_Combo. Variability was further reduced when the pipeline included scanner calibrations. The lowest variability (0.18%) was achieved for approaches that performed normalization and scanner calibrations prior to combining BPF_FLAIR and BPF_MPRAGE. Changing the order of operations to perform scanner calibration as the last step, after the combination, resulted in slightly higher CV. The proportion of subjects for whom individual CVs were less than 0.25% over 4 scans was 53%, 40%, and 87%, for BPF_FLAIR, BPF_MPRAGE, and BPF_Combo, respectively.Discussion
For application to routine clinical assessment, BV measurement techniques must have low variability (CV ~0.25%) in order to detect brain atrophy in individual MS patients. The proposed BPF combination approach leverages two independent segmentations based on different input images to minimize variability due to measurement error. The current study confirms that scanner calibration is necessary to reduce variability, even when using highly standardized image acquisition conditions (e.g. imaging sequence, scanner manufacturer, field strength, type of coil). Importantly, the analysis of variability for each patient demonstrated that the BPF_Combo method yielded highly reproducible results for a much higher proportion of patients than was observed for either individual technique.Conclusion
The new approach, BPF_Combo demonstrated promising results with the lowest overall CV in the scan-rescan study compared to either individual technique. Therefore, the proposed BPF combination approach may be applicable for routine monitoring of brain atrophy in MS patients. The new method has been incorporated into a software prototype to be integrated into the radiology workflow at MS PATHS institutions for clinical testing and validation.Acknowledgements
No acknowledgement found.References
1. De Stefano N, et al. Assessing brain atrophy rates in a large population of untreated multiple sclerosis subtypes. Neurology. 2010;74(23):1868-1876.
2. De Stefano N, et al. Clinical Relevance of Brain Volume Measures in Multiple Sclerosis. CNS Drugs 2014;28(2):147–156.
3. Sormani M-P, et al. Treatment effect on brain atrophy correlates with treatment effect on disability in multiple sclerosis. Ann Neurol. 2014;75(1):43-49.
4. Tsang A, et al. Comparison of Techniques for Measurement of Brain Volume in Multiple Sclerosis Patients. Neurology. 2018;90 (15 Supplement) P3.354
5. https://www.mspaths.com
6. Fisher E, et al. Knowledge-based 3D segmentation of the brain in MR images for quantitative multiple sclerosis lesion tracking. In: SPIE Proc. Medical Imaging: Image Processing. 1997. pp.19–25
7. Rudick RA, et al. Use of the brain parenchymal fraction to measure whole brain atrophy in relapsing-remitting MS. Multiple Sclerosis Collaborative Research Group. Neurology 1999;53(8):1698–1704.
8. Schmitter D, et al. An evaluation of volume-based morphometry for prediction of mild cognitive impairment and Alzheimer’s disease. NeuroImage Clin. 2014;7:7–17.
9. Roche A, Forbes F. Partial Volume Estimation in Brain MRI Revisited BT - Medical Image Computing and Computer-Assisted Intervention – MICCAI 2014: 17th International Conference, Boston, MA, USA, September 14-18, 2014, Proceedings, Part I. In: Golland P, Hata N, Barillot C, Hornegger J, Howe R, editors. Cham: Springer International Publishing; 2014. pp. 771–778.
Figures