3158
Statistical analysis of phase congruency detects normal appearing white matter changes associated with disease severity between relapsing remitting and secondary progressive multiple sclerosis1University of Calgary, Calgary, AB, Canada
Synopsis
Mechanisms of disease progression from relapsing remitting to secondary progressive multiple sclerosis (MS) are still unclear. Here we applied new texture analysis approaches including phase congruency to understand the differences between normal appearing white matter structure in the brain corpus callosum of patients with relapsing or progressive MS, and matched controls. We found that the contrast, energy, and homogeneity of weighted mean phase in the corpus callosum differentiate MS patients from controls, and energy and homogeneity further distinguish relapsing from progressive MS. Advanced analysis of phase congruency outcomes may help detect disease progression in MS.
Purpose
Multiple sclerosis (MS) affects >2.3 million people worldwide1. The majority start with relapsing remitting (RR) MS, but >60% convert to secondary progressive (SP) MS where patients begin to suffer from relentless progression in physical disability2. While the progression mechanisms remain unclear, pathological changes in brain normal appearing white matter (NAWM) are suggested to play a critical role3. Phase congruency is a promising method that can detect the edge and corner texture features in an image4, making it highly sensitive to small structure changes. Our purpose was to detect if phase congruency combined with statistical analysis can detect differences in the NAWM in magnetic resonance imaging (MRI) between patients with RRMS and SPMS, and heathy controls. Specifically, we focused on the largest interhemispheric NAWM, corpus callosum, that is affected in 70% of the MS patients5.Methods
We studied 19 MS patients (mean age = 47.8 years, range = 28-75 years] and 19 age-, gender-, and education-matched controls, who were all right-handed females. The MS group included ten subjects with mild RRMS within 5 years of disease onset (0≤disability status score≤3; mean=1.7) and 9 with advanced SPMS (disability status score≥6; mean=6.5). All participants were scanned in a 3T scanner for both anatomical and diffusion MRI. Anatomical sequences included a pre-contrast T1-weighted MRI acquired with a fast spoiled-GRE sequence [TR/TE = 8/3 ms; matrix = 256x256, FOV = 25x25 cm, slice thickness = 1 mm].
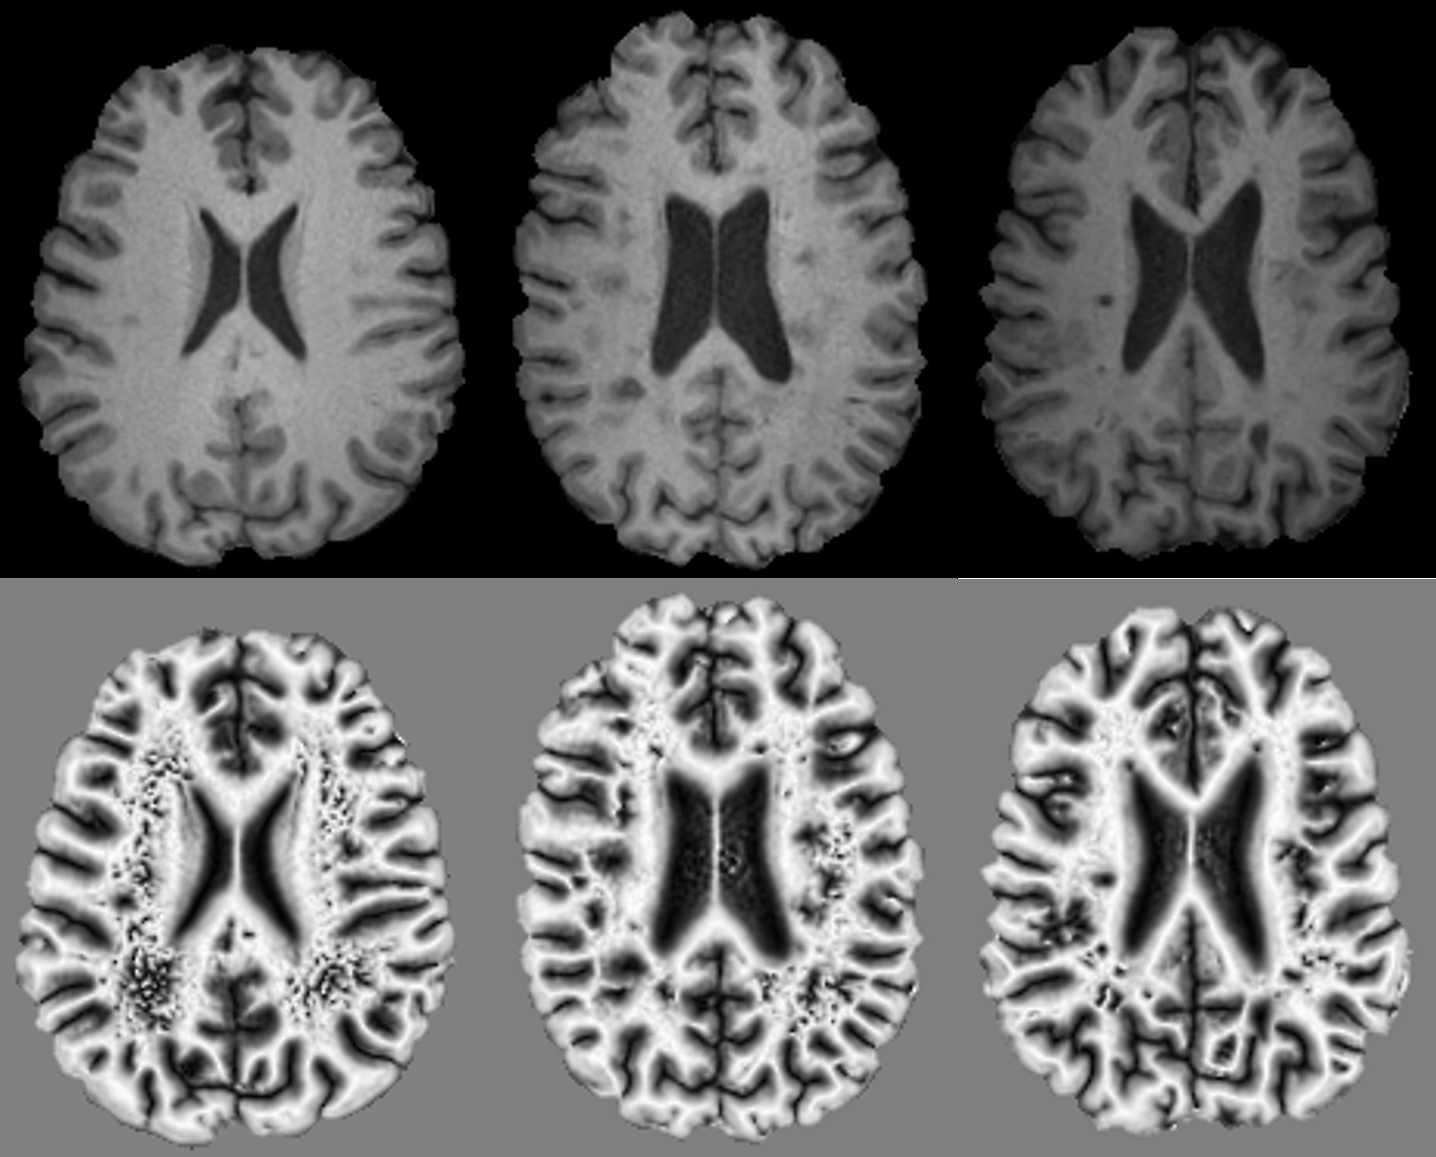
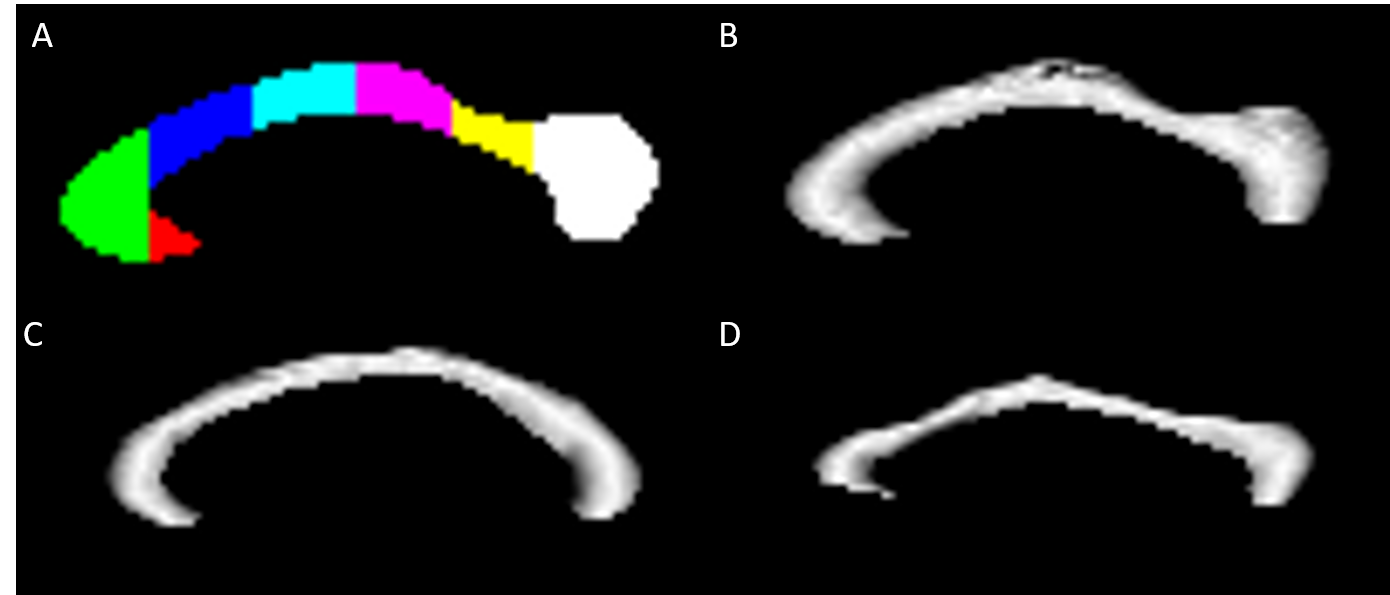
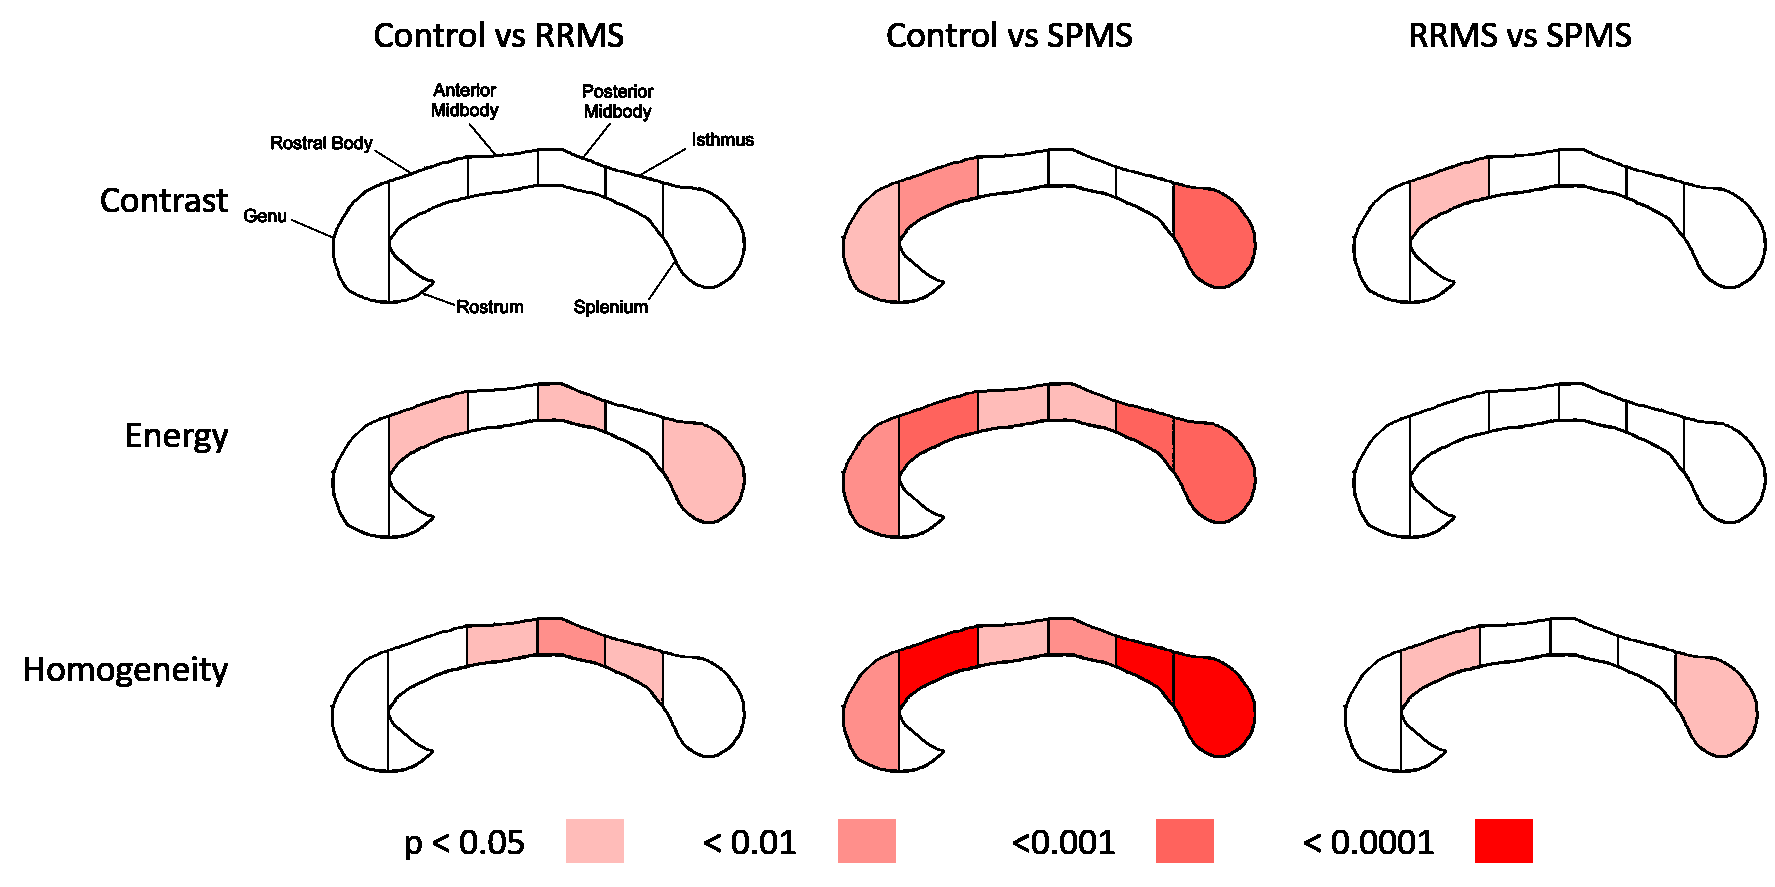
Phase congruency was performed on pre-contrast T1-weighted MR images which provided optimal gray and white matter contrast. Axial T1-weighted images were first converted to a NIfTI raw format with dcm2niix, then skull extracted using FSL BET6, and then aligned along the mid-sagittal plane with the Automatic Registration Toolkit (ART) acpcdetect7. A customized phase congruency algorithm based on an open source program8 was applied to the full-brain volumes, generating four parameters, where the weighted mean phase (WMP) showed the best delineation of brain structures and was used here (Fig. 1). T1-weighted and WMP volumes were resliced along the mid-sagittal plane and the T1 mid-sagittal corpus callosum was then parcellated using ART Yuki9 based on the Witelson scheme (Fig. 2a). Statistical analysis was done for the WMP corpus callosum, after normalizing its values to 0 to 1 (Fig. 2b-d), using the gray-level co-occurrence matrix (GLCM) method implemented in MATLAB. GLCM calculated the spatial distribution of WMP features, whose outcomes included contrast, correlation, energy and homogeneity (Fig. 3), representing local GLCM variations, probability of intensity localizations, uniformity, and distribution of localized signals. Each metric was summarized from all angular directions (0, 45, 90, 1350) of the GLCM to achieve rotationally invariant features for the whole corpus callosum and seven Witelson segments. Significance was assessed using the independent samples t-test.
Results
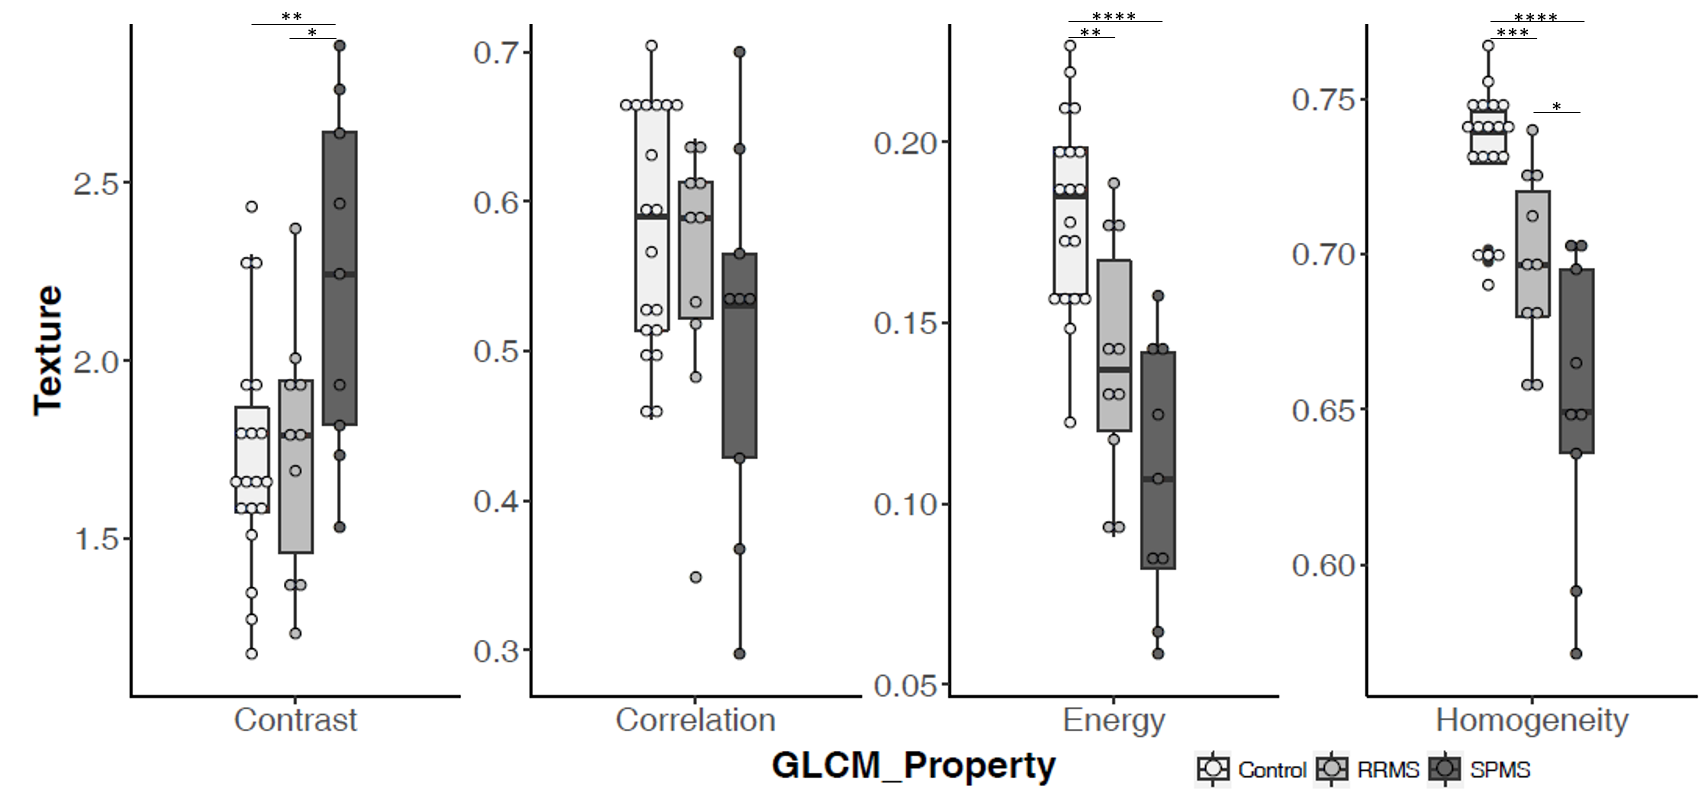
Homogeneity was significantly lower in RRMS (p<0.001) and SPMS (p<0.0001) patients compared to controls, and higher in RRMS than SPMS (p<0.05). Energy was significantly lower in RRMS (p<0.01) and SPMS (p<0.0001) patients than controls, approaching significance in RRMS versus SPMS. Correlation showed no significance in any comparisons while contrast only differentiated SPMS from controls (p<0.01) and RRMS patients (p<0.05).
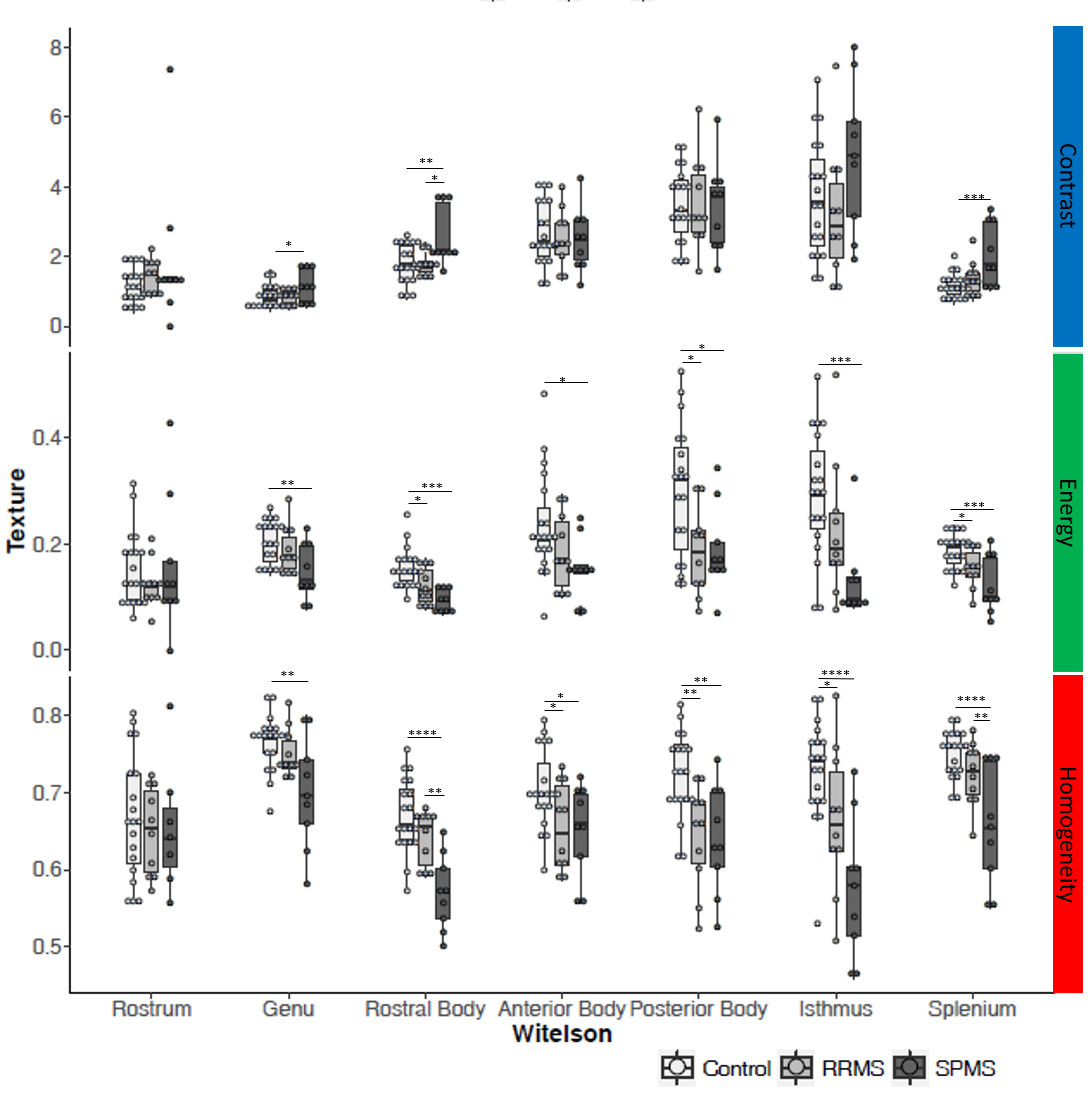
Contrast, energy, and homogeneity were further investigated in each division of the corpus callosum (Fig. 4). Energy and homogeneity detected structural differences in more corpus callosum areas than the contrast variable: three RRMS and all SPMS regions, with a trend to differentiating RRMS and SPMS in genu and isthmus areas, achieving significance in the rostral body and splenium (Fig. 5).
Discussion
Phase congruency is a novel method that has shown strong potential to differentiate lobar pneumonia from lung cancer and classify benign or malignant breast cancer tissues10,11. In our study, the homogeneity and energy of WMP appear to be associated with the severity and phenotype of MS, suggesting the sensitivity of the current image analysis techniques. Moreover, greater WMP texture in the genu, rostral body, isthmus, and splenium regions in SPMS than RRMS may suggest more severe tissue damage in the former associated with greater patient disability. Anatomically, these regions help coordinate motor, sensory, and visual functions, all critical domains in SPMS symptoms. Furthermore, the difference between MS patients and controls in phase texture in the anterior and posterior body, which coordinate motor and somatosensory functions between hemispheres, may indicate the relevance of these structures in MS pathogenesis but their contribution to disease progression deserves further confirmation.Conclusion
Statistical analysis of phase congruency outcomes in clinical MRI may be a useful approach for detecting NAWM abnormality associated with disease progression from RRMS to SPMS, a critical unmet need in the clinical care of MS patients.Acknowledgements
We thank the graduate studentship funding support of the NSERC I3T CREATE program and Bonvicini Charitable Gift Fund. We also thank the funding support from the MS Society of Canada, Natural Sciences and Engineering Council of Canada (NSERC), and Alberta Innovates Health Solutions.References
- Ontaneda D, Thompson AJ, Fox RJ, Cohen JA. Progressive multiple sclerosis: prospects for disease therapy, repair, and restoration of function. The Lancet, 389:1357-1366, November 2016.
- Casanova B, Coret F, Valero C, et al. High clinical inflammatory activity prior to the development of secondary progression: a prospective 5-year follow-up study. Mult Scler J, 8(1):59–63, February 2002.
- Haines JD, Inglese M, Casaccia P. Axonal Damage in Multiple Sclerosis. Mt Sinai J Med A J Transl Pers Med, 78(2):231–43. March 2011.
- Kovesi P. Phase congruency detects corners and edges. Digital Image Computing: Techniques and Applications: Proceedings of the VIIth Biennial Australian Pattern Recognition Society Conference - DICTA 2003.
- Dietemann JL, Biegelman C, Rumbach L, et al. Multiple sclerosis and corpus callosum atrophy: relationship of MRI findings to clinical data. Neuroradiology 30(6):478-480. December 1988.
- Smith M. Fast robust automated brain extraction. Human Brain Mapping, 17(3):143-155, November 2002.
- Ardekani BA: acpcdetect module of the Automatic Registration Toolbox (ART) for mid-sagittal plane segmentation, http://www.nitrc.org/projects/art.
- Ardekani, BA: yuki module of the Automatic Registration Toolbox (ART) for corpus callosum segmentation, http://www.nitrc.org/projects/art.
- Kovesi P. MATLAB and Octave Functions for Computer Vision and Image Processing, http://www.peterkovesi.com/matlabfns/.
- Rijal OM, Ebrahimian H, Mohd N, et al. Application of phase congruency for discriminating some lung diseases using chest radiograph. Computational and mathematical methods in medicine 2015, November 2014.
- Cai L, Wang X, Wang Y, et al. Robust phase-based texture descriptor for classification of breast ultrasound images. Biomed Eng Online 14:26, March 2015.
Figures