3156
Five Year Changes in Iron and Myelin in Relapsing-Remitting Multiple Sclerosis Deep Gray Matter Compared to Healthy Controls1Biomedical Engineering, University of Alberta, Edmonton, AB, Canada, 2University of Alberta, Edmonton, AB, Canada
Synopsis
This study evaluated RRMS and age-matched control longitudinal changes in iron/myelin-sensitive quantitative MRI of the deep gray matter (DGM) over 5 years. In addition to standard bulk analysis of the DGM, we have used a recently introduced analysis framework that utilizes combined R2* and QS for Discriminative Analysis of Regional Evolution (DARE) to identify regions of iron and myelin longitudinal change. The main findings of the study are the significantly different volume shrinkage rates of the thalamus and iron decrease rates of the caudate, thalamus, and globus pallidus over 5 years compared to age-matched healthy controls. Additionally, iron decrease in the CN and GP was shown to be correlated to clinical disease severity and duration, respectively.
Introduction
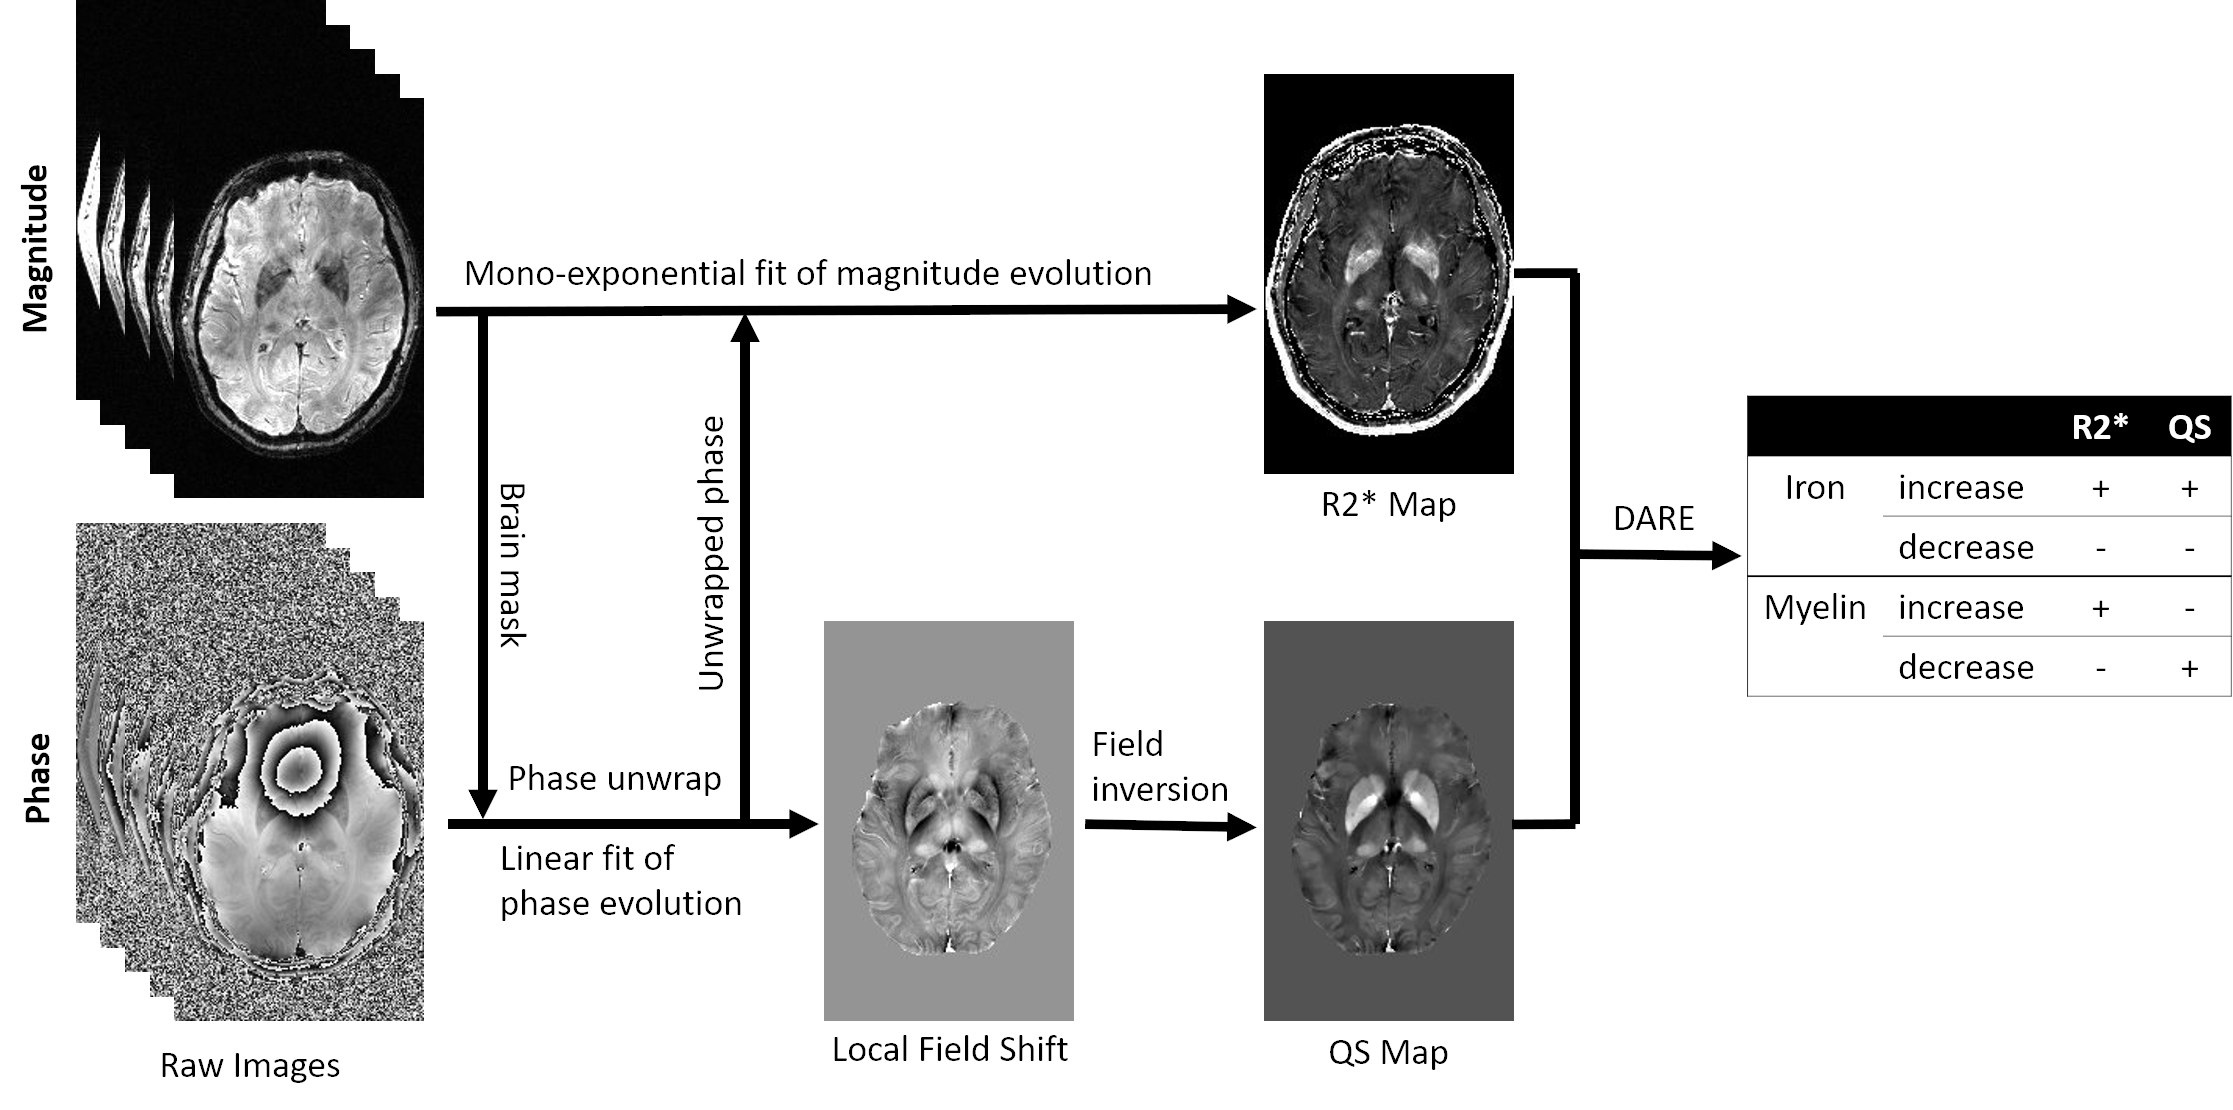
Five year changes in Deep Grey Matter (DGM) in Relapsing-Remitting MS (RRMS) were examined using MRI measures of volume, transverse relaxation rate (R2*) and susceptibility. By applying Discriminative Analysis of Regional Evolution (DARE) [1], R2* and Quantitative Susceptibility (QS) changes from iron and myelin were separated.
Methods
Automatic segmentation [2] of the Caudate Nucleus (CN), Putamen (PU), THalamus (TH), and Globus Pallidus (GP) was performed for 21 RRMS and 21 age-matched control subjects for baseline and 5-year follow-up 10-echo gradient echo acquisitions (Figure 1). R2* was computed using mono-exponential fit with sinc-correction of intra-voxel dephasing [3]. QS was calculated using BET brain extraction [4], PRELUDE phase unwrapping [5], RESHARP background field correction [6], and total variation dipole inversion [7].
Bulk DGM mean R2*/QS were analyzed using mixed factorial analysis (α=0.05), while DARE employed Mann-Whitney U tests to study regional changes. Depending on data distribution, Pearson’s regression and Spearman’s correlation were performed between disease duration and baseline MS Severity Scale (MSSS) with all significant bulk interaction and DARE results. False Detection Rate (FDR) correction was performed for all tests.
Results
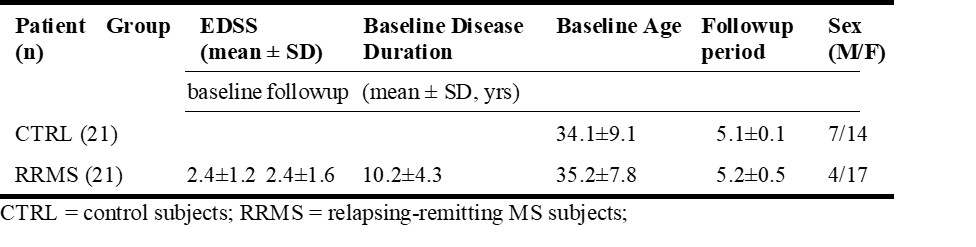
Table 1 describes demographic information of age-matched RRMS and control groups. Age-matching were confirmed using independent t-tests (P = 0.49).
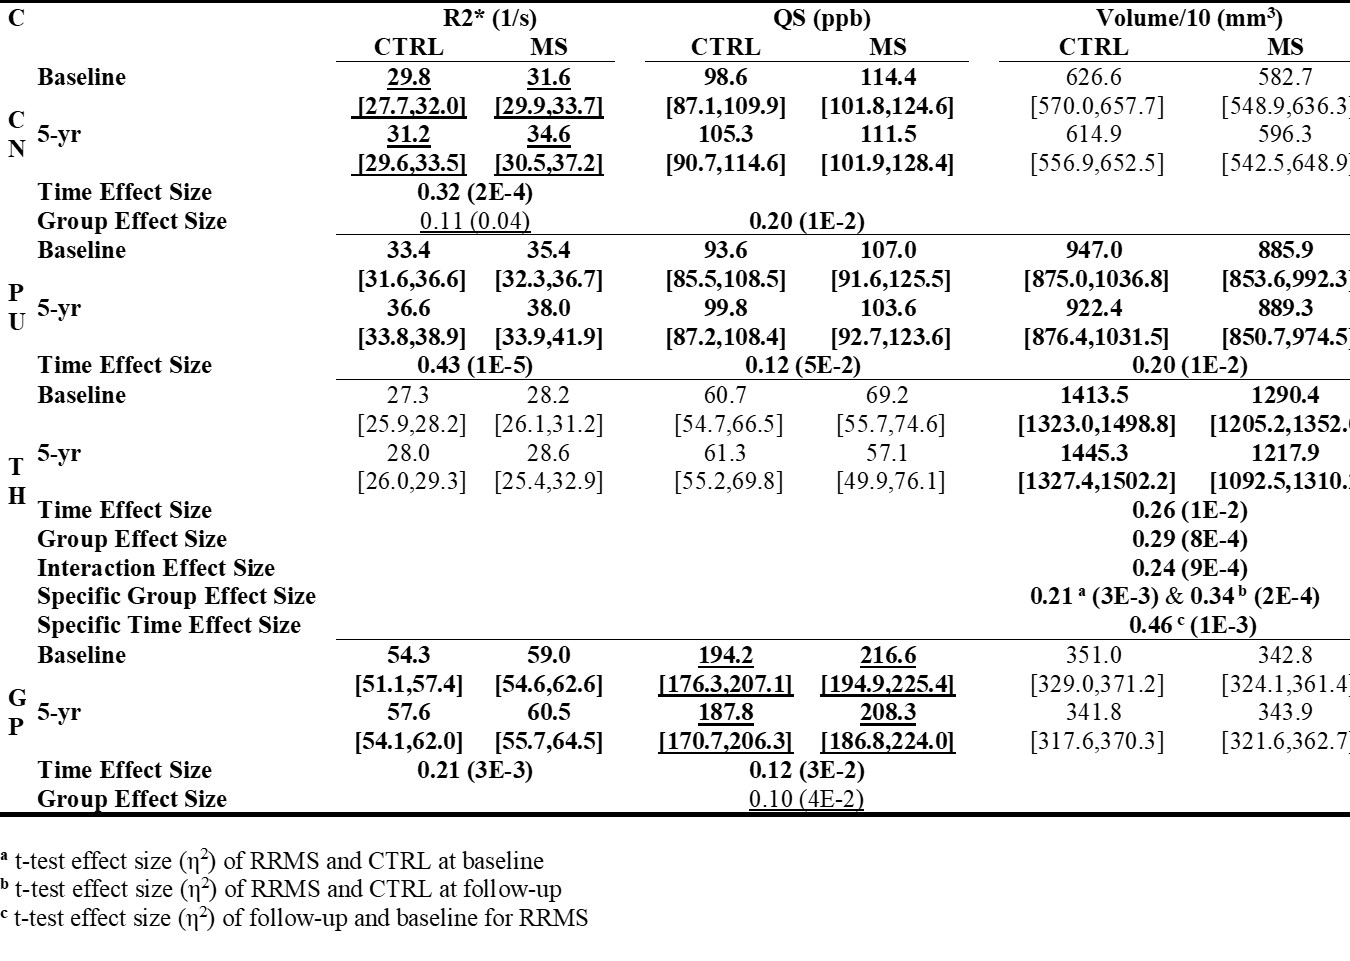
Table 2 lists results for bulk analysis of segmented DGM structures. Significant group effects between RRMS and controls were found for TH volume (Q = 0.0008; η2 = 0.29). Significant interaction was only found for TH volume (Q = 0.0009; η2 = 0.24). Specific independent t-tests revealed significant group effects at baseline (Q = 0.003; η2 = 0.21) and follow-up (Q = 0.0002; η2 = 0.34). Specific dependent t-tests indicated that there were no longitudinal effects for the control group, while 46% of the variance in the data was explained by longitudinal effects of the MS group for TH volume (Q = 0.001; η2 = 0.46).
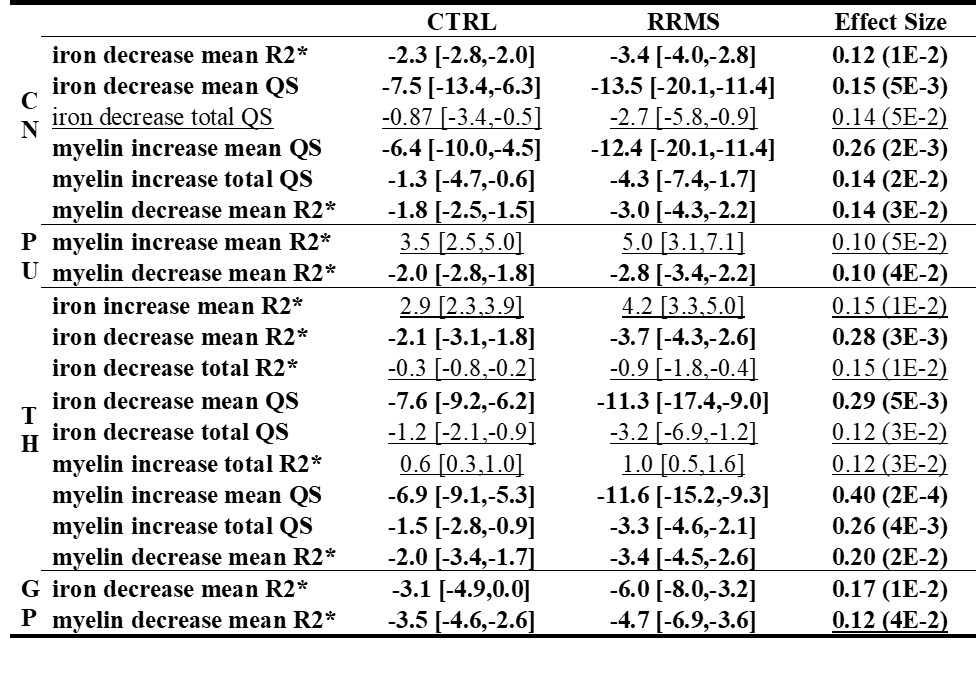
Table 3 lists significant DARE results and trends. Significant results were demonstrated in all studied structures, with iron decrease being the most prominent effect and myelin increase/decrease observed in the CN and TH.
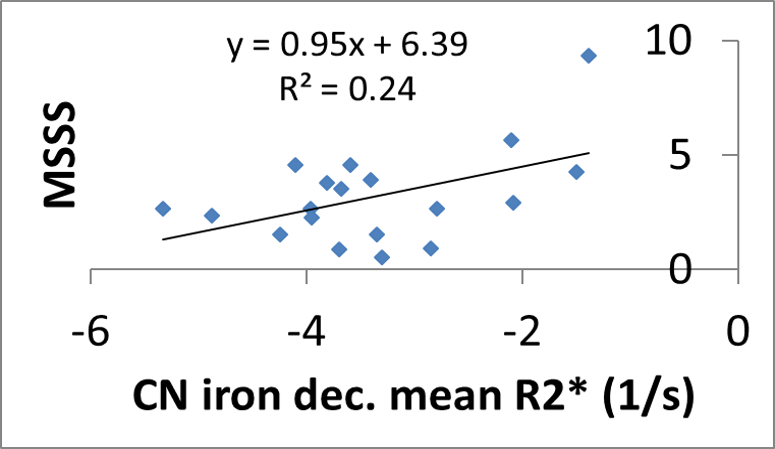
Figure 2 shows Pearson’s linear regression of MSSS with mean
R2* of CN iron decrease regions (r = 0.64; Q = 0.03). For non-normal residuals,
significant Spearman’s correlation was found between disease duration and mean
R2* of GP iron decrease regions (r = -0.56; Q = 0.02). No other
significant correlations were found for other bulk and DARE measures.
Discussion
Except for the caudate [1], two-year R2* [1,8], and QS [1,9] studies evaluating longitudinal changes in MS compared to age-matched control groups failed to demonstrate a significant interaction effect reflecting the pathological DGM iron accumulation in MS patients compared to healthy aging. Another longitudinal R2* study [10] which evaluated changes in MS compared to Clinically Isolated Syndrome (CIS) also failed to demonstrate interaction effects. Thus, longitudinal studies have mostly failed to confirm cross-sectional findings of increased rate of iron accumulation in MS compared to controls. Cross-sectional analysis of DGM R2* combined with volumetric measurements to produce a total voxel iron measure suggested that total iron is actually less in MS DGM compared to age-matched controls [11].
In a study by Schweser et al. [12], iron decrease in thalamic subnuclei was a consistent finding in RRMS and secondary progressive MS, but not in CIS. The authors explained the inconsistency of these results with earlier cross-sectional studies by an “early-rise late-decline” mechanism that would have caused patient groups with an average age of less than 40 years to exhibit iron increase, while older groups with older mean age would exhibit an iron decrease. Inline with this hypothesis, iron decrease was most frequently observed in the TH of RRMS over 5 years in this study, and over 2 years in a previous study [1]. In both cases, the mean group age was close to 40 (35.6 ± 8.0 and 35.2 ± 7.8, respectively). , significant group*time interaction of TH atrophy combined with DARE iron decrease results agrees with Schweser's hypothesis [12] for the role of “bystander damage of chronic inflammation” on the local DGM availability of iron.
The positive relationship between MSSS and CN R2* iron decrease is in agreement with an earlier 4-year longitudinal study [13] that found higher R2 values indicative of increased iron levels at baseline to be directly proportional to disability.
Conclusions
In conclusion, thalamus shrinkage rates and caudate nucleus and globus pallidus iron decrease rates were significantly different in RRMS compared to controls over 5 years. Iron decrease rates correlated with disease severity and duration in the caudate and globus pallidus, respectively.Acknowledgements
Contract grant sponsor: Canadian Institutes of Health Research; Contract grant sponsor: Multiple Sclerosis Society of CanadaReferences
[1] Elkady AM, Cobzas D, Sun H, et al. Discriminative analysis of regional evolution of iron and myelin/calcium in deep gray matter of multiple sclerosis and healthy subjects. Journal of Magnetic Resonance Imaging 2018.
[2] Cobzas D, Sun H, Walsh AJ, et al. Subcortical gray matter segmentation and voxel-based analysis using transverse relaxation and quantitative susceptibility mapping with application to multiple sclerosis. J Magn Reson Imaging 2015; 42: 1601-10.
[3] Du YP, Jin Z, Hu Y, Tanabe J. Multi-echo acquisition of MR angiographyand venography of the brain at 3 Tesla. J Magn Reson Imaging2009;30:449–454.
[4] Smith SM. Fast robust automated brain extraction. Hum Brain Mapp 2002; 17: 143-155.
[5] Jenkinson M. Fast, automated, N-dimensional phase-unwrapping algorithm. Magn Reson Med 2003; 49: 193-197.
[6] Sun H and Wilman AH. Background field removal using spherical mean value filtering and Tikhonov regularization. Magn Reson Med 2013. DOI: 10.1002/mrm.24765 [doi].
[7] Bilgic B, Pfefferbaum A, Rohlfing T, et al. MRI estimates of brain iron concentration in normal aging using quantitative susceptibility mapping. Neuroimage 2012; 59: 2625-2635.
[8] Walsh AJ, Blevins G, Lebel RM, et al. Longitudinal MR imaging of iron in multiple sclerosis: an imaging marker of disease. Radiology 2014. DOI: 10.1148/radiol.13130474 [doi].
[9] Hagemeier J, Zivadinov R, Dwyer MG, et al. Changes of deep gray matter magnetic susceptibility over 2 years in multiple sclerosis and healthy control brain. NeuroImage: Clinical 2018; 18: 1007-1016.
[10] Khalil M, Langkammer C, Pichler A, et al. Dynamics of brain iron levels in multiple sclerosis: A longitudinal 3T MRI study. Neurology 2015; 84: 2396-2402.
[11] Hernández-Torres E, Wiggermann V, Li DK, et al. Iron loss occurs in the deep gray matter of multiple sclerosis patients. In: Proc. Intl Soc. Mag. Reson Med., Hawaii, 2017, pp.790.
[12] Schweser F, Martins, Ana Luiza Raffaini Duarte, Hagemeier J, et al. Mapping of thalamic magnetic susceptibility in multiple sclerosis indicates decreasing iron with disease duration: A proposed mechanistic relationship between inflammation and oligodendrocyte vitality. Neuroimage 2018; 167: 438-452.
[13] Neema M, Arora A, Healy BC, et al. Deep gray matter
involvement on brain MRI scans is associated with clinical progression in
multiple sclerosis. Journal of Neuroimaging 2009; 19: 3-8.
Figures