3154
Connectomics of Brain Demyelination in Multiple Sclerosis1Department of Biomedical Engineering, McConnell Brain Imaging Centre, Montreal Neurological Institute and Hospital, McGill University, Montreal, QC, Canada, 2Department of Neurology and Neurosurgery, McConnell Brain Imaging Centre, Montreal Neurological Institute and Hospital, McGill University, Montreal, QC, Canada, 3Department of Medical Biophysics, Centre for Functional and Metabolic Mapping, Western University, London, ON, Canada
Synopsis
Resting-state connectivity alterations associated with demyelination and neurodegeneration occur in multiple sclerosis, but the specific network connections that are affected are not well understood. Moreover, temporal alterations in these networks across MS patient lifespan and MS phenotype have not been robustly characterized. In this study, we sought to isolate the influence of MS phenotype on resting-state functional connectivity in a cohort of early and later stage MS patients imaged using 7 T MRI. Through single-subject ICA denoising, followed by group-level connectivity matrix analysis with partial-least squares methods, we evaluated group level differences in 7 T resting-state connectivity between MS phenotypes.
Introduction
Multiple Sclerosis (MS) is an autoimmune-related disease that affects the central nervous system and is characterized by demyelination, axonal loss and neurodegeneration. In the current study, we used 7-T resting state fMRI (rsfMRI) connectivity analysis to examine alterations in network-level properties of secondary-progressive (SP) and relapsing-remitting (RR) patients compared to age/gender-matched control subjects. Resting state networks, characterized by several highly active regions1, may be useful indicators of MS pathology that are not captured using traditional structural MRI measures. Functional connectivity (FC) measures exhibit both compensatory increases and detrimental decreases during the course of MS. In later stage, SPMS subjects, rsfMRI studies have demonstrated prominent decreased connectivity in sensory-motor and default mode connectivity2.Methods
RsfMRI data was collected as part of an ongoing study of cortical pathology in MS being conducted jointly between McGill University and Western University. Our study includes a sub-set of 12 healthy controls (HC), 9 RRMS, and 12 SPMS subjects. Each patient underwent a 7-T human MRI scan on the Siemens MAGNETOM MRI system at the Centre for Functional and Metabolic Mapping in London, Ontario. For each subject, T1-weighted, whole-brain structural images were collected with 0.7 mm3 isotropic spatial resolution using the MP2RAGE sequence. Corresponding rsFMRI data (480 image volumes) were collected for each subject using an imaging spatial resolution of 2 mm3, TR of 1.25 seconds, TE of 18 ms, multi-band acceleration factor of 2 and GRAPPA acceleration factor of 3 along the first phase encode direction. rsFMRI data was collected over the course of a 10-minute period.
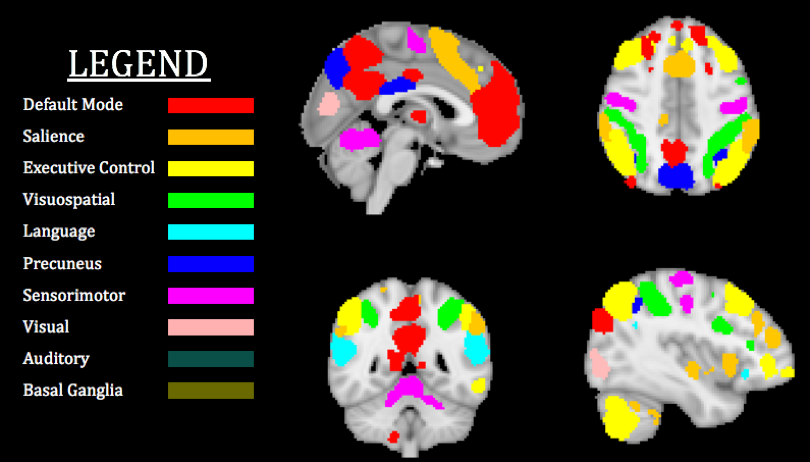
For each patient, rsfMRI data was registered to the corresponding high resolution T1-weighted structural image, followed by a second registration step to the Montreal Neurological Institute 2 mm3 template (MNI152)3. Subject-level independent component analysis (ICA) using the FSL MELODIC tool was applied to separate rsFMRI data into 50 components. These components were manually classified into signal and noise. Single-subject data were temporally concatenated to perform group-level ICA with FSL MELODIC. Next, filtered single-subject data were classified using region of interest masks derived from the Stanford FIND Lab atlas4. The FIND Lab atlas consists of 90 individual ROIs spanning 10 resting state networks (Figure 1), from which 63 were used for the analysis. A 63x63 connectivity matrix was generated for each subject. Global differences in network connectivity were evaluated, using a partial least squares (PLS) approach. More specifically, PLS was applied with grouping variables for subject phenotype (HC, RR or SP). PLS was performed at the group-level and to spatially-resolved rsFMRI networks. Hypothesis testing was carried-out with 5000 random permutations.
Results
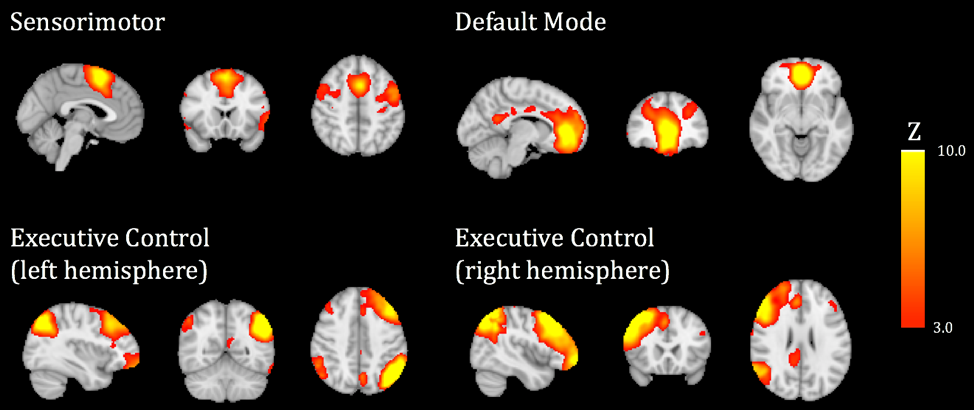
Group level ICA was applied to denoised rsFMRI time-series data to identify 25 independent components shared between subjects enrolled in our study. Representative networks derived from Group ICA are displayed in Figure 2. The spatial localization of network activation corresponds closely with existing ROIs defined based on the Stanford FIND Lab atlas.
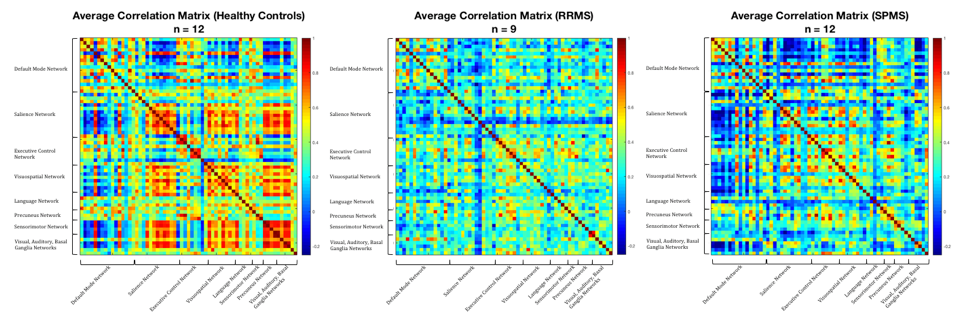
Figure 3 visually identifies regions of overall decrease in FC in RRMS and SPMS subjects relative to HCs. High levels of connectivity between and within the salience, visuospatial, sensorimotor and basal-ganglia networks of HC subjects are not observed in the RRMS and SPMS groups.
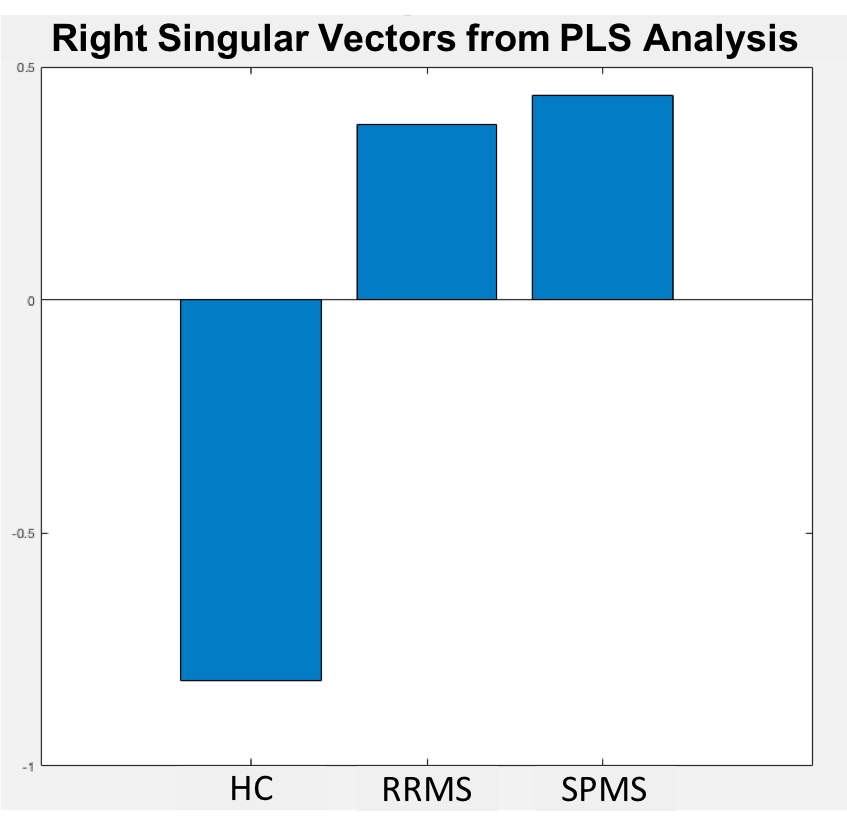
PLS singular value decomposition (SVD) was applied to the three connectivity matrices shown in Fig 3 to produce right singular vectors. The singular vectors represent the correlation of each phenotype with its corresponding FC pattern (Figure 4). The spatially-distributed pattern of rsFMRI signal in RRMS and SPMS subjects is opposite to that of HCs. Further analysis of singular values with 5000 permutations/bootstrap iterations yielded an overall p-value of 0.067 for direct comparison of the MS phenotype to HCs.
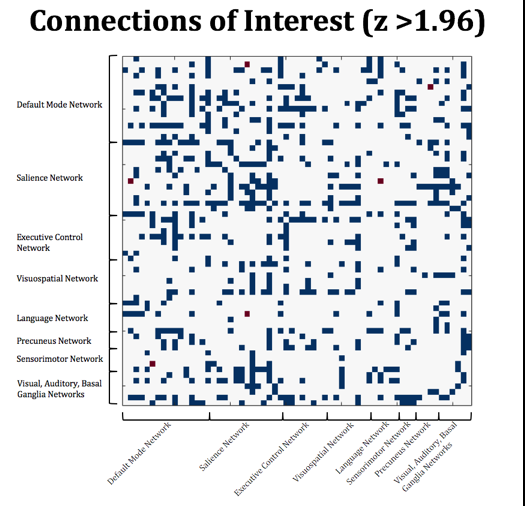
The singular value comparison serves as a measure of overall rsFMRI connectivity loss in MS subjects compared to controls. We examined specific node-level, network alterations between groups using a two-sample t-test with thresholding at the 95% confidence level as shown in Figure 5. In particular, figure 5 shows connections with the greatest overall decreases in RRMS and SPMS groups compared to HCs. Clusters of decreased connectivity are observed within the salience network and between the executive control and principal default mode network.
Discussion and Conclusions
Our results suggest the existence of specific resting state network alterations in MS (particularly in the SP phenotype) can be globally identified using ICA denoising, atlas-decomposition of rsFMRI networks and subsequent PLS analysis at the group level. All reductions of connectivity strength observed in our study are relative to the connectivity of healthy control groups. Overall, PLS shows promise for tracking network connectivity degradation particularly exhibited in later stage MS.Acknowledgements
No acknowledgement found.References
1. Raichle, M.E., The brain's default mode network. Annu Rev Neurosci, 2015. 38: p. 433-47. 2.
2. Peterson, D.S. and B.W. Fling, How changes in brain activity and connectivity are associated with motor performance in people with MS. Neuroimage Clin, 2018. 17: p. 153-162.
3. Jenkinson, M. FSL MELODIC. 2013; Available from: https://fsl.fmrib.ox.ac.uk/fsl/fslwiki/MELODIC.
4. Greicius, M., M.D. Functional Imaging in Neuropsychiatric Disorders Lab Functional ROIs. 2018; Available from: https://findlab.stanford.edu/functional_ROIs.html.
Figures