3152
Structural and functional damage of the sensorimotor network contribute to predict disability progression and phenotype evolution in patients with multiple sclerosis: a 6.5-year follow-up studyMassimo Filippi1,2, Loredana Storelli1, Alessandro Meani1, Chiara Cervellin1, Paola Valsasina1, Claudio Cordani1, Elisabetta Pagani1, Paolo Preziosa1,2, and Maria A. Rocca1,2
1Neuroimaging Research Unit, Institute of Experimental Neurology, Division of Neuroscience, San Raffaele Scientific Institute, Vita-Salute San Raffaele University, Milan, Italy, 2Department of Neurology, Institute of Experimental Neurology, Division of Neuroscience, San Raffaele Scientific Institute, Vita-Salute San Raffaele University, Milan, Italy
Synopsis
Multiple sclerosis (MS) is a complex disease, characterized by a highly heterogeneous disease evolution. The prognostic value of magnetic resonance imaging (MRI) in clinically definite MS is still debated. The aim of this study was to find possible structural and functional MR imaging prognostic biomarkers able to guide treatment decisions in MS disease course. The analysis of structural and functional MRI networks was able to improve our understanding of the extreme variability in MS and allowed prognosis prediction at an individual level.
Introduction
In patients with definite multiple sclerosis (MS), no reliable markers to predict medium- and long-term disease evolution are currently available. The analysis of brain structural and functional network architecture might improve the prediction of long-term MS prognosis. The aim of this study was to assess the value of structural and functional network magnetic resonance imaging (MRI) measures in predicting clinical deterioration over a 6.5-year follow-up in patients with MS.Methods
Conventional, 3D T1-weighted, diffusion-weighted MRI and resting state (RS) fMRI scans were obtained at baseline from 233 MS patients and 77 healthy controls. All patients underwent a neurologic evaluation at baseline and after a median follow-up of 6.5 years. At follow-up, patients were classified as clinically stable or worsened according to Expanded Disability Status Scale (EDSS) score change. In relapsing-remitting (RR) MS, conversion to secondary progressive (SP) MS was also evaluated. Spatial independent component analysis was applied to RS fMRI data to derive the main large-scale RS functional connectivity (FC) networks, as well as to grey matter (GM) probability maps and fractional anisotropy maps, to identify the corresponding structural GM and white matter networks.Results
At follow-up, 105/233 (45%) MS patients showed significant EDSS worsening and 26/157 (16%) RRMS patients evolved to SPMS. The multivariable model, adjusted for follow-up duration, identified baseline EDSS (odds ratio [OR]=1.59, p<0.001), normalized GM volume (OR=0.99, p=0.001) and abnormally high baseline RS FC of the left precentral gyrus in the sensorimotor network (OR=1.67, p=0.03, Figure 1) as predictors of EDSS worsening (C-index=0.80, Figure 2). Such variables survived also when adjusting for treatment effect (Figure 3). Baseline EDSS (OR=2.8, p<0.001) and atrophy of GM networks associated with sensory (OR=0.5, p=0.01) and motor (OR=0.4, p=0.03) functions were independent variables associated with conversion to SPMS (C-index=0.89, Figure 4).Discussion
In this study, we found that statistical models including clinical variables, conventional MRI metrics, as well as structural and functional measures of sensorimotor network damage were accurate in predicting which patients with MS had a disability worsening or an evolution to a more severe phenotype over a six-year follow-up period.Conclusions
Structural and functional network measures improved the prediction of long-term clinical worsening in MS patients. The identification of biomarkers able to predict disease worsening is of paramount importance to optimize patients’ treatments in MS.Acknowledgements
Partially supported by grants from Fondazione Italiana Sclerosi Multipla (FISM2018/S/3).References
No reference found.Figures
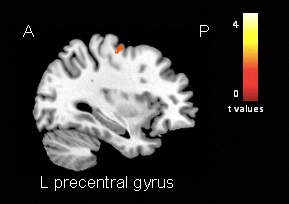
Figure 1. Increased resting-state (RS)
functional connectivity (FC) in MS patients vs HCs in the sensorimotor
network. Abbreviations: A=anterior; P=posterior.
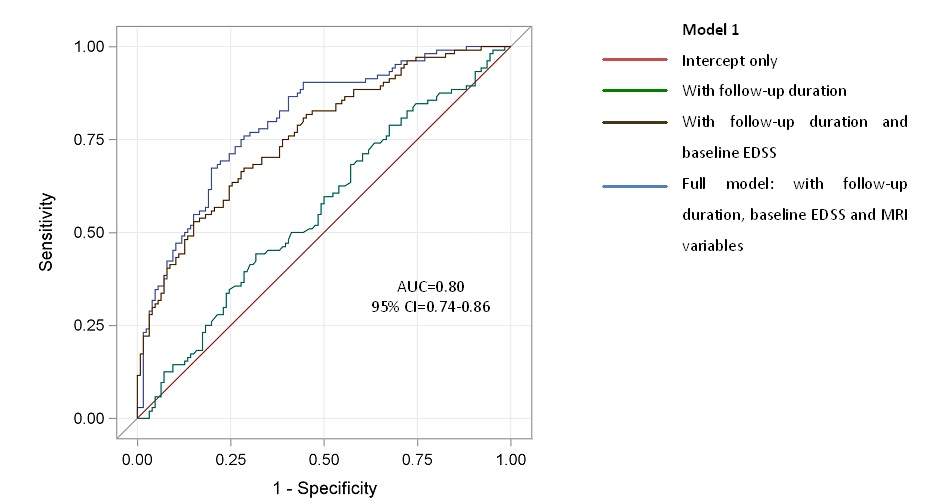
Figure 2. Model 1 for disability
worsening, including follow-up as covariate.
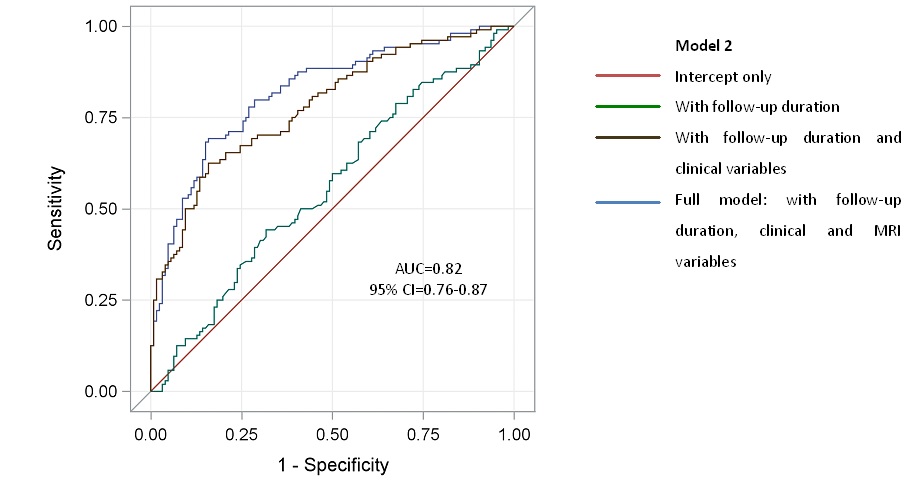
Figure 3. Model 2 for disability
worsening, adjusting for follow-up duration and pharmacological treatment
effect.
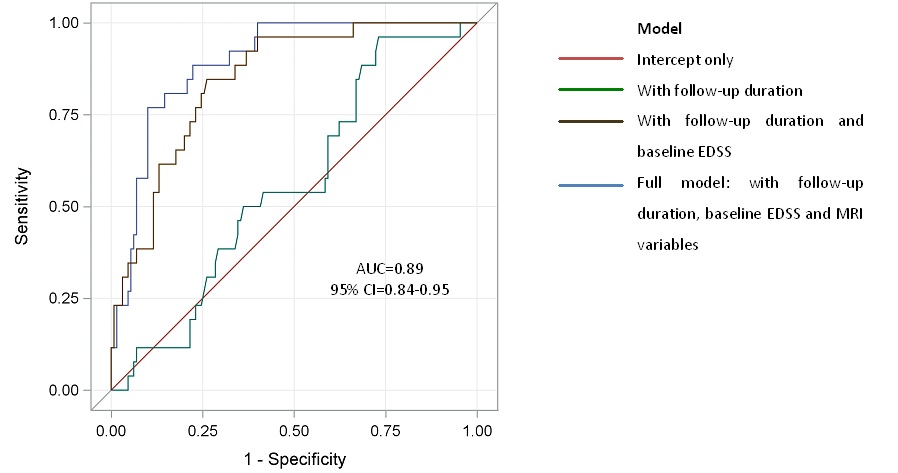
Figure 4. Model for conversion to
secondary progressive (SP) MS in relapsing MS patients, adjusted for follow-up
duration.