3148
Relevance of cortical and subcortical integrity in cognitive performance in Relapsing-Remitting Multiple Sclerosis patients.1Biomedical Imaging Center, Pontificia Universidad Católica de Chile, Santiago, Chile, 2Radiology Department, School of Medicine, Pontificia Universidad Católica de Chile, Santiago, Chile, 3Millennium Nucleus for Cardiovascular Magnetic Resonance, Santiago, Chile, 4Institute of Cognitive Neuroscience., University College London, London, UK., London, United Kingdom, 5Interdisciplinary Center of Neurosciences, School of Medicine, Pontificia Universidad Católica de Chile, Santiago, Chile, 6Faculty of Engineering, University of Concepción, Concepción, Chile, 7Université Paris-Saclay, Paris, France, 8Neurology Department, School of Medicine, Pontificia Universidad Católica de Chile, Santiago, Chile, 9Neurology Service, Hospital Dr. Sótero del Río, Santiago, Chile, 10Electrical Engineering, Pontificia Universidad Católica de Chile, Santiago, Chile, 11Interdisciplinary Center of Neurosciences, Pontificia Universidad Católica de Chile, Santiago, Chile
Synopsis
In this work, we evaluated if structural characteristics of cortical regions and the U-fibers connected to these regions allows predicting multiple sclerosis patients’ score in FAS, SDMT and PASAT tests. For this purpose, we represented structural characteristics as the proportion of the regions and fibers covered by
Introduction
Multiple sclerosis (MS) patients develop measurable cognitive declines since the earliest stages of the disease, with significant changes in cortical recruitment related to cognitive tasks (1,2). Different tests have been developed to assess these disabilities. The FAS test measures word fluency; the symbol digit modalities test (SDMT) assess attention and visual and motor speed; and the Paced Auditory Serial Addition Test (PASAT) evaluates information processing and attention capacity (3). Magnetic resonance imaging (MRI) is also useful for the diagnosis of the disease and follow up (4). However, traditional imaging findings do not correlate strongly with patients' clinical symptoms. (5-7). Furthermore, the relation between clinical tests and structural changes found in the MRI along the disease progression is not well understood.
We evaluated if the structural characteristics of cortical regions that have been reported to relate to the corresponding test and U-fibers that connected to these regions allow predicting the score in the clinical tests. To test this hypothesis, we represented structural characteristics as: (i) proportion of the regions and U-fibers covered by lesion and (ii) the average of its fractional anisotropy (FA).
Material and Methods
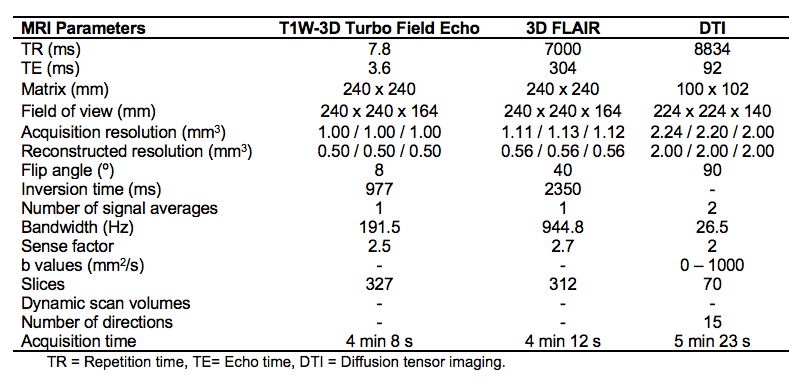
Forty-five relapsing-remitting multiple sclerosis patients (20 males with mean age 35 years old, range, 21-50 years old; 25 females with mean age 38 years, range 22-63 years old) were diagnosed according to McDonald’s Criteria (4) and scanned on a 3T MRI scanner (Philips Ingenia, Best, Netherlands). Diffusion weighted images were acquired to calculate FA maps through Diffusion Tensor Imaging (DTI). T1 and T2 weighted images were acquired as anatomical reference and to measure lesions, respectively. MRI acquisition parameters are summarized in Table 1. All subjects had at least 13 years of education and did not have any MR-incompatible implants. Patients were evaluated using FAS, SDMT and PASAT. The study was approved by the local ethics committee.
FA maps were calculated using DSI Studio (http://dsi-studio.labsolver.org). The resulting maps were then coregistered with the T1 weighted images and normalized to the MNI space using SPM12 (http://www.fil.ion.ucl.ac.uk/spm/software/spm12/).
Results
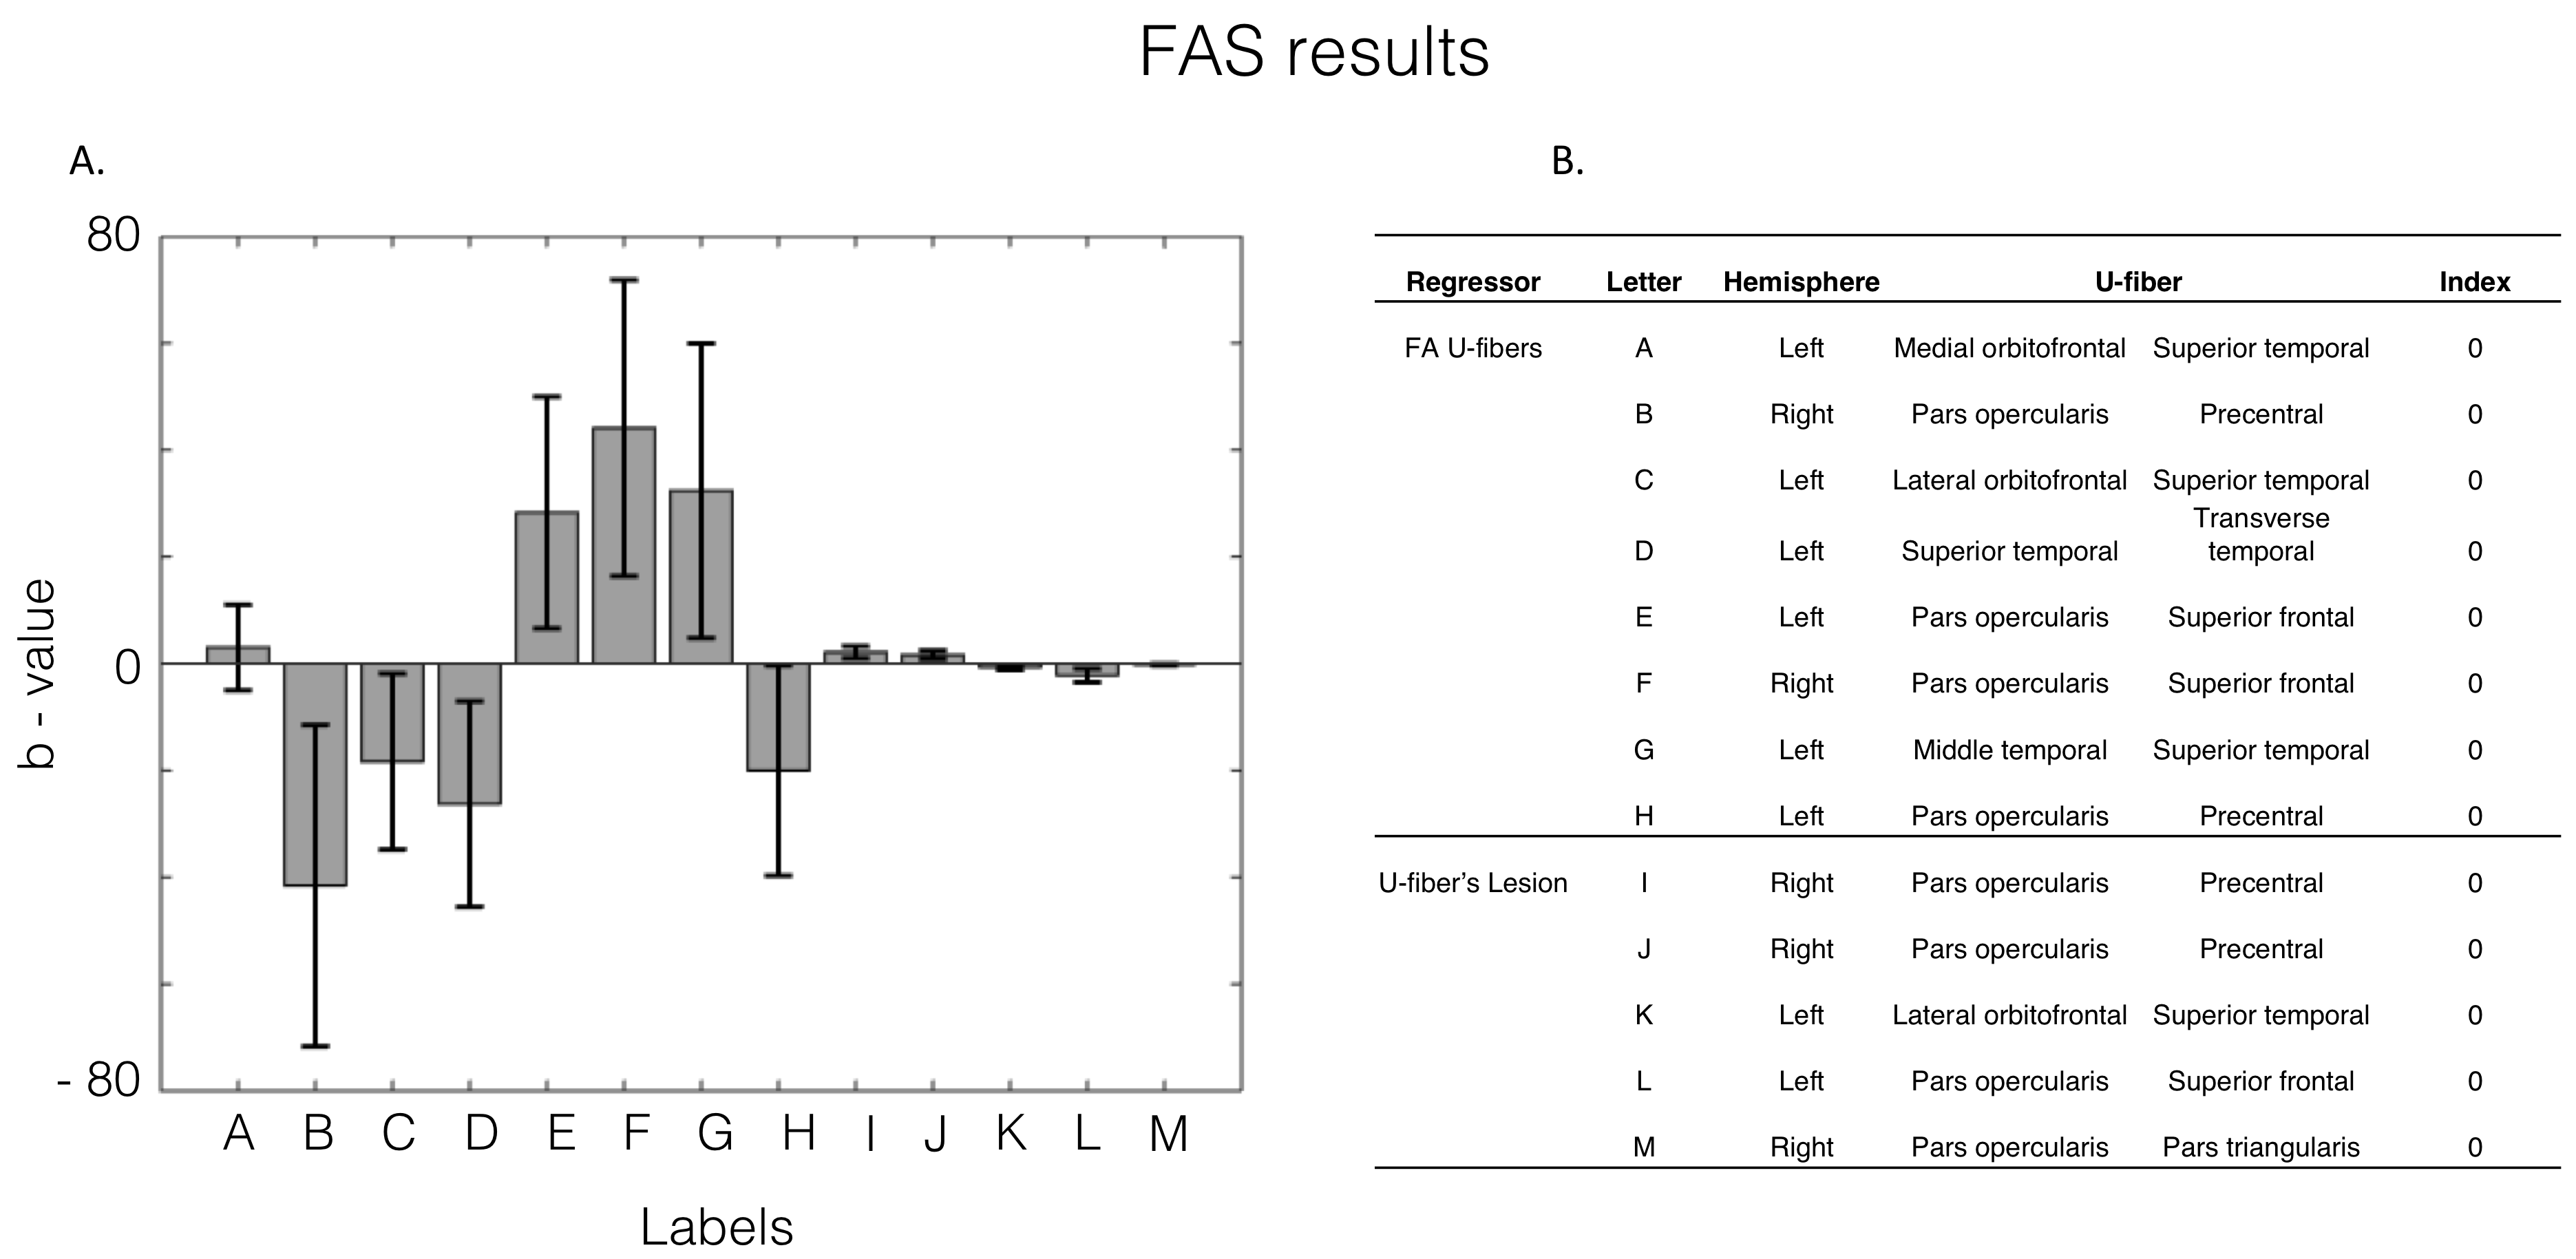
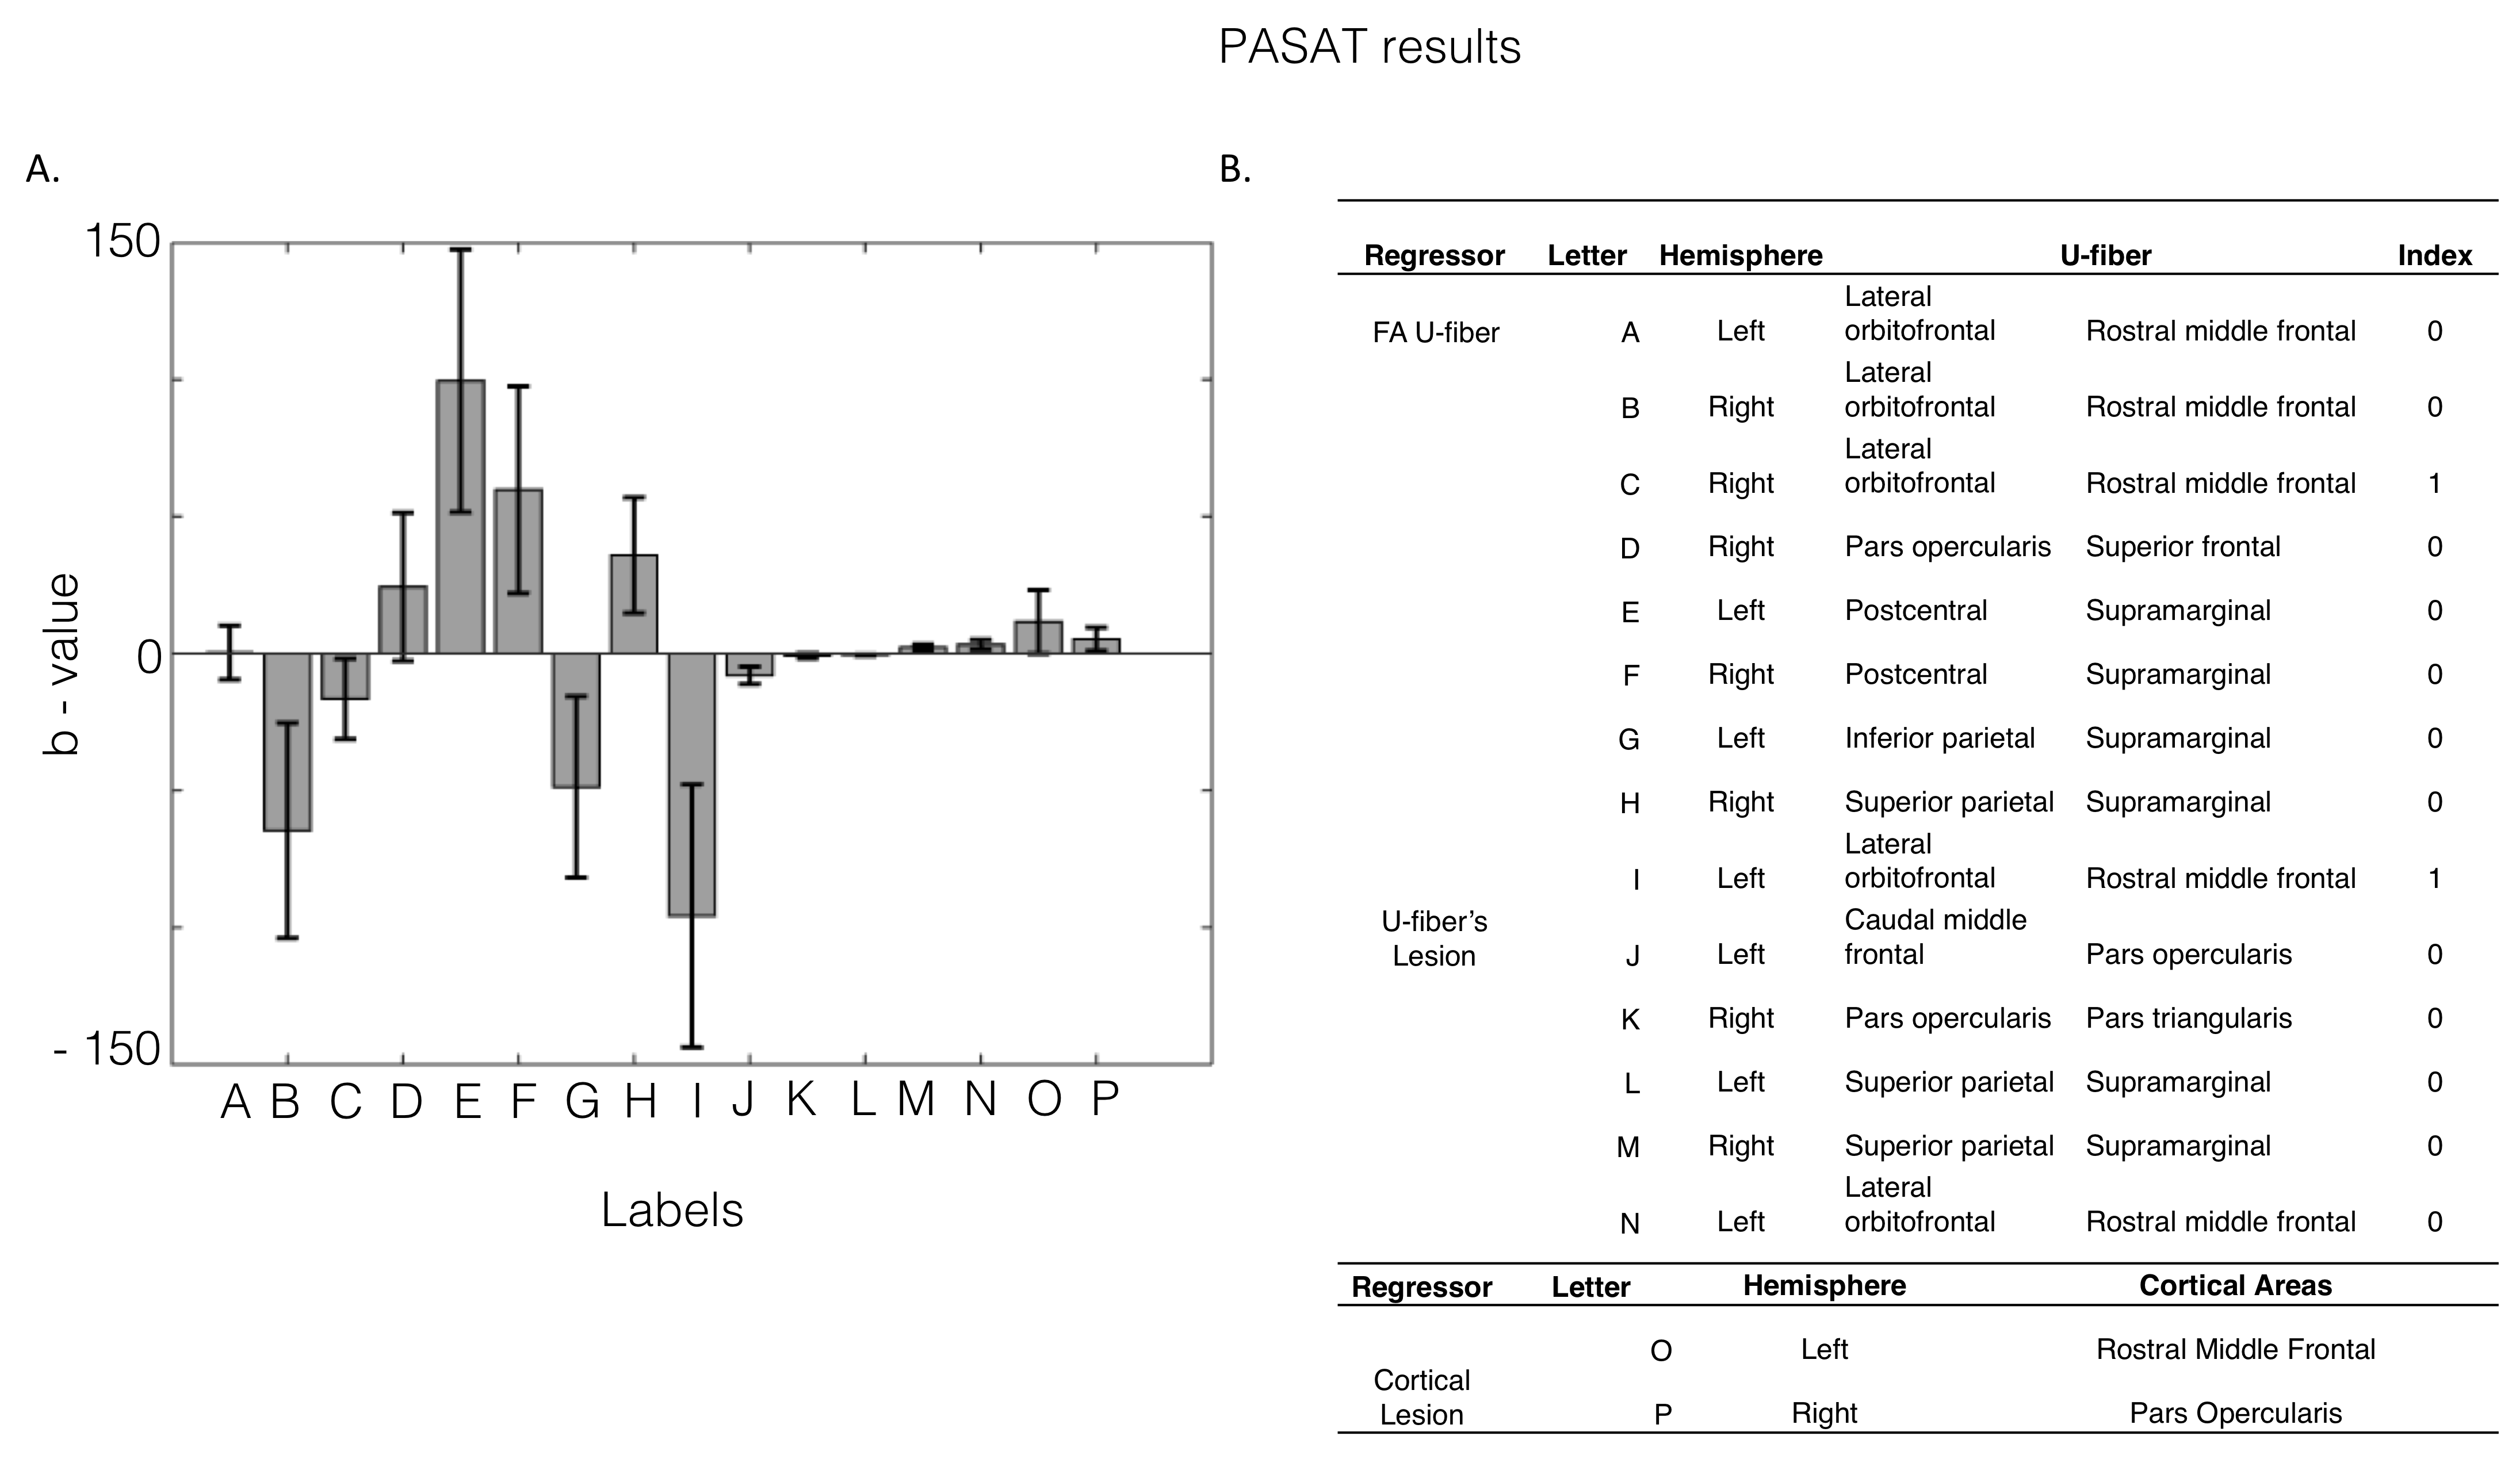
The resulting regressions presented a R2 score of 0.562, 0.661 and 0.5 for the FAS, PASAT and SDMT predictors, respectively. Figures 1 and 2 show the statistically significant (p<0.05) beta values of the regressions predicting the FAS and PASAT test results respectively. FAS test score significantly correlated with structural damage in U-fibers from Frontal and Temporal lobes. PASAT test score significantly correlated with structural damage in U-fibers in the Frontal and Parietal lobes. No significant correlations were found for SDMT.Discussion and Conclusion
The results presented in this study show that there is a correlation between structural indicators of U-fibers and cognitive performance of MS patients. The U-fibers that correlated the most with verbal fluency performance connect the right Pars opercularis with the Precentral gyrus and the right Pars opercularis with the Superior frontal gyrus. Whereas the fibers connecting the left Postcentral with the Supramarginal gyrus and left lateral Orbitofrontal cortex with the rostral middle frontal gyrus were found to strongly correlate with information processing speed and attention capacities.
The statistically significant coefficients found are potential biomarkers that might help to predict cognitive performance in early stages of MS. Therefore contributing to a better understanding of how this disease is affecting the brain and indicating that there is a direct effect on function caused by structural damage. Future work should include a deeper analysis on the effects of structural indicators on cognitive performance, for instance, incorporating the fractional anisotropy variability within the U-fibers.
Acknowledgements
This research was supported by of Comisión Nacional de Investigación Científica y Tecnológica de Chile (CONICYT) through CONICYT-PIA Anillo ACT1416 and by the Millennium Science Initiative of the Ministry of Economy, Development and Tourism, grant Nucleus for Cardiovascular Magnetic Resonance.References
1. Audoin B, Au Duong MV, Ranjeva JP, et al. Magnetic resonance study of the influence of tissue damage and cortical reorganization on PASAT performance at the earliest stage of multiple sclerosis. Hum Brain Mapp. 2005 Mar;24(3):216-28.
2. Audoin B, Ranjeva JP, Au Duong MV, et al. Voxel-based analysis of MTR images: a method to locate gray matter abnormalities in patients at the earliest stage of multiple sclerosis.J Magn Reson Imaging. 2004 Nov;20(5):765-71.
3. Baysal Kıraç L, Ekmekçi Ö, Yüceyar N, et al. Assessment of early cognitive impairment in patients with clinically isolated syndromes and multiple sclerosis. Behav Neurol. 2014;2014:637694.
4. Polman CH, Reingold SC, Banwell B, et al. Diagnostic criteria for multiple sclerosis: 2010 revisions to the McDonald criteria. Ann Neurol. 2011 Feb;69(2):292-302.
5. M. Filippi, F. Agosta. Imaging biomarkers in multiple sclerosis. J. Magn. Reson. Imaging, 31 (4) (2010), pp. 770-788,
6. L. Fu, P.M. Matthews, N. De Stefano, et al. Arnold. Imaging axonal damage of normal-appearing white matter in multiple sclerosis Brain, 121 (1) (1998), pp. 103-113,
7. D. Mollison, R. Sellar, M. Bastin,et al. The clinico-radiological paradox of cognitive function and MRI burden of white matter lesions in people with multiple sclerosis: a systematic review and meta-analysis. PLoS One, 12 (5) (2017), Article e0177727,
8. Schmidt P, Gaser C, Arsic M, et al. An automated tool for detection of FLAIR-hyperintense white-matter lesions in Multiple Sclerosis. Neuroimage. 2012 Feb 15;59(4):3774-83.
9. Guevara M, Román C, Houenou J, et al. Reproducibility of superficial white matter tracts using diffusion-weighted imaging tractography. Neuroimage. 2017 Feb 15;147:703-725.
Figures