3147
Evaluating brain oxygen metabolism and cognition in multiple sclerosis1Behavioral and Brain Sciences, University of Texas at Dallas, Dallas, TX, United States, 2Neurology, University of Texas Southwestern, Dallas, TX, United States, 3Radiology, Johns Hopkins University, Baltimore, MD, United States
Synopsis
We used phase contrast (PC) and T2-Relaxation-Under-Spin-Tagging (TRUST) to evaluate whole brain cerebral metabolic rate of oxygen (CMRO2) in MS patients and healthy controls. We compared CMRO2 with cognitive performance and diffusion kurtosis imaging. CMRO2 correlates negatively with cognitive function in MS patients, suggesting a marker of ongoing disease activity leading to cognitive decline.
Introduction
Multiple Sclerosis (MS) is an immune-mediated, demyelinating disease of the central nervous system. Approximately 85% of MS patients (MSP) present with relapsing-remitting disease course (RRMS) resulting in recurrent and reversible neurological deficits. Cognitive dysfunction, namely processing speed, occurs in ~50% of MSP1, but the cause of this slowing remains unknown. Global cerebral metabolic rate of oxygen (CMRO2), a measure of oxygen metabolism throughout the brain, reflects resting cellular activity. Previous work in MS has shown a decline in CMRO2 with increasing lesion volume and physical disability. However, the relationship of CMRO2 decline to cognition is unknown. Understanding this relationship between CMRO2 and cognitive performance could provide new insights into the pathophysiology of MS cognitive decline and indicate a clinically feasible biomarker.Methods
We performed a cross-sectional study comparing 31 RRMS MSP and 11 age- and sex-matched healthy controls (HC). All MRI scans (Fig 1) were conducted on a Philips 3T MRI system with a 32-channel head coil. T2-Relaxation-Under-Spin-Tagging (TRUST2) was acquired to assess venous oxygenation (Yv) and phase contrast (PC) MRI was acquired to estimate whole-brain cerebral blood flow (CBF). Diffusion Kurtosis Imaging (DKI) was acquired to assess white matter microstructure (WMMS) integrity and T2-FLAIR was used to assess RRMS lesion volume. High resolution MPRAGE was acquired for co-registration and atrophy estimates. Participants also underwent neuropsychological evaluation including expanded disability status scale (EDSS), Beck Depression Index (BDI-II), Modified Faitigue Index scales (MFIS) and Symbol-Digit-Modalities Test (SDMT), a standard assessment of cognitive performance in MS. Higher SDMT scores indicate better performance.
TRUST and PC images were analyzed using in-house MATLAB code to obtain CMRO2. Multi-echo TRUST provided estimates of T2 in the superior sagittal sinus venous blood, directly related to Yv via 1/T2 = A + B·(1-Yv) + C·(1-Yv)2 , where A=6.80/s, B=0.38/s, and C=60.3/s for macrovascular hematocrit=0.422,3. PC magnitude images were manually segmented to obtain the area of the superior sagittal sinus and the mask was applied to phase images to obtain CBF. To obtain whole brain CBF (mL/100g/min), CBF was divided by gray matter (GM) + white matter (WM) volume (brain parenchyma volume; from MPRAGE). Using Yv and CBF, baseline CMRO2 = CBF · (Ya - Yv) · Ca, where Ya = arterial O2 saturation from pulse-oximeter and Ca=833.7 μmol O2/100mL blood4,5. Lesion volume was calculated from T2-FLAIR images with lesion prediction algorithm in Lesion Segmentation Toolbox (LST v2.0.156). The GM, WM, and intracranial volumes (ICV) were estimated from MPRAGE using Freesurfer to estimate brain atrophy as brain parenchymal fraction (BPF = [GM+WM]/ICV]7). DKI images were corrected for eddy-current distortions and motion (FSL EDDY tool) and co-registered to MPRAGE. Diffusion Kurtosis Estimator (DKE) software was used to obtain estimates of kurtosis parameters8. White Matter Tract Integrity (WMTI) metrics were estimated using the DK tensor and in-house Matlab code9. All DKI parameter maps were aligned to whole-brain skeletons using Tract-Based Spatial Statistics (TBSS10) yielding metrics of WMMS integrity. MSP were divided into cognitively intact ( >[SDMTHC,mean- SDMTHC,std]) and cognitively impaired (< [SDMTHC,mean- SDMTHC,std]). Group comparisons were conducted via independent-sample two-tailed t-tests (p< 0.05) and associations were assessed using Spearman correlations.
Results
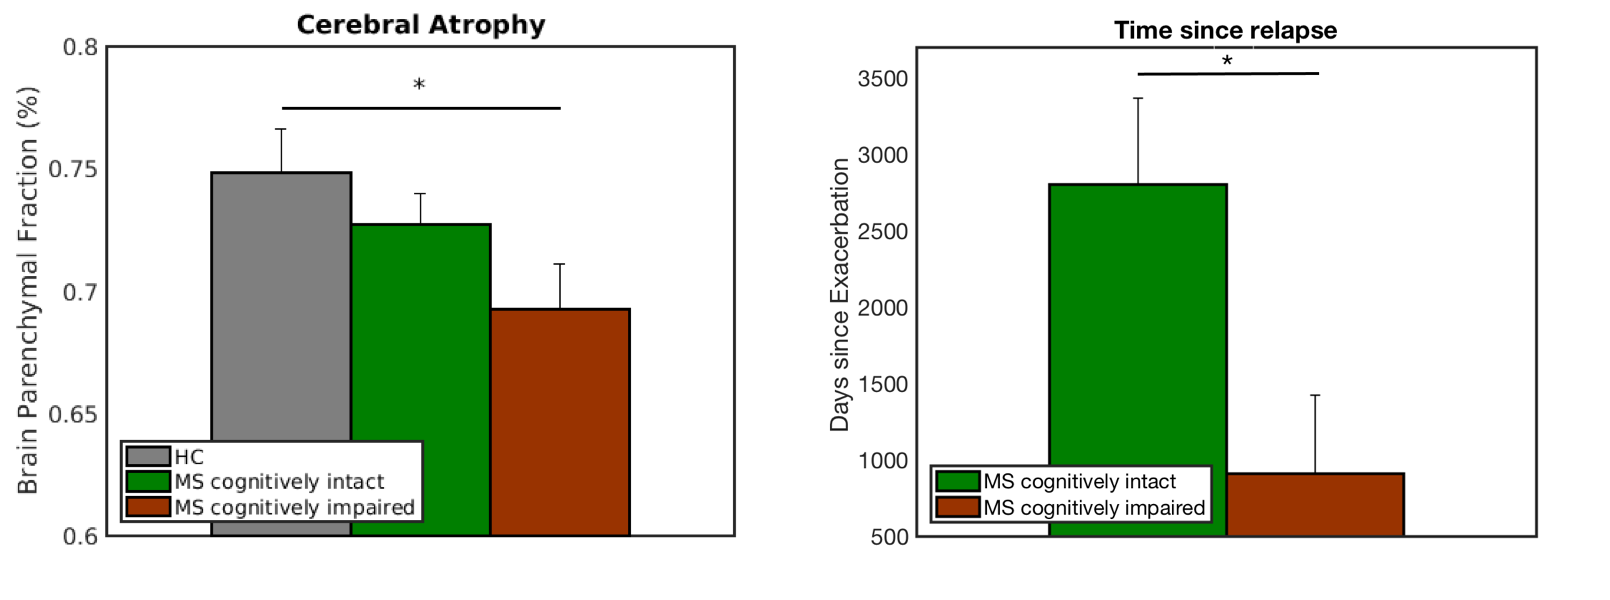
Fig 2A displays significant differences in SDMT scores between 13 impaired MSP (41.65 ± 9.53), 18 intact MSP (57.89 ± 4.31), and HC (59 ± 10.71). Intact MSP displayed reduced CMRO2 compared to HC, while impaired MSP had CMRO2 similar to HC (Fig 2B). CMRO2 correlated negatively with SDMT score in MSP (r = -0.35; Fig 2C) but not HC. Intact MSP had increased extra-axonal radial diffusivity (De,rad) compared to HC (p<0.05), whereas impaired MSP had increased De,rad and reduced axon water fraction (AWF) compared to intact MSP (p<0.01, 0.001) and HC (p<0.001; Fig 3). Atrophy (BPF) was increased in all MSP but moreso in impaired MSP compared to HC, and impaired MSP had a more recent relapse compared to intact MSP (Fig 4). Impaired MSP also had increased lesion volume compared to intact MSP but there were no differences in age, disease duration, EDSS, BDI, or MFIS.Discussion
Intact MSP displayed reduced CMRO2 with reduced De,rad and BPF but no difference in AWF, suggesting demyelination with some loss of glial cells but minimal axonal degradation. Lower CMRO2 in intact MSP likely reflects some cellular loss but minimal ongoing disease activity. Conversely, impaired MSP likely exhibit diffuse subclinical disease progression which would require increased oxygen metabolism by neural and glial cells, corroborated by more recent relapses compared to intact MSP.Conclusions
Resting CMRO2 may reflect on-going sub-clinical disease activity and possible progression of cognitive dysfunction in MSP. These relatively brief (eg, 1.5min) resting scans could clinically inform on treatment strategies for cognitive slowing.Acknowledgements
This work was supported by NMSS Grant No RG150704951.References
1. Chiaravalloti ND, DeLuca J. Cognitive impairment in multiple sclerosis. Lancet Neurol. 2008;7:1139–1151.
2. Lu H, Ge Y. Quantitative evaluation of oxygenation in venous vessels using T2-Relaxation-Under-Spin-Tagging MRI. Magn. Reson. Med. 2008;60:357–363.
3. Lu H, Xu F, Grgac K, Liu P, Qin Q, Van Zijl P. Calibration and validation of TRUST MRI for the estimation of cerebral blood oxygenation. Magn. Reson. Med. 2012;67:42–49.
4. Guyton A, Hall J. Respiration. In: Textbook of Medical Physiology. Elsevier; 2005.
5. Ge Y, Zhang Z, Lu H, Tang L, Jaggi H, Herbert J, Babb JS, Rusinek H, Grossman RI. Characterizing brain oxygen metabolism in patients with multiple sclerosis with T2-relaxation-under-spin-tagging MRI. J. Cereb. Blood Flow Metab. 2012;32:403–412.
6. Schmidt P. Bayesian inference for structured additive regression models for large-scale problems with applications to medical imaging. 2017.
7. Rudick RA, Fisher E, Lee J-C, Simon J, Jacobs L. Use of the brain parenchymal fraction to measure whole brain atrophy in relapsing-remitting MS. Neurology 1999;53:1698–1698.
8. Tabesh A, Jensen JH, Ardekani BA, Helpern JA. Estimation of tensors and tensor-derived measures in diffusional kurtosis imaging. Magn. Reson. Med. 2011;65:823–836.
9. Fieremans E, Jensen JH, Helpern JA. NeuroImage White matter characterization with diffusional kurtosis imaging. Neuroimage [Internet] 2011;58:177–188.
10. Smith SM, Johansen-Berg H, Jenkinson M, Rueckert D, Nichols TE, Klein JC, Robson MD, Jones DK, Behrens TEJ. Acquisition and voxelwise analysis of multi-subject diffusion data with tract-based spatial statistics. Nat. Protoc. 2007;2:499–503.
Figures

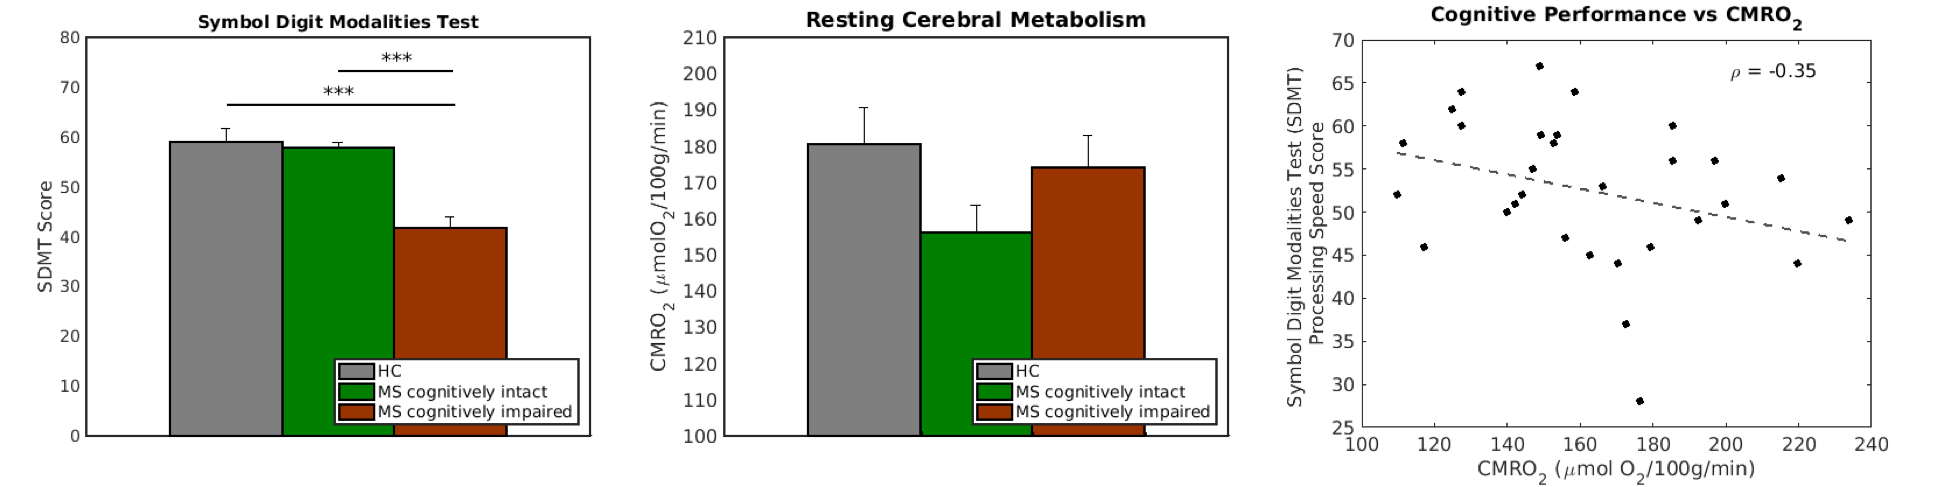
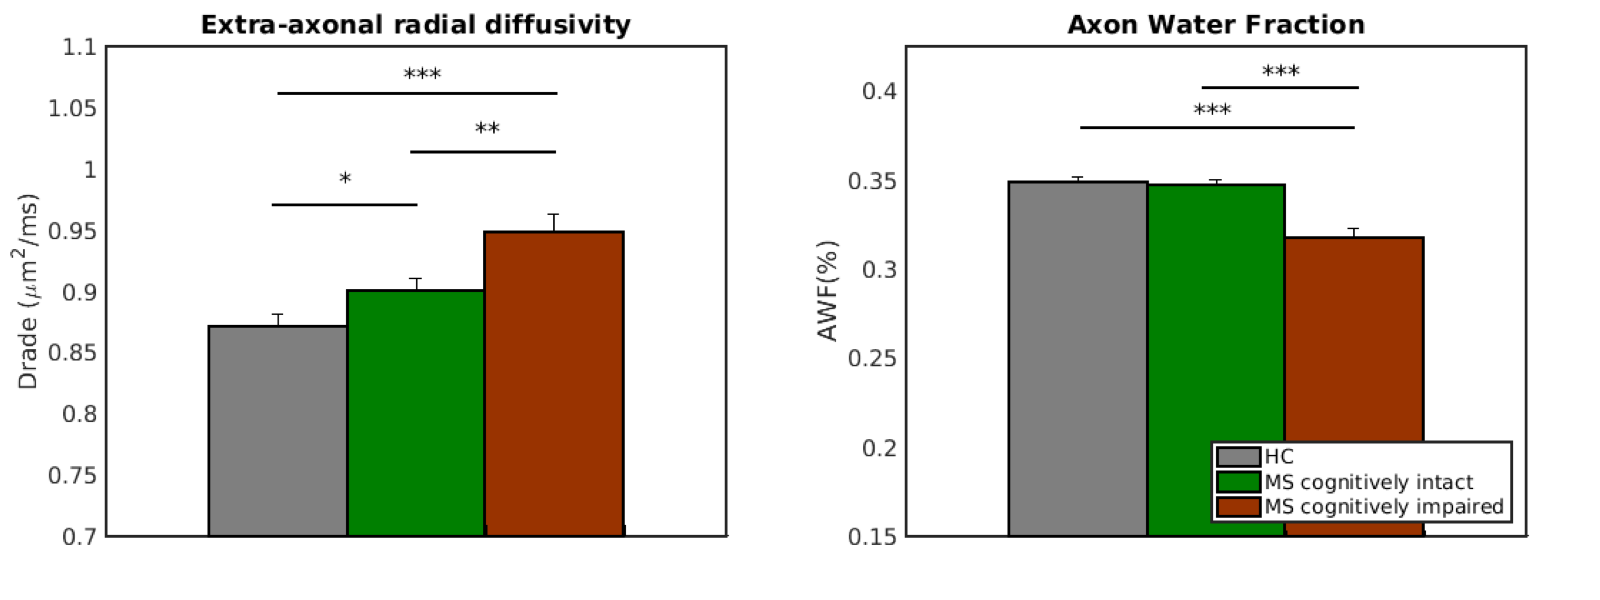
Figure 3. Diffusion Kurtosis Imaging WMTI parameters (left) extra-axonal radial diffusivity (Drade) and (right) axon water fraction (AWF) averaged across the white matter skeleton from (gray) healthy controls (HC), (green) cognitively intact MS patients (MSP), and (red) cognitively impaired MSP (* = p<0.05, ** = p<0.01, *** = p<0.001).