3146
Quantification of cerebral grey matter vascular and metabolic function in multiple sclerosis using dual-calibrated fMRI.1Cardiff University Brain Research Imaging Centre, Cardiff University, Cardiff, United Kingdom, 2Department of Physics, Concordia University, Montreal, QC, Canada, 3Division of Psychological Medicine and Clinical Neurosciences, School of Medicine, Cardiff University, Cardiff, United Kingdom, 4Helen Durham Centre for Neuroinflammation, University Hospital of Wales, Cardiff, United Kingdom
Synopsis
Dual-calibrated fMRI (dc-fMRI) relies on the simultaneous acquisition of BOLD and ASL during a respiratory challenge to quantitatively map cerebral blood flow (CBF), cerebral metabolic rate of oxygen (CMRO2), oxygen extraction fraction (OEF), cerebrovascular reactivity (CVR) and effective oxygen diffusivity (D). Here, we use this method to investigate alterations in brain physiology in patients with multiple sclerosis (and matched healthy participants), demonstrating significant reductions in CBF and CMRO2 per unit of remaining grey matter in patients. We suggest that this method not only provides novel markers of tissue dysfunction, it also extends the methodological armamentarium for non-invasive investigation of brain pathophysiology in disease.
Introduction/purpose
The development of advanced MRI methods to characterise and quantify the pathophysiological processes that underpin multiple sclerosis (MS) is critical for patient phenotypization and development of novel, tailored treatments.1 While structural MRI has revealed substantial, clinically relevant grey matter (GM) damage,2 it provides limited insight into the brain pathophysiology. Initial studies of vascular/metabolic function in MS suggest whole brain reductions in oxygen metabolism and cerebral blood flow.3 Here, we extend the investigation of brain physiology in MS by applying a multi-parametric dual-calibrated fMRI (dc-fMRI) method to detect pathophysiological changes in the inflamed brain, specifically in GM.4 We quantify relevant aspects of vascular/metabolic function including cerebral blood flow (CBF), cerebrovascular reactivity (CVR), oxygen extraction fraction (OEF) and cerebral metabolic rate of oxygen (CMRO2) across cortical and subcortical GM in MS patients. In addition, we tested, for the first time in disease, estimates of effective oxygen diffusivity (D) with this method.5Methods
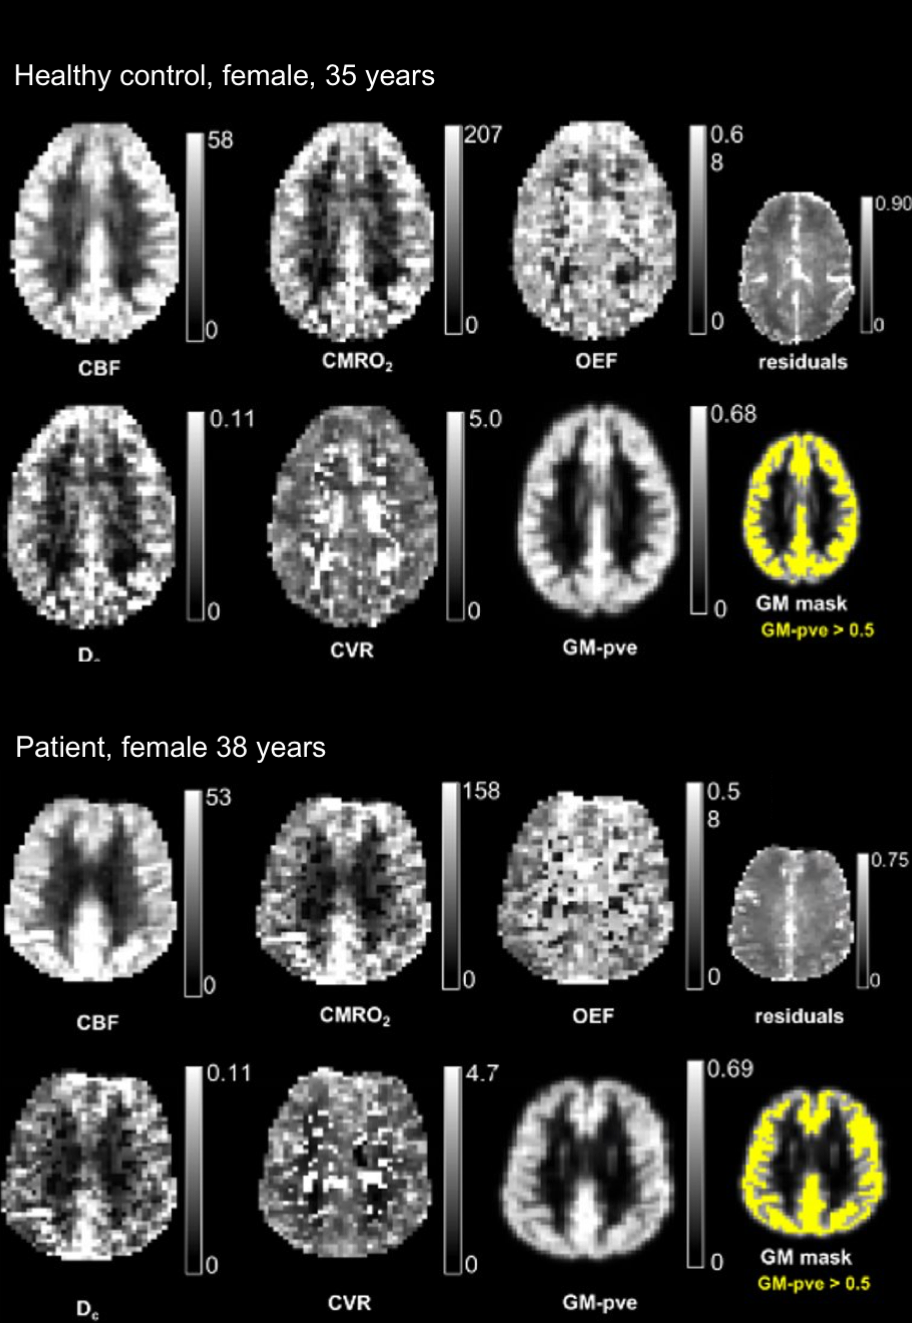
We used our multi-parametric dc-fMRI method (dual-excitation PCASL) to investigate baseline brain tissue physiology. We acquired BOLD and ASL signals simultaneously4,6 with the following parameters: TE1= 10ms, TR1= 3600ms, TE2= 30ms, TR2= 800ms, slice thickness= 7mm, GRAPPA acceleration factor 3. We mapped changes in CVR, CBF, OEF, CMRO2 and D across cortical and subcortical GM in patients with relapsing-remitting MS (RRMS)7 and matched healthy controls (Figure1). During the acquisition, we presented hypercapnic and hyperoxic respiratory stimuli to induce alterations in the blood oxygenation levels.4 We segmented GM using a partial volume (PV) threshold of 0.5, based on FAST T1 segmentation. For the main imaging analysis we used in-house developed MATLAB scripts and FSL toolbox functions. We used independent samples t-tests for group comparisons of each parameter. Due to possible differences in GM volume in patients compared to controls, we tested whether any group differences in vascular and metabolic measures covaried with local GM PV estimates.Results
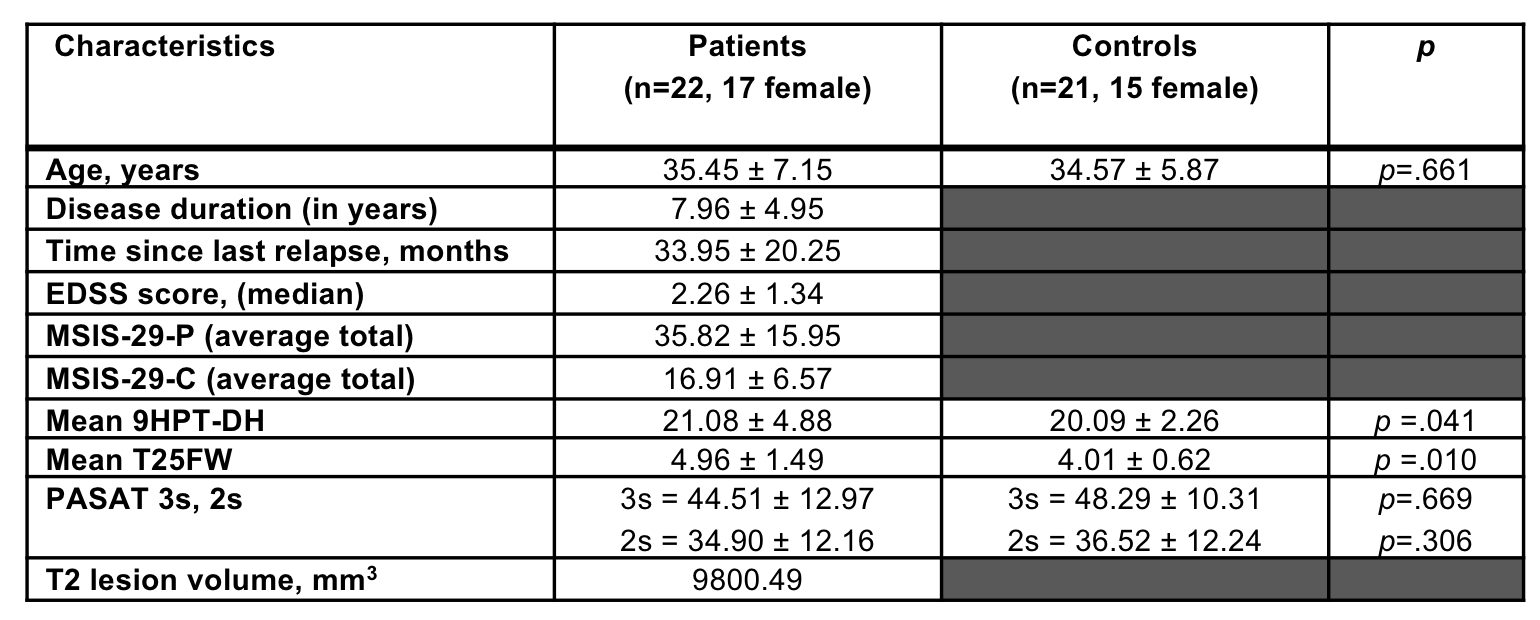
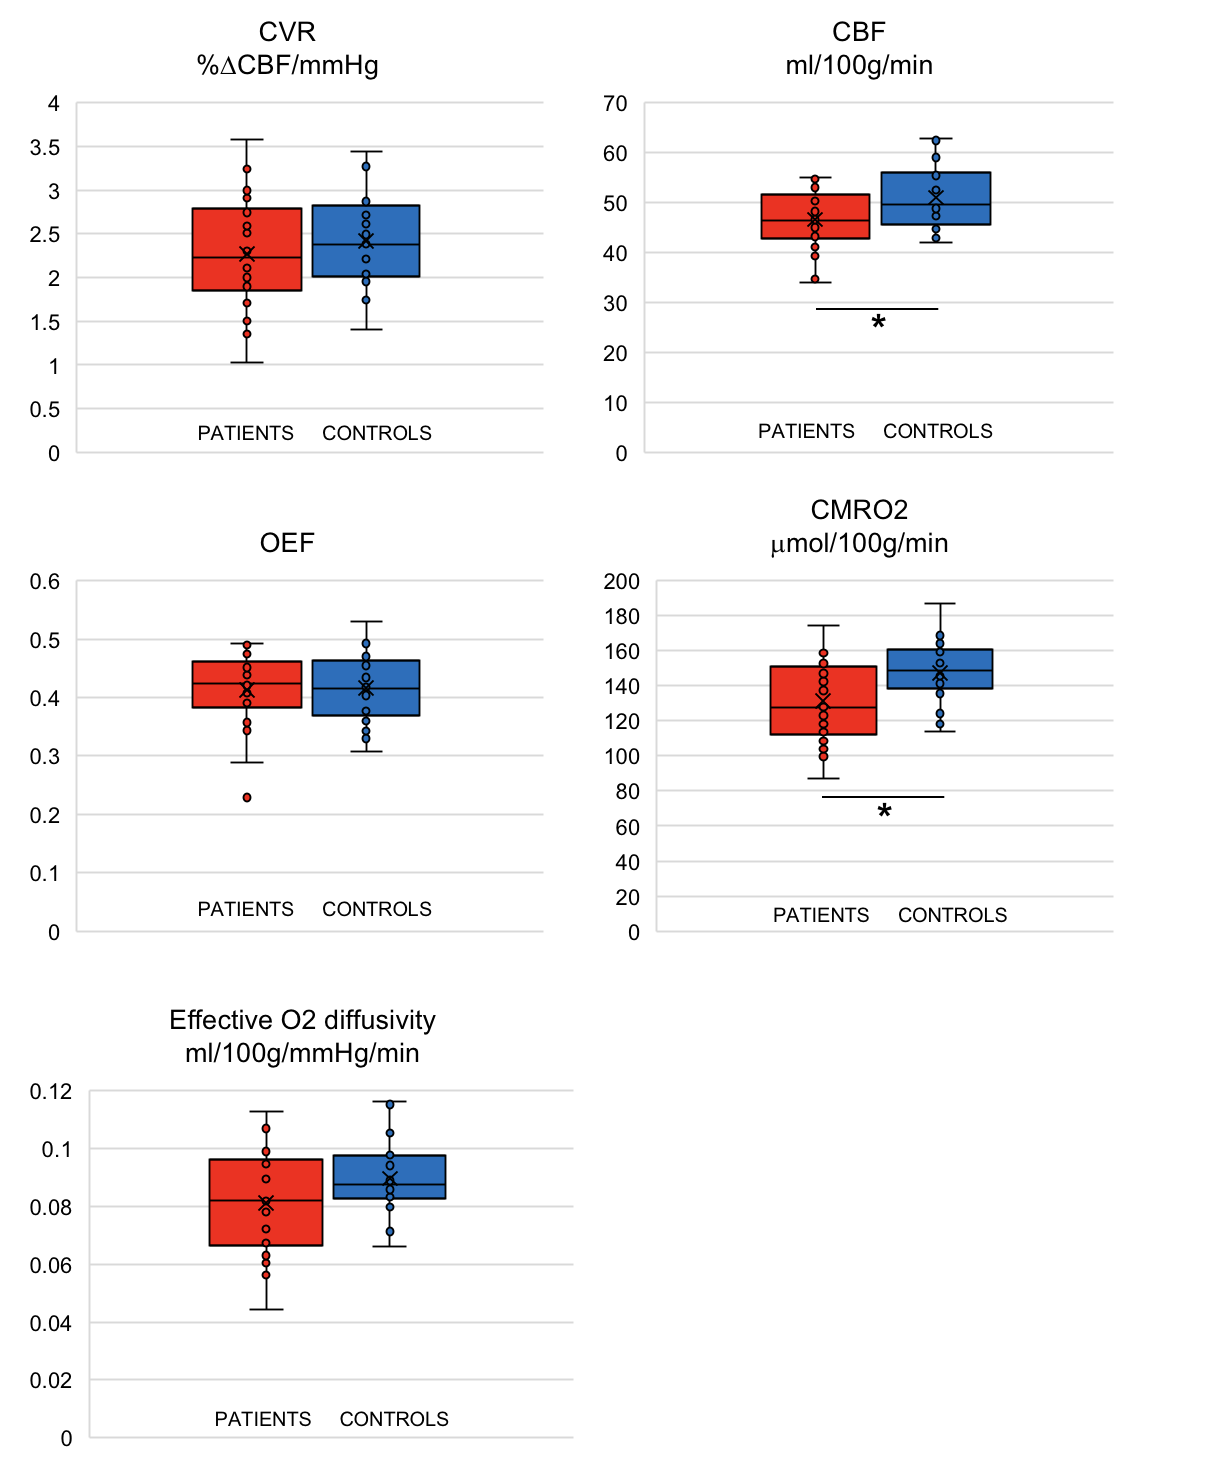
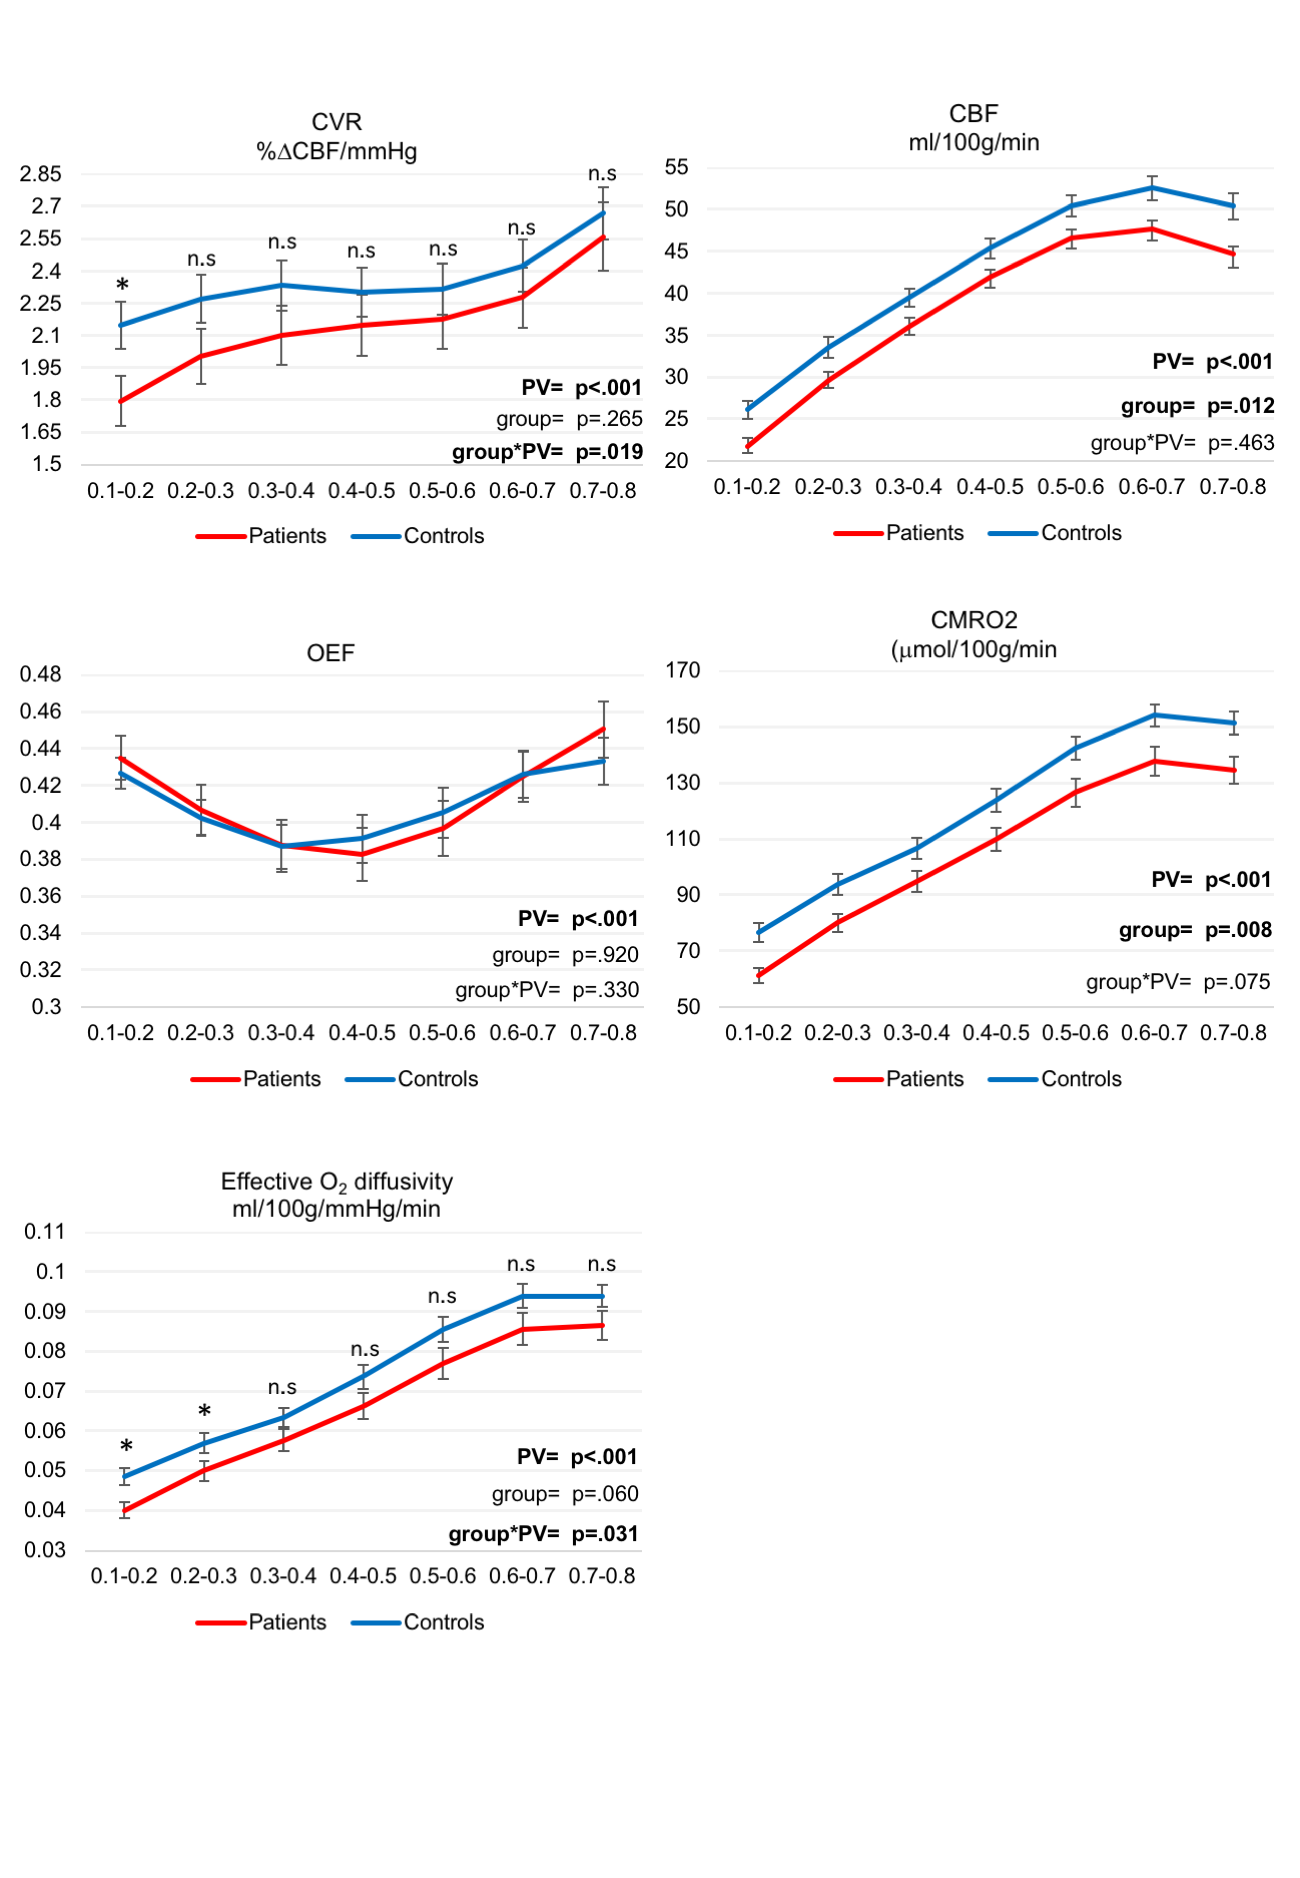
We recruited 22 RRMS patients and 21 healthy controls (Table 1). Results showed no differences in GM volume between patients and controls (patients: 821206.99 ± 51071.98, controls: 829472.53 ± 45982.52, p<0.581). However there was a significant difference in whole brain volume (patients: 1508786.45±75042.08, controls: 1551123.24 ± 58903.77, p<0.047). In voxels with PV > 0.5, patients had lower CBF (ml/100g/min) (patients: 46.63±6.09, controls: 51.03±6.29, p=0.025) and CMRO2 (mmol/100g/min) (patients: 147.37±23.03, controls: 131.13±17.69, p<0.013) compared to controls. There were no statistically significant differences in CVR (%Δ/CBF/mmHg) (patients: 2.27±0.66, controls: 2.41±0.55, p<0.442), D (ml/100g/mmHg/min) (patients: 0.08±0.02, controls: 0.09±0.01, p=0.087) or OEF (patients: 0.41±0.07, controls: 0.42±0.06, p=0.868) (Figure2). Testing the effect of different PV thresholds on these physiological measures revealed that patients had consistently lower CBF, CMRO2 and oxygen diffusivity across all PV thresholds when compared to controls (main effect of group p<0.05). This was not observed for OEF or CVR (Figure 3).Discussion/conclusions
Our results demonstrate that our multi-parametric, non-invasive MRI method to quantify brain tissue physiology in MS can detect reliably consistent reductions in GM CBF and CMRO2 in the patients over and above MS-related variations in GM volume, namely the remaining grey matter shows reduced CBF and CMRO2. These findings conform with prior evidence showing alterations in GM resting perfusion and global reductions in O2 consumption3. However, our work extends this, suggesting that GM vascular/metabolic physiology is disrupted in MS, which may have consequences on MS disability and disease progression. Our data offer proof of concept that this multi-parametric MRI approach can provide quantitative information in a single session, with potential clinical utility for quantifying brain physiology in neurological disease.Acknowledgements
We would like to thank Wellcome for their continued support for this research.References
1 Tomassini, V., Matthews, P. M., Thompson, A. J., Fuglø, D., Geurts, J. J., Johansen-Berg, H., ... & Palace, J. (2012). Neuroplasticity and functional recovery in multiple sclerosis. Nature Reviews Neurology, 8(11), 635.
2 Calabrese, M., Magliozzi, R., Ciccarelli, O., Geurts, J. J., Reynolds, R., & Martin, R. (2015). Exploring the origins of grey matter damage in multiple sclerosis. Nature Reviews Neuroscience, 16(3), 147.
3 Ge, Y., Zhang, Z., Lu, H., Tang, L., Jaggi, H., Herbert, J., ... & Grossman, R. I. (2012). Characterizing brain oxygen metabolism in patients with multiple sclerosis with T2-relaxation-under-spin-tagging MRI. Journal of Cerebral Blood Flow & Metabolism, 32(3), 403-412.
4 Germuska, M., Merola, A., Murphy, K., Babic, A., Richmond, L., Khot, S., Hall, J.E. and Wise, R.G., 2016. A forward modelling approach for the estimation of oxygen extraction fraction by fMRI. NeuroImage, 139, pp.313-323.
5 Germuska, M., Chandler, H. L., Stickland, R. C., Foster, C., Fasano, F., Okell, T. W., ... & Wise, R. G. (2018). Dual-calibrated fMRI measurement of absolute cerebral metabolic rate of oxygen consumption and effective oxygen diffusivity. NeuroImage.
6 Schmithorst, V.J., Hernandez-Garcia, L., Vannest, J., Rajagopal, A., Lee, G., Holland, S.K., 2014. Optimized simultaneous ASL and BOLD functional imaging of the whole brain. J Magn Reson Imaging 39, 1104-1117.
7 Polman, C. H., Reingold, S. C., Banwell, B., Clanet, M., Cohen, J. A., Filippi, M., ... & Lublin, F. D. (2011). Diagnostic criteria for multiple sclerosis: 2010 revisions to the McDonald criteria. Annals of neurology, 69(2), 292-302.
Figures