3143
Grey matter atrophy measured with MRI correlates with reduced neuronal density in the experimental autoimmune encephalomyelitis model of multiple sclerosis1Radiology, University of Calgary, Calgary, AB, Canada, 2Hotchkiss Brain Institute, University of Calgary, Calgary, AB, Canada, 3Clinical Neurosciences, University of Calgary, Calgary, AB, Canada, 4Experimental Imaging Center, University of Calgary, Calgary, AB, Canada
Synopsis
Atrophy is a clinical marker of neurodegeneration and progressive disability in multiple sclerosis (MS). To test neuroprotective treatments aimed at reducing atrophy, mouse models featuring atrophy are needed. We have shown the experimental autoimmune encephalomyelitis (EAE) mouse model features atrophy, though we do not know if EAE atrophy is caused by neurodegeneration, as it is in MS. We used MRI and atlas-based regional volumetrics to measure atrophy in EAE, while using immunohistochemistry to measure neurodegeneration. Atrophy measured in the cerebellum and cerebral cortex correlated with neuronal loss, suggesting we can use EAE along with MRI to test neuroprotective therapies.
Purpose
Current evidence indicates that neurodegenerative processes play an important role in multiple sclerosis (MS) alongside inflammation and demyelination1. The accumulation of neurodegeneration, through neuron and axon loss, results in a loss of brain volume known as atrophy2. Atrophy has been associated with disease progression3, as well as cognitive4 and physical disability5 making atrophy an important clinical target for treating MS. To treat atrophy in MS, there is a need to test neuroprotective therapies in mouse models that feature neuroinflammation and atrophy. One potential model is experimental autoimmune encephalomyelitis (EAE), which is a model of central nervous system (CNS) targeted autoimmunity. Previously we have shown EAE features atrophy6; however we do not know if atrophy is the result of accumulated neurodegeneration similar to MS. We used high resolution magnetic resonance imaging (MRI), a Bruker cryoprobe, and atlas-based regional volumetrics to measure atrophy in the brains of EAE mice. We compared these MRI measurements with histological measurements of neuronal density to determine whether MRI measurements of atrophy could be a useful marker of neurodegeneration.Methods
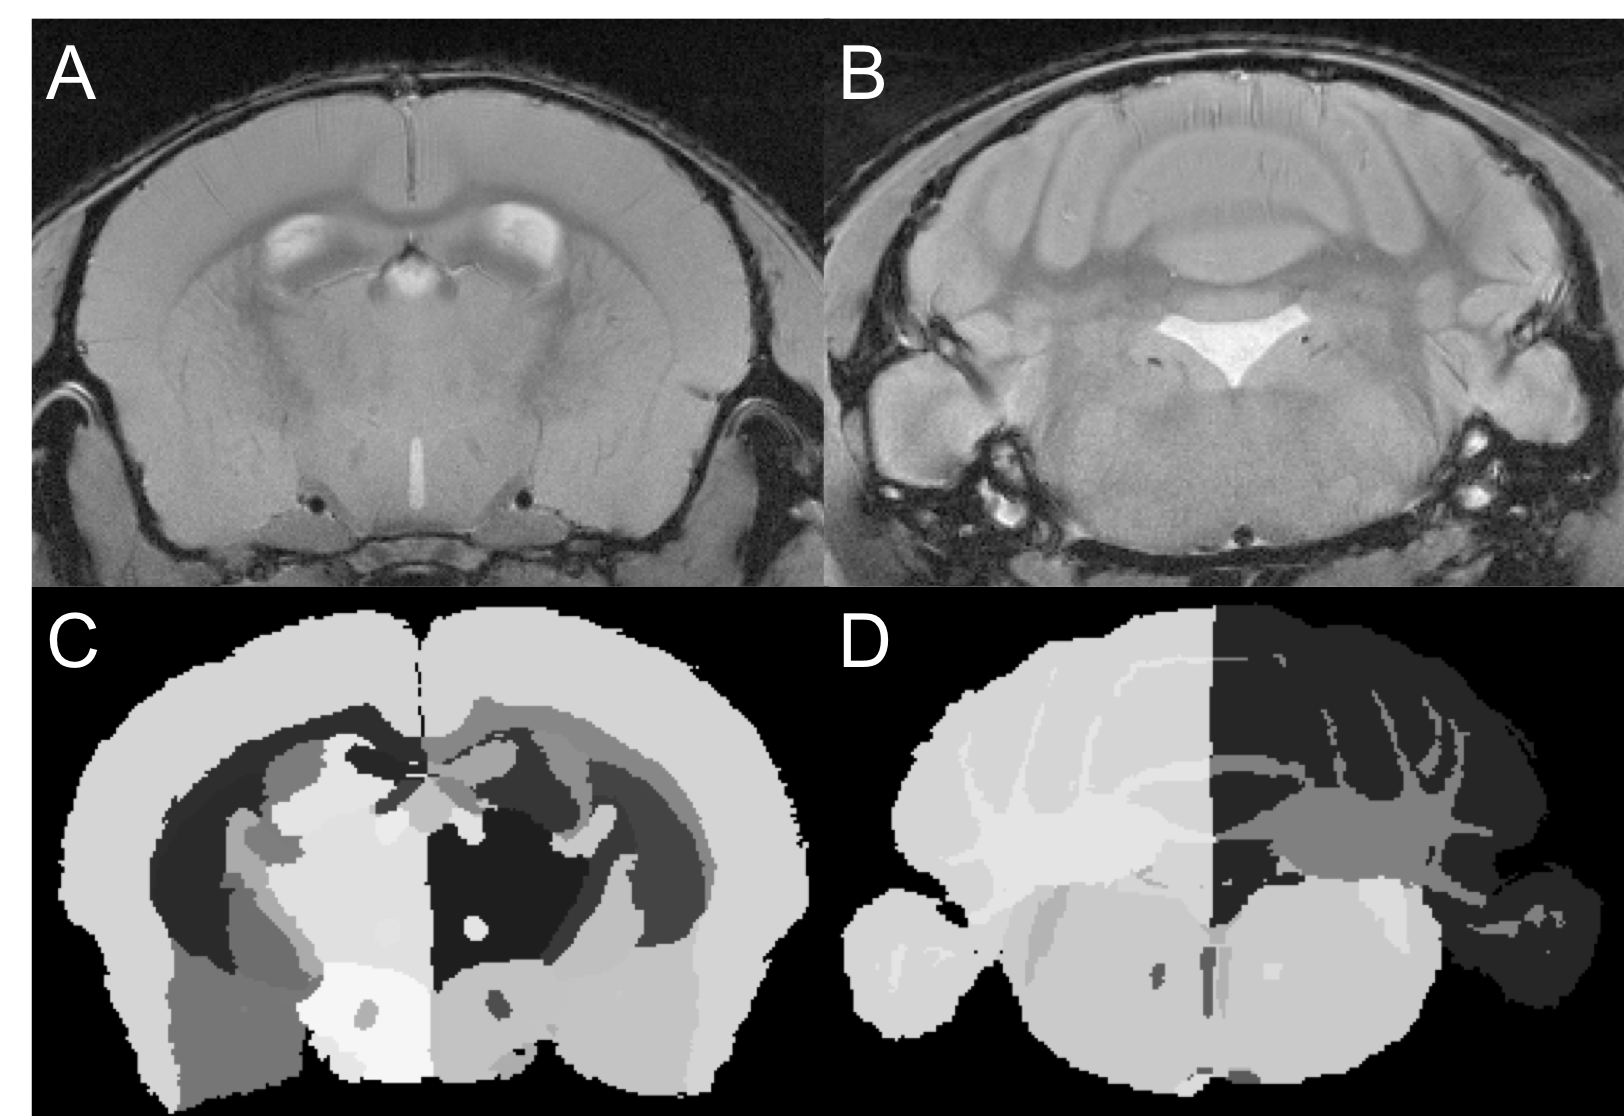
Female C57BL/6 mice were induced with EAE as described.7 Motor disability and disease severity were assessed using a 15-point scoring system based on individual limb paralysis.8 Mice were imaged at 66 days post induction [n=10 EAE, 5 Naïve, 5 CFA (the last received immune stimulant but no myelin peptides)]. Imaging was conducted using a 9.4T MRI with a helium cooled Bruker cryoprobe using a FLASH sequence (TR/TE/α=2000ms/6.5ms/60o voxel=37.5-x-37.5-x-250μm3) (Figure 1a-b). Using the program Niftyreg, an averaged brain atlas9 was registered non-linearly to each dataset and the volume of each registered atlas brain region was determined (Figure 1c-d). Following imaging, mice were sacrificed and brains were extracted for histology. Cortex and cerebellar sections were stained with NeuN. Quantification of NeuN stained neurons was performed using stereology with the StereoInvestigator program Optical Fractionator10. Regions of interest were traced at low magnification (4x magnification, NA 0.16). Counting was performed using random counting grids (35um x 35um cortex, 10um x 10um, and cerebellum) at 40x magnification (NA 0.45). Counting sites per section ranged from 25-30 for the cortex, and 40-50 for the cerebellum. Statistics were performed using an ANOVA test with a Tukey post-hoc. Correlations between disease score and brain volume were quantified using Spearman’s test.Results
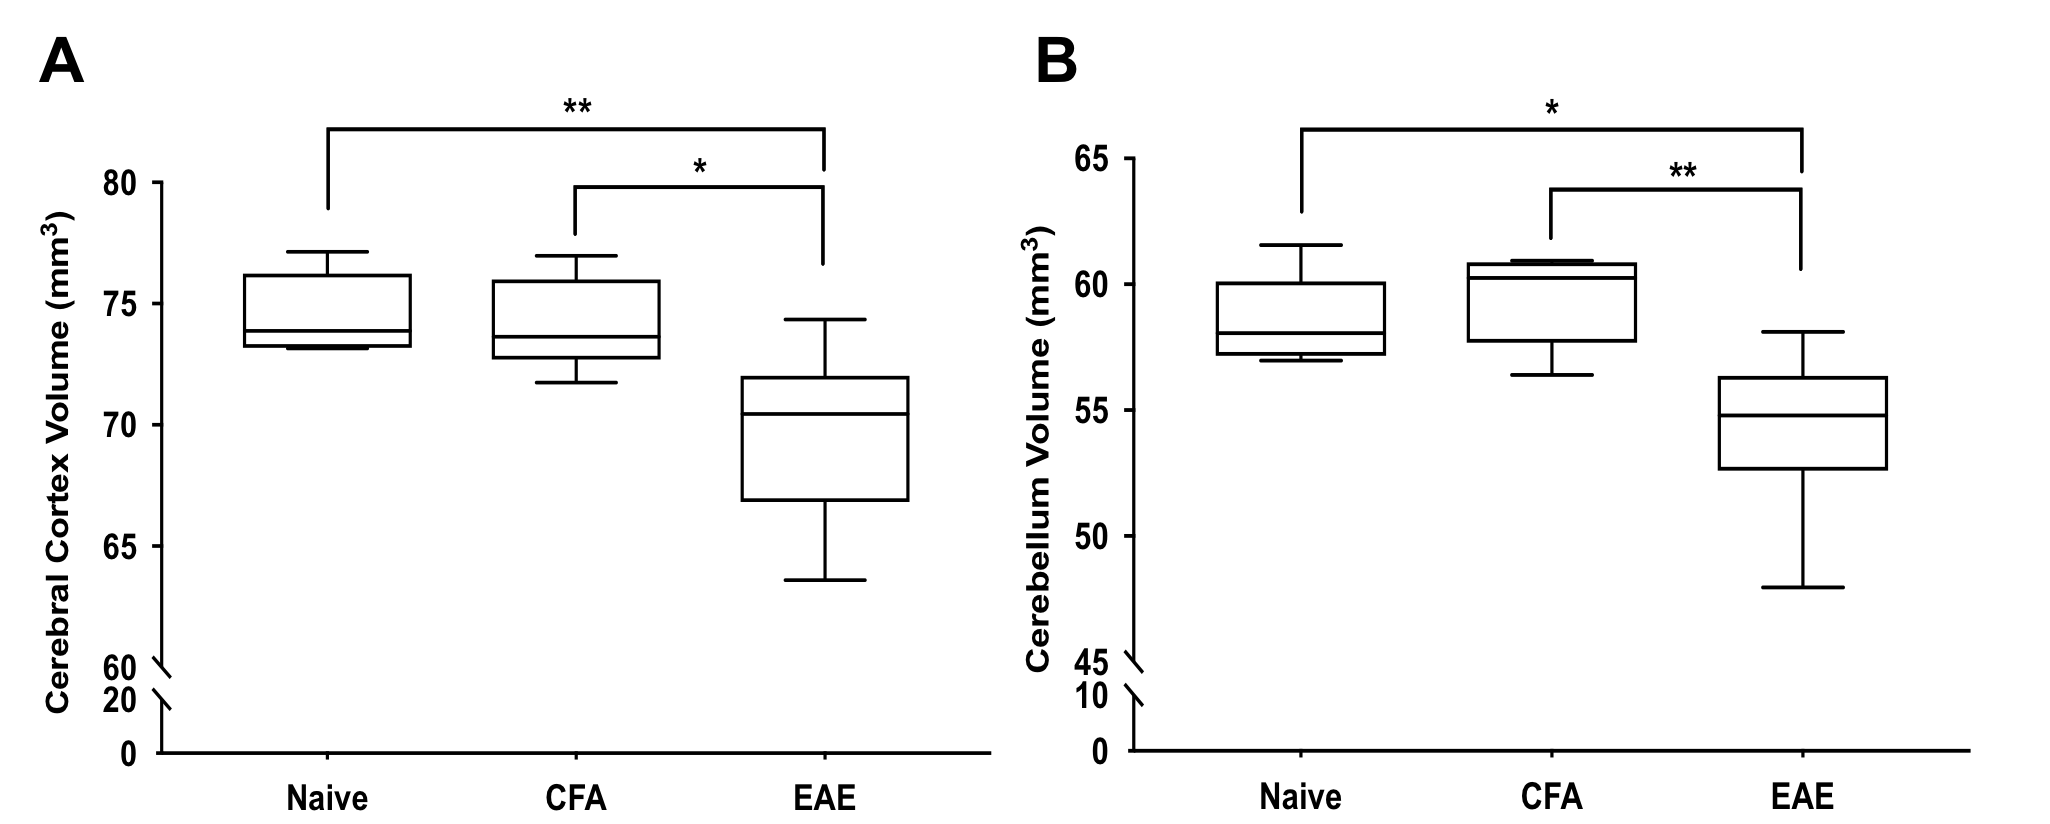
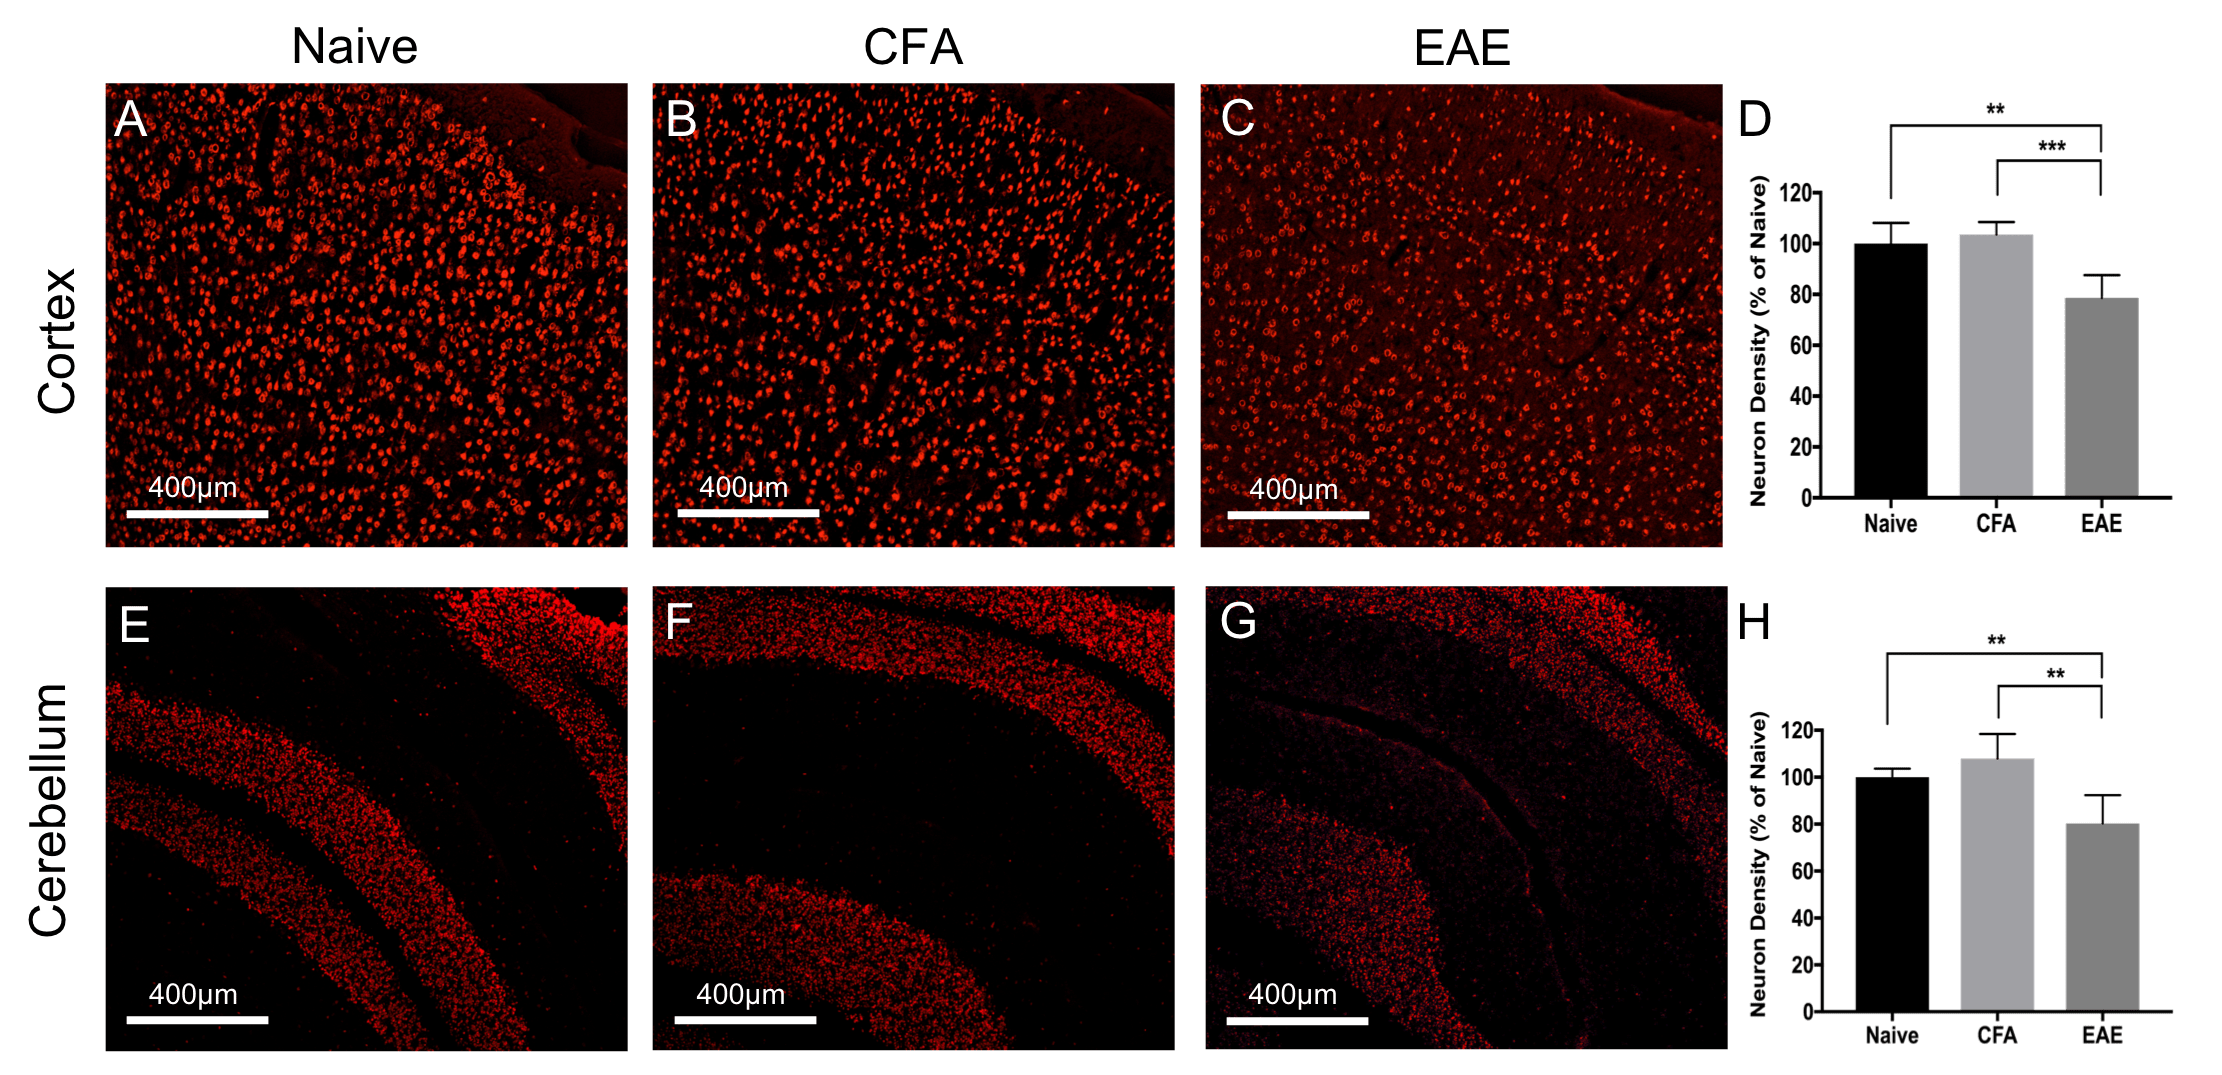
EAE mice had smaller cerebral cortex and cerebellar volumes compared to Naïve and CFA mice (Figure 2). Both the cortex and cerebellum also showed reduced neuronal densities based on NeuN staining (Figure 3). In EAE mice, cortical and cerebellar volumes correlated with neuronal density (Figure 4) as well as cumulative long-term disease scores (Figure 5). This was not seen with peak clinical disease scores (day 14-16).Discussion
EAE mice showed atrophy in the cortex and cerebellum, similar to previous work by our lab6 as well as others.11 This further supports that EAE mice experience grey matter atrophy at long-term disease duration. These atrophic regions also had a reduction in neuronal density suggesting EAE mice experience atrophy as a result of neurodegeneration, rather than other issues such as weight loss or dehydration. As EAE is a model of CNS targeted inflammation, this suggests that inflammation may play a role in neurodegeneration/atrophy. The EAE model may be a good model to study how neuroinflammation is connected to neurodegenerative mechanisms in MS.
We found that volumes of atrophic regions, measured using MRI, correlated with stereological measurements of neuronal loss. Atrophy in MS is seen as the accumulation of neurodegeneration and our data suggests this appears to be the case in EAE. Atrophy also correlated with long-term disease scores, suggesting atrophy is associated with long-term permanent motor disability in EAE. This is similar to MS where atrophy is linked to disease progression3 and physical disability5. Previous research has shown axonal loss in the EAE spinal cord also corresponded with long-term clinical disease scores12. It is possible that degeneration in both the spinal cord and brain is driven by similar mechanisms and combines to drive EAE disease progression.
Conclusion
EAE mice exhibit significant reductions in both volume and neuronal density of the cerebral cortex and cerebellum at long-term disease duration. Correlations between atrophy, neuronal loss, and long-term disease scores suggest that atrophy can be used as a marker of neurodegeneration, disease progression, and permanent motor disability in the EAE model. Using MRI and atlas-based volumetrics, EAE has the potential to be used for testing neuroprotective therapeutic treatments aimed at reducing neurodegeneration and atrophy in MS.Acknowledgements
Funding for this study was provided by the AIHS CRIO team grant.References
1. Trapp BD, Ransohoff RM, Fisher E, Rudick RA. Neurodegeneration in Multiple Sclerosis: Relationship to Neurological Disability. The Neuroscientist. 1999;5(1):48-57.
2. Miller DH, Barkhof F, Frank JA, Parker GJ, Thompson AJ. Measurement of atrophy in multiple sclerosis: pathological basis, methodological aspects and clinical relevance. Brain. 2002;125(Pt 8):1676-95.
3. Simon JH. Brain and spinal cord atrophy in multiple sclerosis: role as a surrogate measure of disease progression. CNS Drugs. 2001;15(6):427-36.
4. Lanz M, Hahn HK and Hildebrandt H. Brain atrophy and cognitive impairment in multiple sclerosis: a review. J Neurol. 2007; 254 Suppl 2: II43-8.
5. Bakshi R, Benedict RHB, Bermel RA, Jacobs L. Regional Brain Atrophy Is Associated With Physical Disability in Multiple Sclerosis: Semiquantitative Magnetic Resonance Imaging and Relationship to Clinical Findings. Journal of Neuroimaging. 2001;11(2):129-36.
6. Hamilton AM, Forkert ND, Yang R, Wu Y, Rogers J, Yong VW, Dunn JF. Grey matter atrophy measured in-vivo with 9.4T MRI in the experimental autoimmune encephalomyelitis mouse model of multiple sclerosis. 25th Annual Meeting of the International Society for Magnetic Resonance in Medicine, Honolulu, USA 2017, Proceedings of the International Society for Magnetic Resonance 25: 0188, 2017.
7. Agrawal SM, Silva C, Tourtellotte WW and Yong VW. EMMPRIN: a novel regulator of leukocyte transmigration into the CNS in multiple sclerosis and experimental autoimmune encephalomyelitis. J Neurosci. 2011; 31: 669-77.
8. Weaver A, Goncalves da Silva A, Nuttall RK, et al. An elevated matrix metalloproteinase (MMP) in an animal model of multiple sclerosis is protective by affecting Th1/Th2 polarization. FASEB J. 2005; 19: 1668-70.
9. Dorr AE, Lerch JP, Spring S, Kabani N and Henkelman RM. High resolution three-dimensional brain atlas using an average magnetic resonance image of 40 adult C57Bl/6J mice. Neuroimage. 2008; 42: 60-9.
10. West MJ, Slomianka L, Gundersen HJ. Unbiased stereological estimation of the total number of neurons in thesubdivisions of the rat hippocampus using the optical fractionator. The Anatomical record. 1991;231(4):482-97.
11. MacKenzie-Graham A, Rinek GA, Avedisian A, et al. Cortical atrophy in experimental autoimmune encephalomyelitis: in vivo imaging. Neuroimage. 2012; 60: 95-104.
12. Wujek JR, Bjartmar C, Richer E, et al. Axon loss in the spinal cord determines permanent neurological disability in an animal model of multiple sclerosis. J Neuropathol Exp Neurol. 2002; 61: 23-32.
Figures