3142
Gray matter pathology changes in multiple sclerosis: a comparison of diffusion kurtosis and volumetrics.1NYU School of Medicine, New York, NY, United States
Synopsis
Along with well-characterized abnormalities in normal appearing and lesional white matter, gray matter (GM) pathology has been observed in multiple sclerosis (MS) both with diffusion tensor imaging (DTI) and structural MRI. We used diffusion kurtosis imaging (DKI), a clinically feasible extension of DTI, to characterize pathology in cortical and subcortical GM in MS and uncovered correlations with disease severity, quantified in terms of the Patient Determined Disease Score (PDDS). Our results suggest that DKI metrics are sensitive to changes in GM and could be helpful to use alongside standard markers of disease progression, such as GM volume atrophy.
Introduction
While multiple sclerosis (MS) has traditionally been considered a progressive disorder of white matter1, recent studies2,3 suggest that pathology of gray matter (GM) is also an important contributor to the disease process. This study aimed to characterize GM pathological changes and its association with clinical manifestation in MS using diffusion kurtosis imaging (DKI), a clinically feasible extension of diffusion tensor imaging (DTI), and compare against conventional GM volumetrics4.Methods
Subjects: This retrospective analysis was approved by an IRB and included 36 patients with relapsing-remitting MS and 24 age and gender-matched healthy controls who received neurological examinations, underwent MRI on a 3T MR Scanner (Siemens Skyra or Prisma), and completed a Patient Determined Disease Steps (PDDS) score, a validated patient-reported metric of disease severity. Table 1 lists demographics of the cohort.
MRI: Imaging included whole brain 3D magnetization-prepared rapid gradient-echo (MPRAGE) (1 mm3 isotropic resolution) for extracting volumetrics and monopolar diffusion-weighted EPI (voxel size = 1.7 x 1.7 x 3 mm3, b=0, 250, 1000, and 2000 s/m2 along 84 directions, TE/TR = 100/3500 ms, GRAPPA with acceleration 2, and multiband 2) for deriving diffusion metrics.
Statistical Analysis: For each subject, regions of interest (ROI) were automatically segmented via anatomical MPRAGE using Freesurfer, then combined and narrowed down into 7 subcortical and 5 cortical GM regions. For this study, total subcortical regions were defined as the non-cortical GM regions of the prosencephalon. With the addition of total subcortical and cortical GM, we had a total of 14 ROIs. The corresponding volume metrics for each ROI were extracted. Diffusion MRI data was processed using DESIGNER5 to derive parametric maps for the mean diffusivity (MD), mean kurtosis (MK) and fractional anisotropy (FA). An affine transform from a b=0 diffusion image to the MPRAGE was computed using bbregister to propagate Deskan/Killiany atlas6 labels to diffusion space. The diffusion and volume metrics gathered were compared between MS patients and controls using analysis of covariance with age as the covariate. We analyzed the correlation of these metrics with disease severity as characterized by the PDDS score covarying with disease duration, gender, and age.
Results
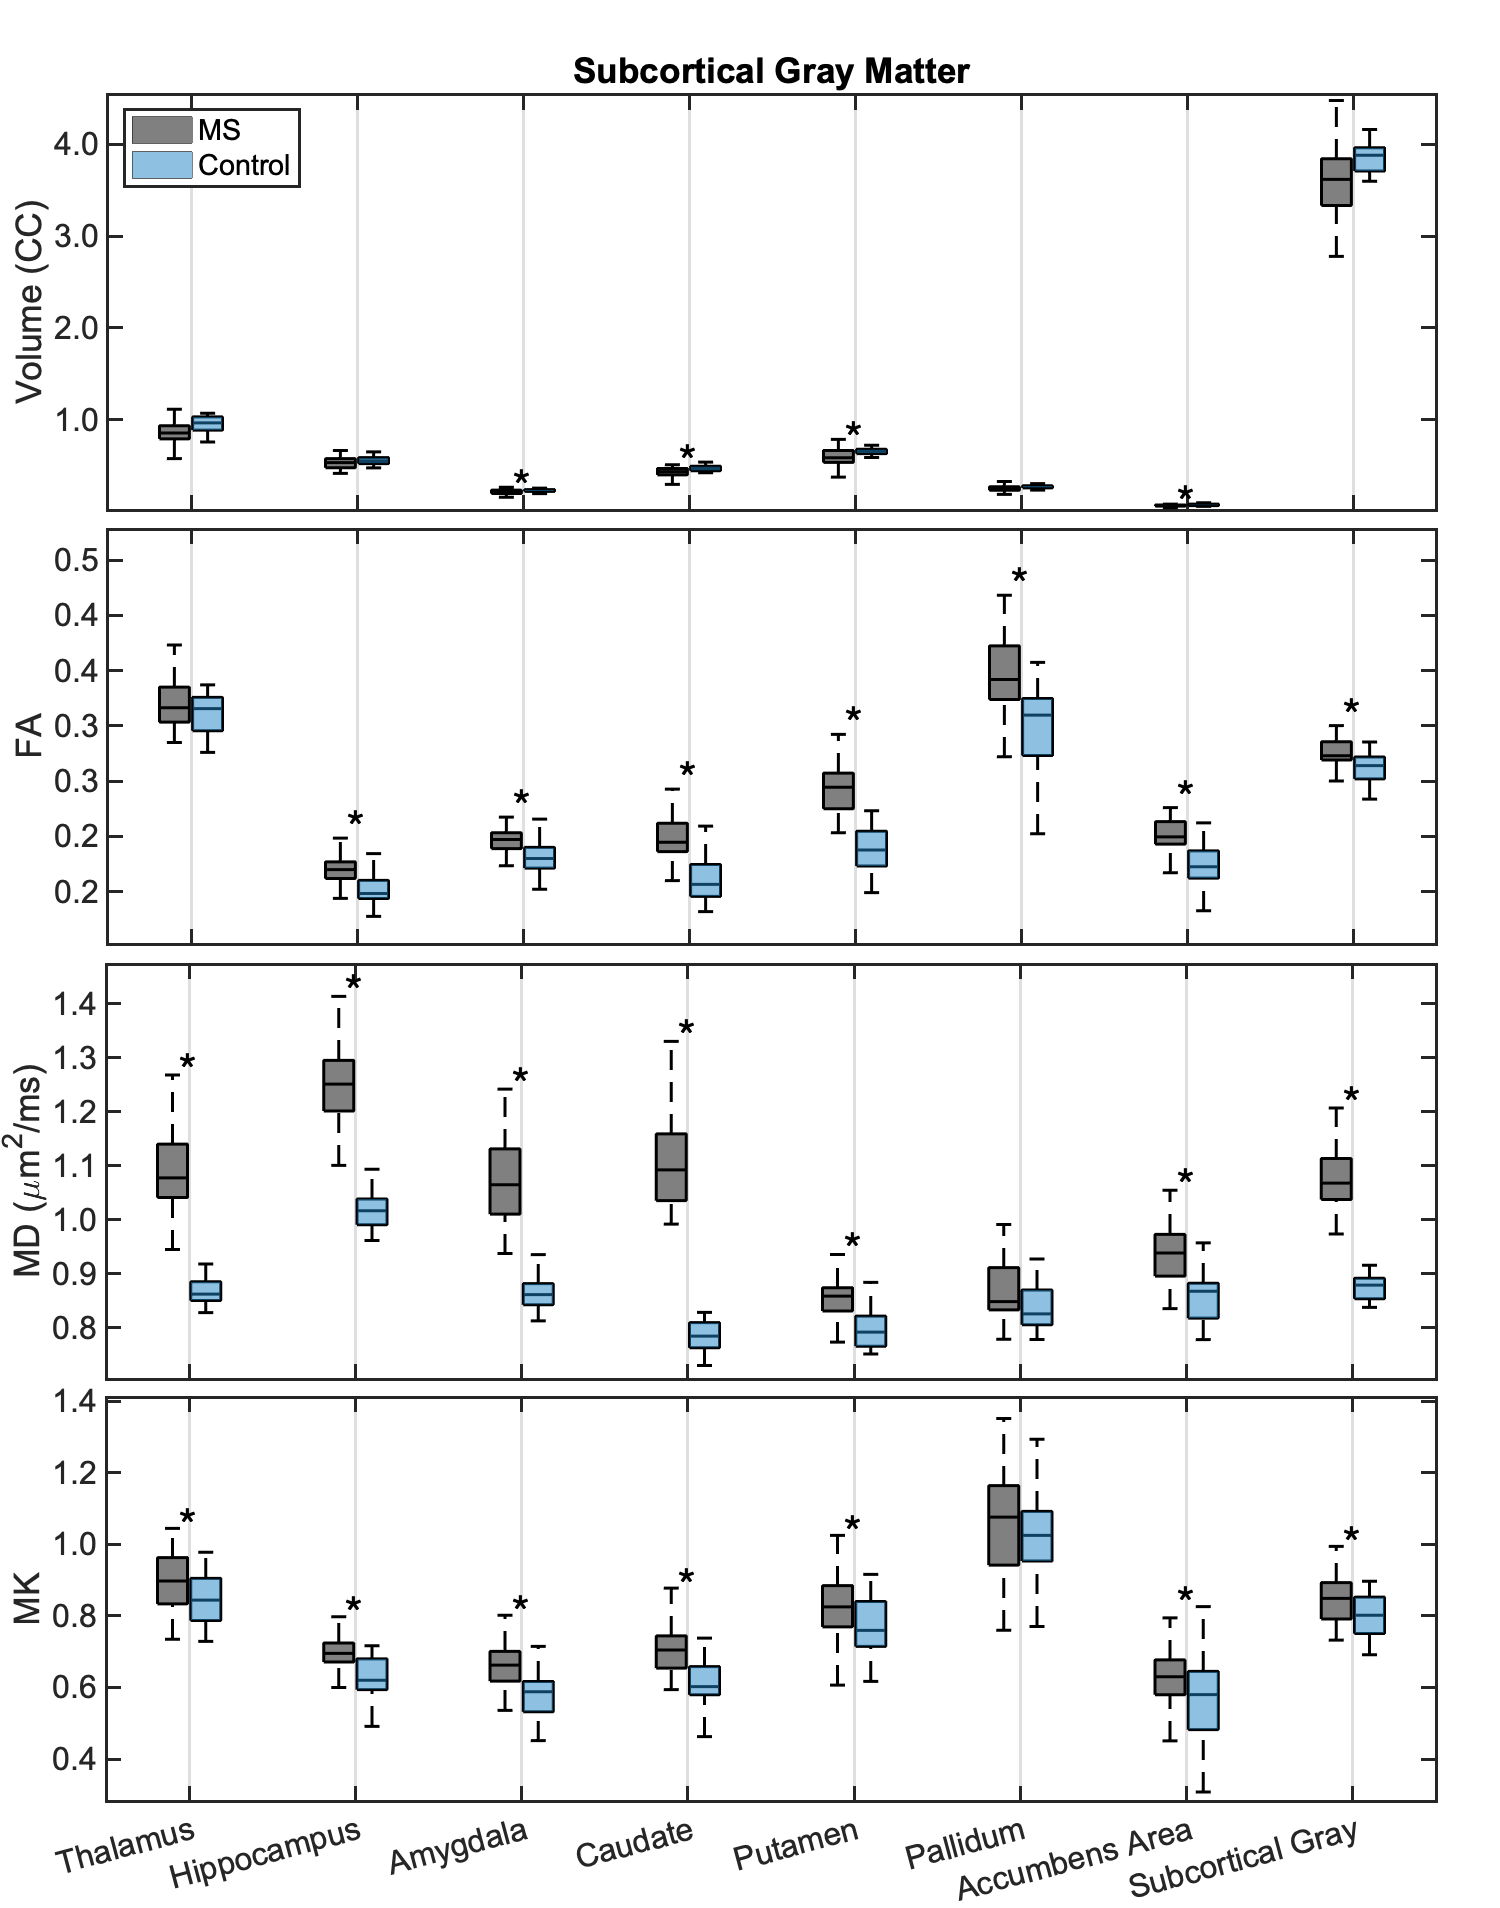
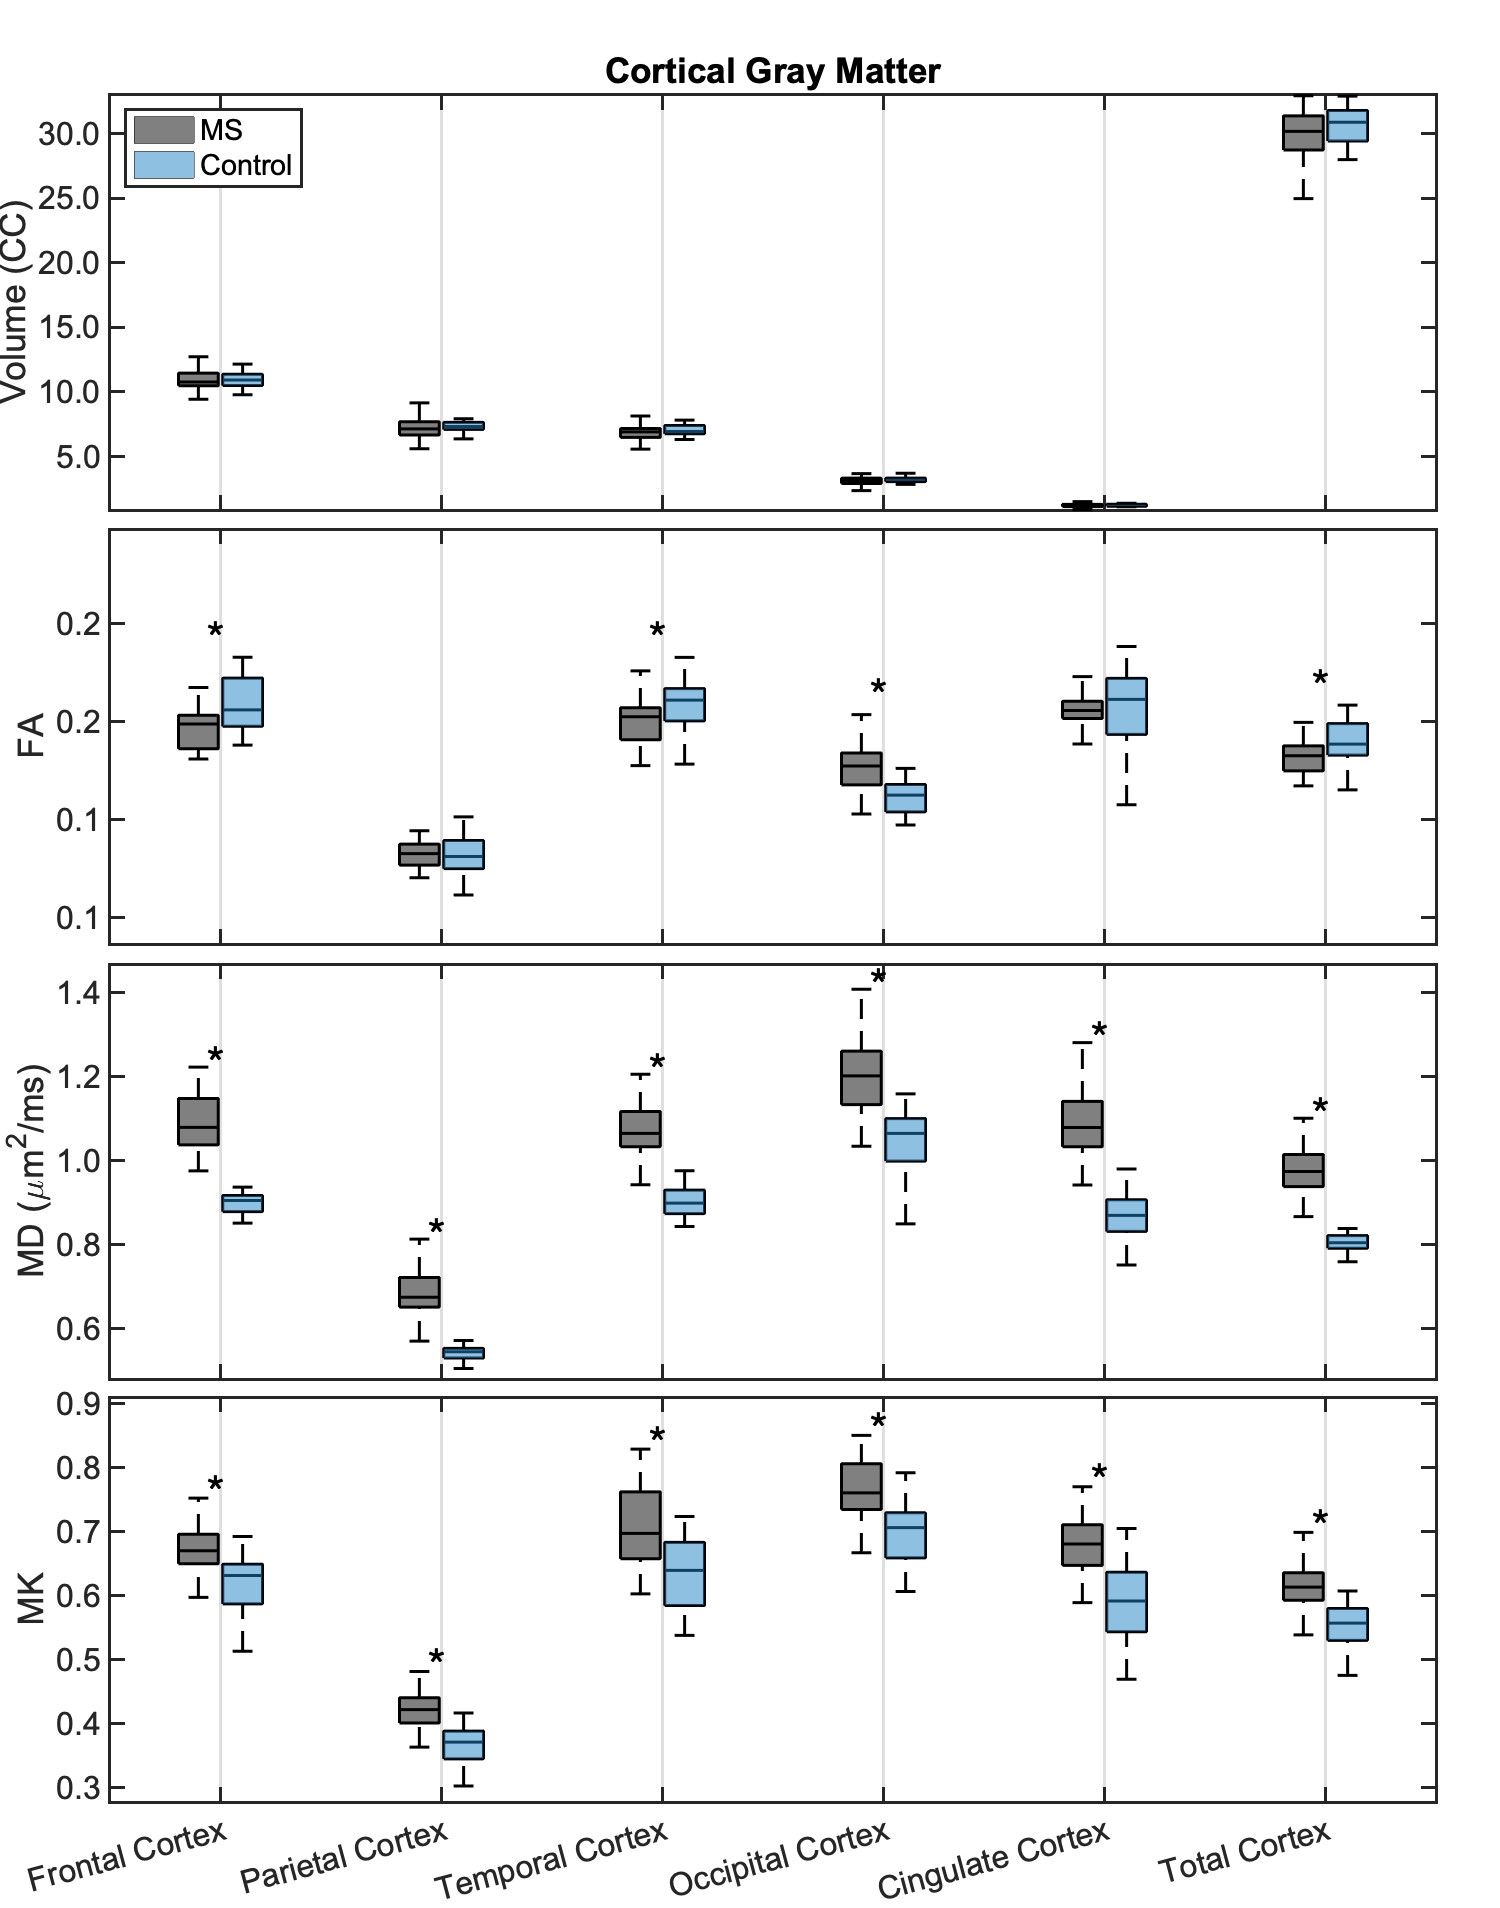
Figure 1 and 2 show box plots of the various metrics (volume, MD, MK, and FA) for control and MS patients for cortical and subcortical ROIs, respectively. Significantly (p<0.05) decreased volumes were found in MS for several subcortical ROIs, with even more pronounced differences in terms of the diffusion metrics. In particular, both MD and MK were significantly increased in all ROIs (except MK in the pallidum) in patients compared to controls, while FA was either increased in the subcortical GM ROIs, or decreased in the cortical GM (except for the occipital cortex).
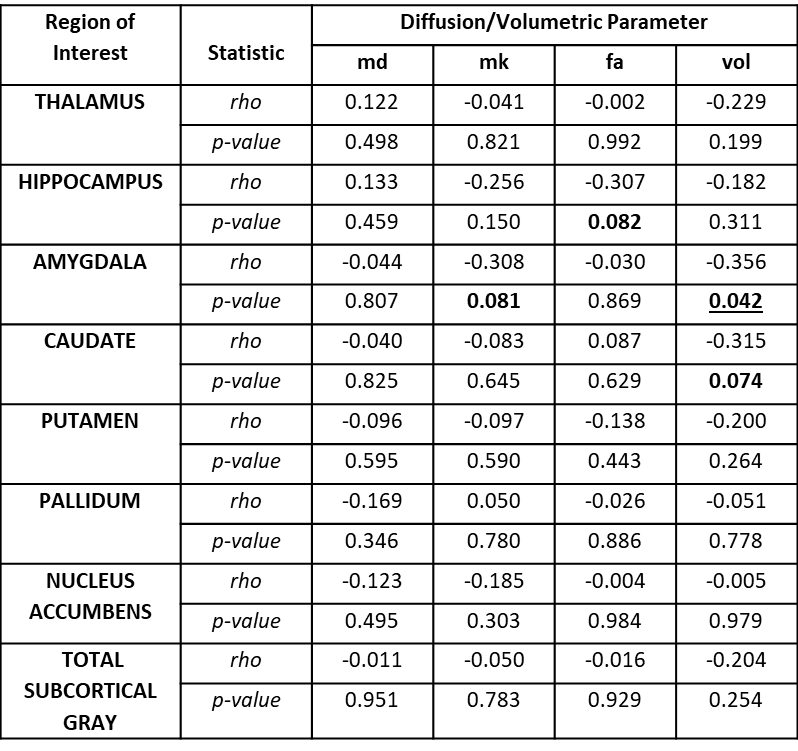
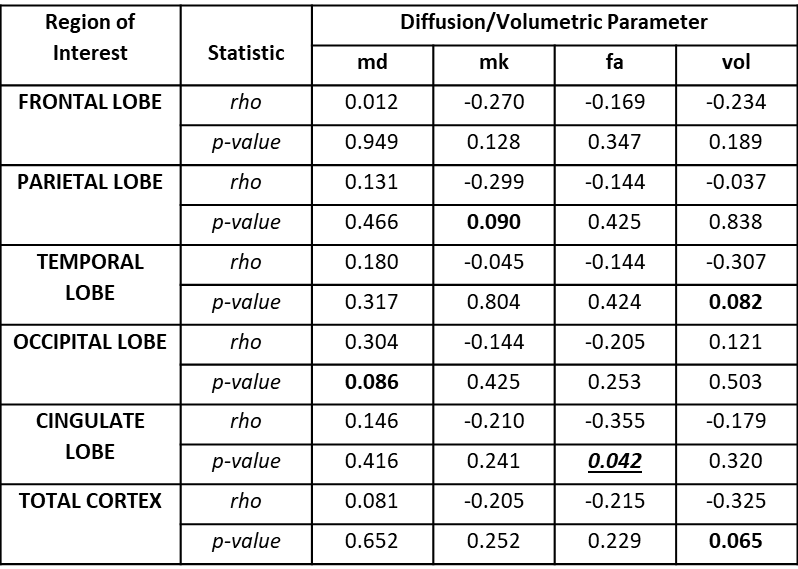
Correlations between the various metrics and PDDS are displayed for subcortical and cortical regions in Table 2 and 3 respectively. The GM volumes were negatively correlated with increasing PDSS, reaching significance in the amygdala. Several trends (p<0.1) were observed for increasing MD, decreasing MK, and decreasing FA with increasing PDDS, reaching significance for the FA in the cingulate cortex.
Discussion
This study characterized GM pathology in MS patients using DKI and volumetry in several GM ROIs constituting to the total cortical and subcortical GM. While our results confirmed previous reports of decreased GM volumes in MS patients compared to controls7-10, we also found differences in diffusion metrics with larger effect sizes. Interestingly, the observed increase in MK may be indicative of increased restriction due to microgliosis and astrocytosis in GM11.
In terms of correlation with disease manifestation, our results showed a negative correlation in volumes of certain GM ROIs with increasing disease severity, which agrees with previous studies12,13, though contrasts others studies14-16. Similarly, the positive correlations found between MD and PDDS in various GM ROIs are consistent with previous work17. Here, we also found a negative correlation between MK in various GM regions and increasing PDDS, which is in line with one previous study18 reporting correlation between cortical GM MK and worse outcome in cognitive test (but not with EDSS). The observed negative correlation (as opposed to the observed increase in MK between MS and controls) may suggest that neurodegenerative processes such as demyelination and/or neuronal loss more so than inflammation (potentially causing an increase in MK) are contributing in GM to increasing MS disease severity.
Conclusions
Our results suggest that DKI metrics are sensitive to changes in GM and could be helpful to use alongside standard markers of disease progression, such as GM volume atrophy. Future longitudinal studies may yield further insight into the underlying GM pathology in MS.Acknowledgements
This study was supported by the National Institute of Neurological Disorders and Stroke of the National Institutes of Health under award number R01NS088040, and performed at the Center of Advanced Imaging Innovation and Research CAI2R, www.cai2r.net) and NIBIB Biomedical Technology Resource Center P41 EB017183.
References
1. Noseworthy JH, Lucchinetti C, Rodriguez M, Weinshenker BG. Multiple sclerosis. N Engl J Med 2000; 343(13): 938-52.
2. Bo L, Geurts JJ, Mork SJ, van der Valk P. Grey matter pathology in multiple sclerosis. Acta Neurol Scand Suppl 2006; 183: 48-50.
3. Geurts JJ, Barkhof F. Grey matter pathology in multiple sclerosis. Lancet Neurol 2008; 7(9): 841-51.
4. Moccia M, de Stefano N, Barkhof F. Imaging outcome measures for progressive multiple sclerosis trials. Mult Scler 2017; 23(12): 1614-26.
5. Ades-Aron B, Veraart J, Kochunov P, et al. Evaluation of the accuracy and precision of the diffusion parameter EStImation with Gibbs and NoisE removal pipeline. Neuroimage 2018; 183: 532-43.
6. Desikan RS, Segonne F, Fischl B, et al. An automated labeling system for subdividing the human cerebral cortex on MRI scans into gyral based regions of interest. Neuroimage 2006; 31(3): 968-80.
7. Cappellani R, Bergsland N, Weinstock-Guttman B, et al. Diffusion tensor MRI alterations of subcortical deep gray matter in clinically isolated syndrome. Journal of the neurological sciences 2014; 338(1-2): 128-34.
8. Ciccarelli O, Werring DJ, Wheeler–Kingshott CAM, et al. Investigation of MS normal-appearing brain using diffusion tensor MRI with clinical correlations. Neurology 2001; 56(7): 926-33.
9. Datta S, Staewen TD, Cofield SS, et al. Regional gray matter atrophy in relapsing remitting multiple sclerosis: baseline analysis of multi-center data. Mult Scler Relat Disord 2015; 4(2): 124-36.
10. Nourbakhsh B, Azevedo C, Maghzi AH, Spain R, Pelletier D, Waubant E. Subcortical grey matter volumes predict subsequent walking function in early multiple sclerosis. Journal of the neurological sciences 2016; 366: 229-33.
11. Guglielmetti C, Veraart J, Roelant E, et al. Diffusion kurtosis imaging probes cortical alterations and white matter pathology following cuprizone induced demyelination and spontaneous remyelination. Neuroimage 2016; 125: 363-77.
12. Tao G, Datta S, He R, Nelson F, Wolinsky JS, Narayana PA. Deep Gray Matter Atrophy in Multiple Sclerosis: A Tensor Based Morphometry. Journal of the neurological sciences 2009; 282(1-2): 39-46.
13. Inglese M, Petracca M, Mormina E, et al. Cerebellar volume as imaging outcome in progressive multiple sclerosis. PloS one 2017; 12(4): e0176519.
14. Galego O, Gouveia A, Batista S, Moura C, Machado E. Brain atrophy and physical disability in primary progressive multiple sclerosis: A volumetric study. The neuroradiology journal 2015; 28(3): 354-8.
15. Shiee N, Bazin PL, Zackowski KM, et al. Revisiting brain atrophy and its relationship to disability in multiple sclerosis. PloS one 2012; 7(5): e37049.
16. MacKenzie-Graham A, Kurth F, Itoh Y, et al. Disability-Specific Atlases of Gray Matter Loss in Relapsing-Remitting Multiple Sclerosis. JAMA neurology 2016; 73(8): 944-53.
17. Han X, Wang X, Wang L, et al. Investigation of grey matter abnormalities in multiple sclerosis patients by combined use of double inversion recovery sequences and diffusion tensor MRI at 3.0 Tesla. Clinical radiology 2018; 73(9): 834.e17-.e23.
18. Bester M, Jensen JH, Babb JS, et al. Non-Gaussian diffusion MRI of gray matter is associated with cognitive impairment in multiple sclerosis. Mult Scler 2015; 21(7): 935-44.
Figures