3135
Three-dimensional reconstruction and dissection of hippocampal fiber pathways with human connectome data1Peking Union Medical College & Chinese Academy of Medical Sciences, Beijing, China, 2New York University School of Medicine, New York City, NY, United States
Synopsis
The hippocampus plays a vital role in learning and memory and consists of multiple subfields with distinct functional pathways. Despite many volumetric investigations, in vivo human studies on hippocampal pathways remain scarce. In this study, we show that the Perforant, Alveus/Fimbria, and CA1-Subiculum pathways can consistently reconstructed from the Human Connectome Project (HCP) diffusion MRI dataset aided by automated brain and hippocampal subfield segmentation methods. This demonstrates the feasibility of in vivo mapping of the major hippocampal pathways at 3T, which may lead to new research avenue of the functional pathways of hippocampus in normal and disease states.
Introduction
The human hippocampus plays a vital role in high-level cognitive functions including spatial navigation, emotions and long-term memory 1. Despite extensive studies on hippocampal volume, a compelling need exists to investigate hippocampal pathways and connections, which are critical for important circuit functions and mnemonic information flow. In this study, we used Human Connectome Project (HCP) 3T diffusion MRI (dMRI) dataset 2 and supervised automated fiber tractography approaches to reconstruct and dissect the internal fiber tract pathways of hippocampus. We hypothesize that the hippocampal microcircuits, which are not available on conventional MRI, can be revealed from the HCP data and will, more importantly, provide insights into the normal pattern of the hippocampal connectome.Materials and Methods
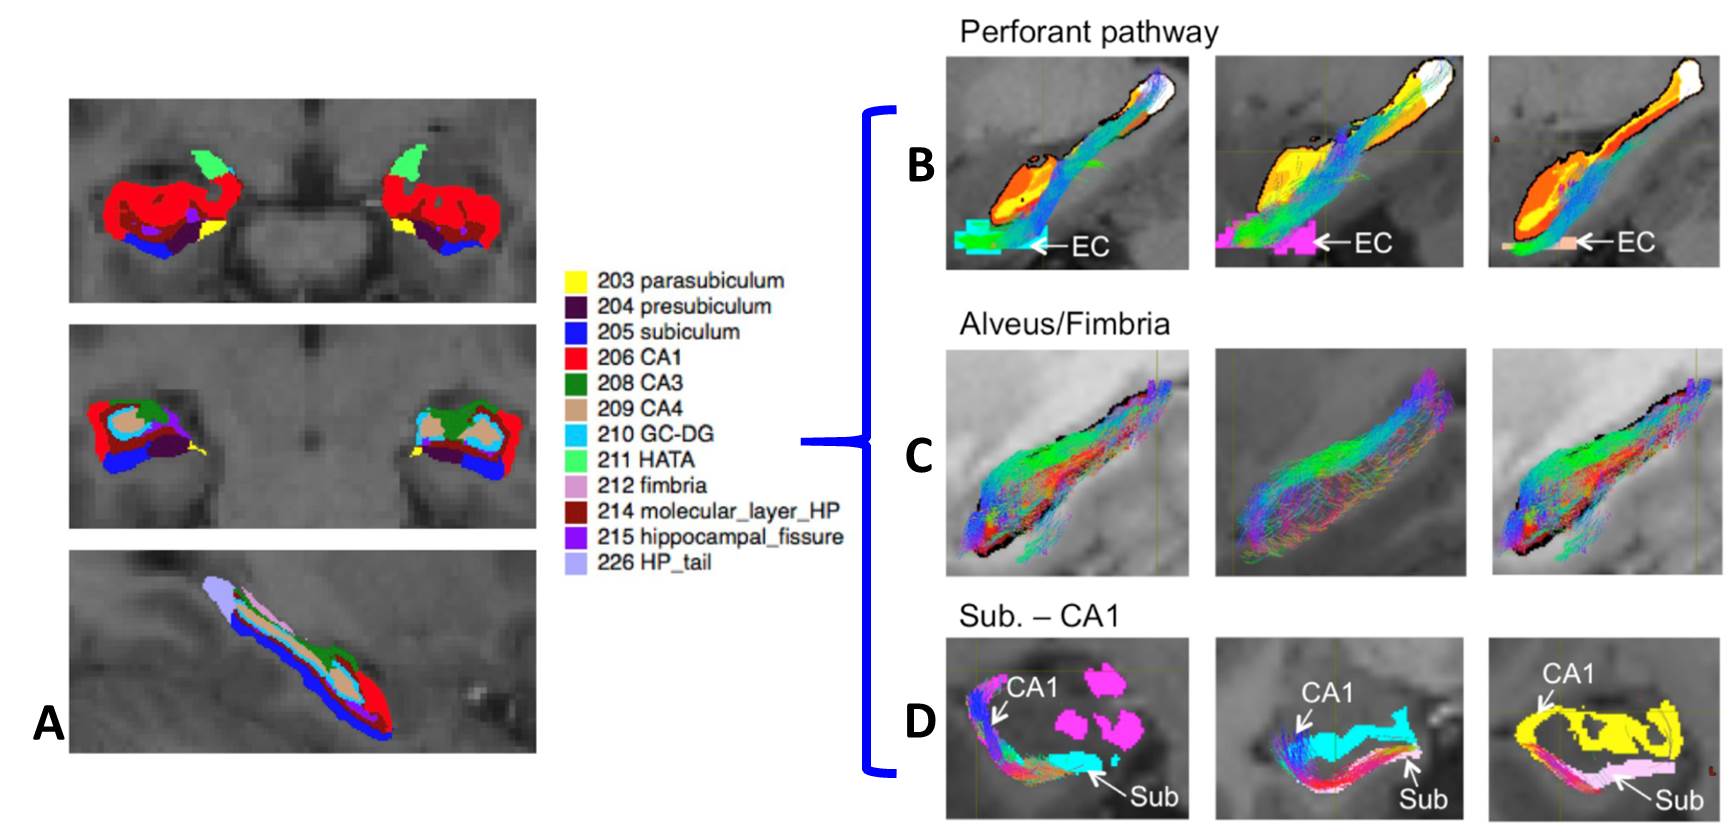
We used dMRI scans from 40 young adults (20 female, all right handed) scanned for the Human Connectome Project (WU-Minn HCP) of the young adult cohort 3,4 on Siemens 3-Telsa Connectome scanner. The protocol parameters were TR/TE=5520/89.5ms; 1.25mm isotropic voxels, and 3 shells of b=1000, 2000, and 3000 s/mm2 with 90 diffusion weighting directions from each shell. Voxel-wise fiber orientation distribution (FOD) 5,6 maps were reconstructed using MRtrix. The regions of interest for tractography were generated based on automated brain and hippocampal subfield segmentation on co-registered 3D T1-weighed images 7. The representative segmented images for the whole hippocampus, entorhinal cortex, and subfields include the CA1, CA3, CA4, dentate gyrus, and subiculum. Tractrography between these regions were performed using the probabilistic tractography method in MRtrix. Quantitative evaluations of tract volume and mean fractional anisotropy (FA) and mean diffusivity (MD) between fiber pathways were also performed. After comparison of different b-value results, data with b=2000 from HCP data showed the optimal results and were used for analysis in this study. Additionally, 3D dMRI data was acquired from a post-mortem sample of human hippocampus on a 7T animal scanner (Bruker) with higher spatial resolution (0.25 mm isotropic) that allows ex vivo mapping and validation of the inner hippocampal connectivity of the in vivo HCP data.Results
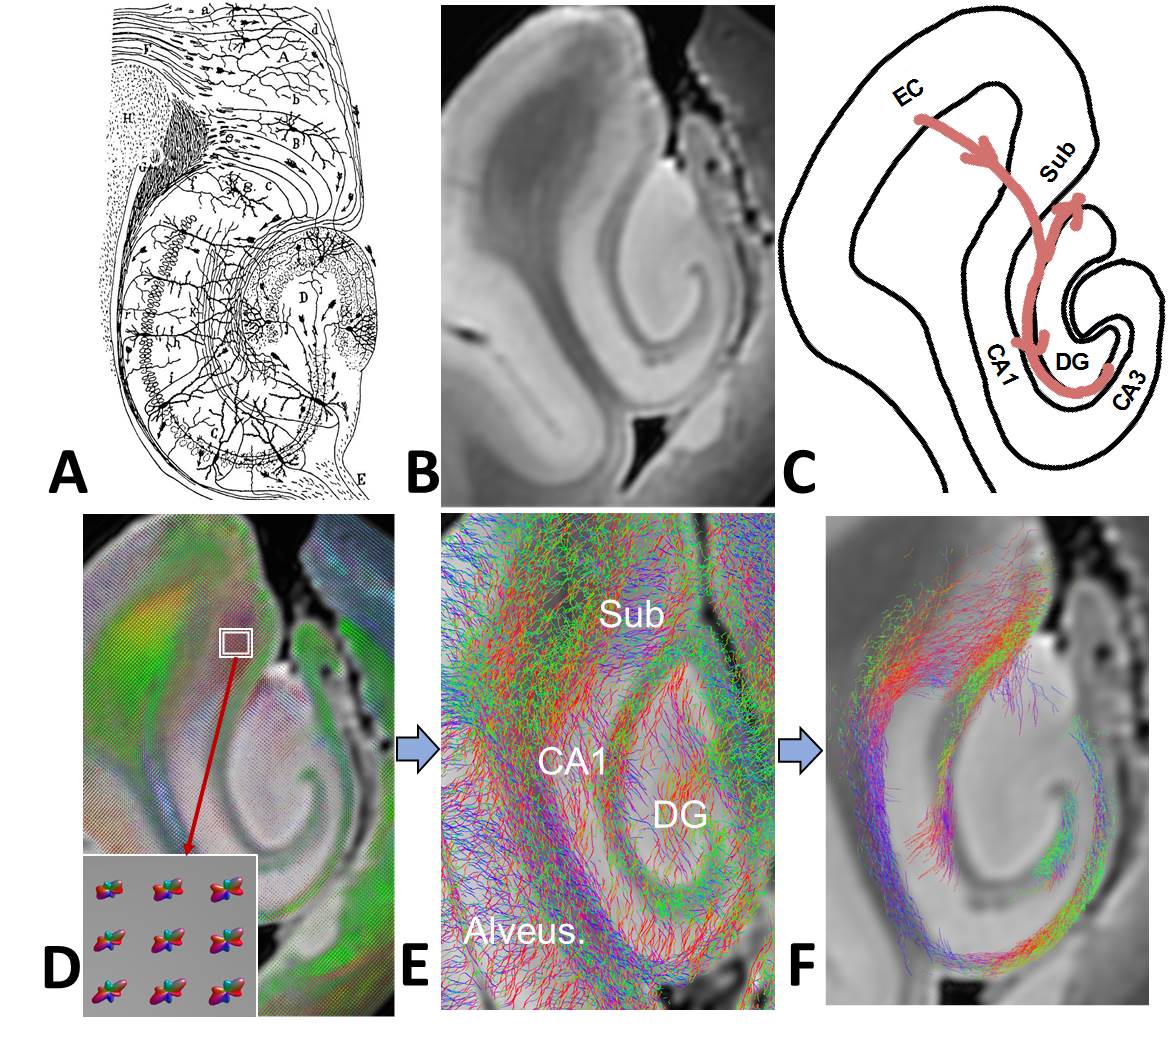
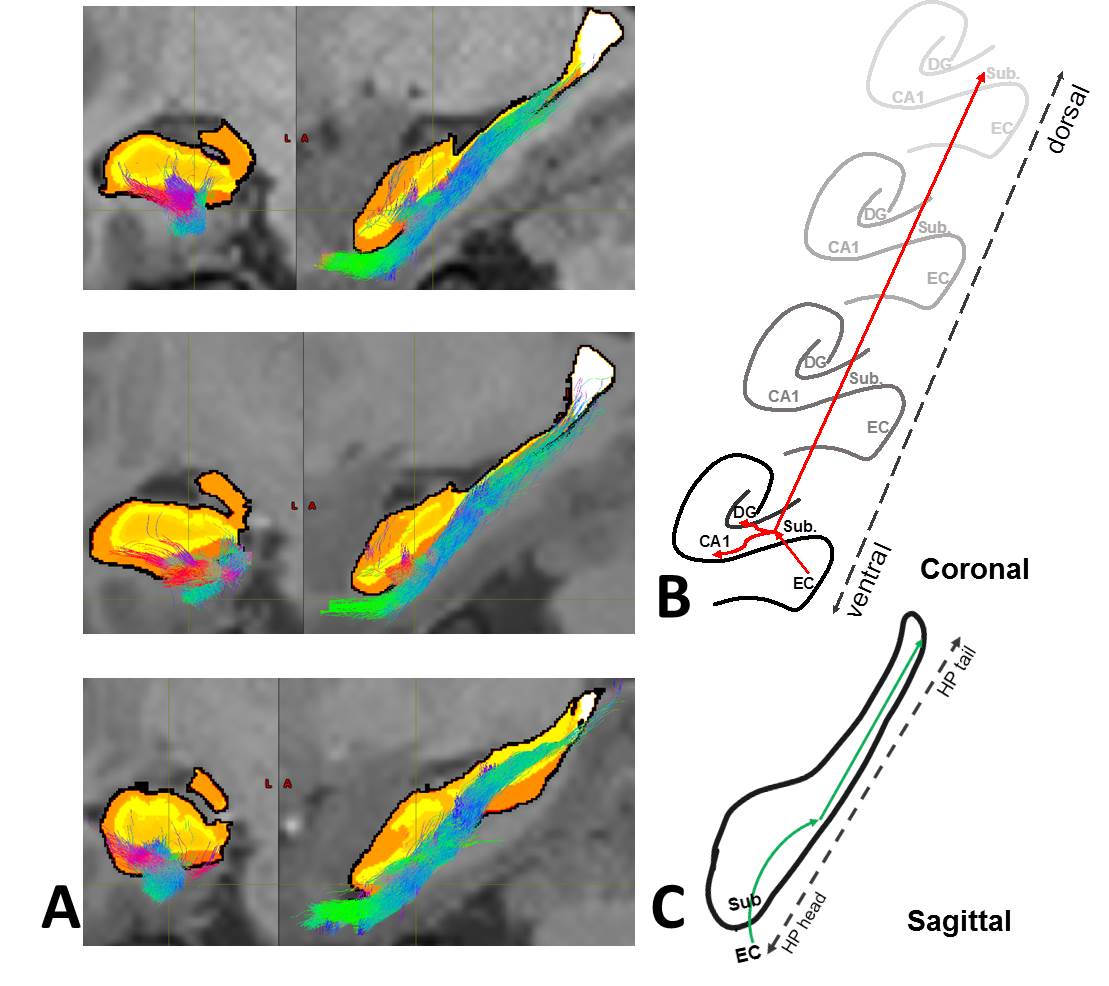
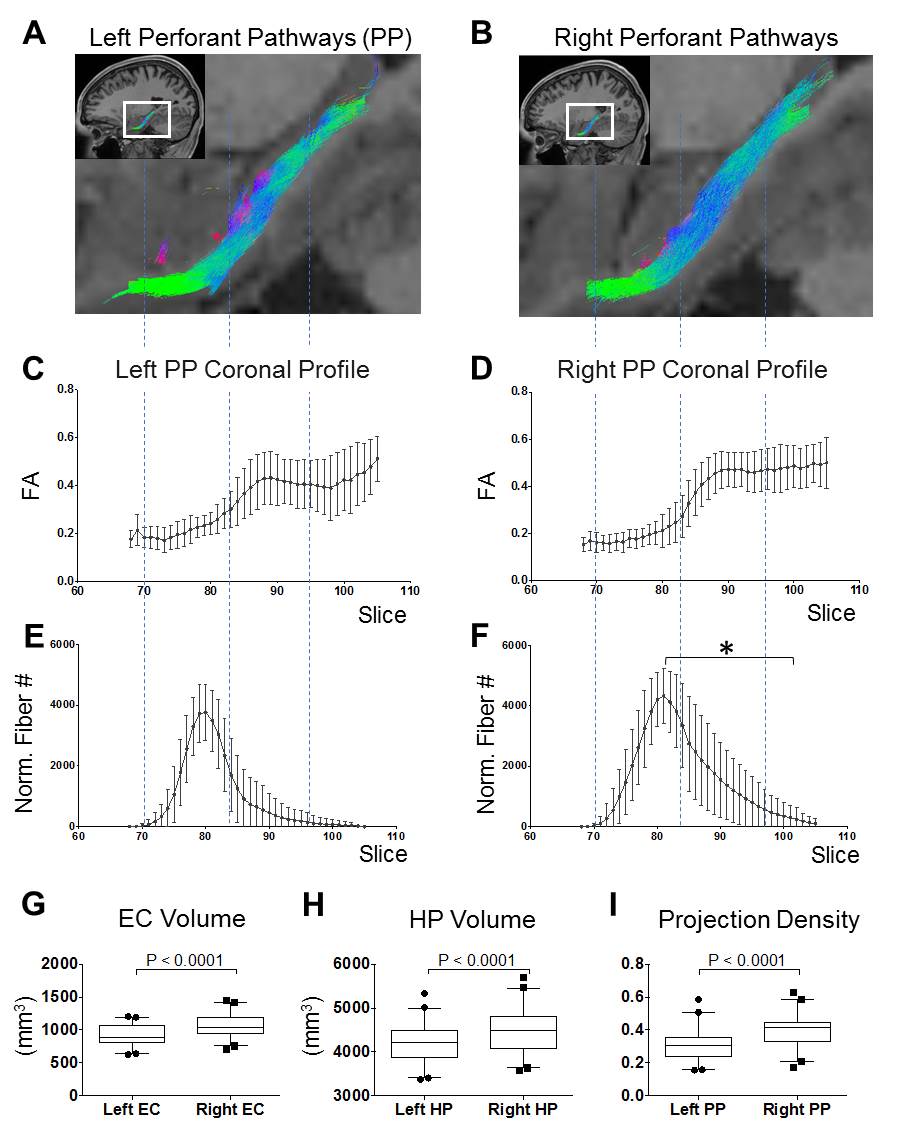
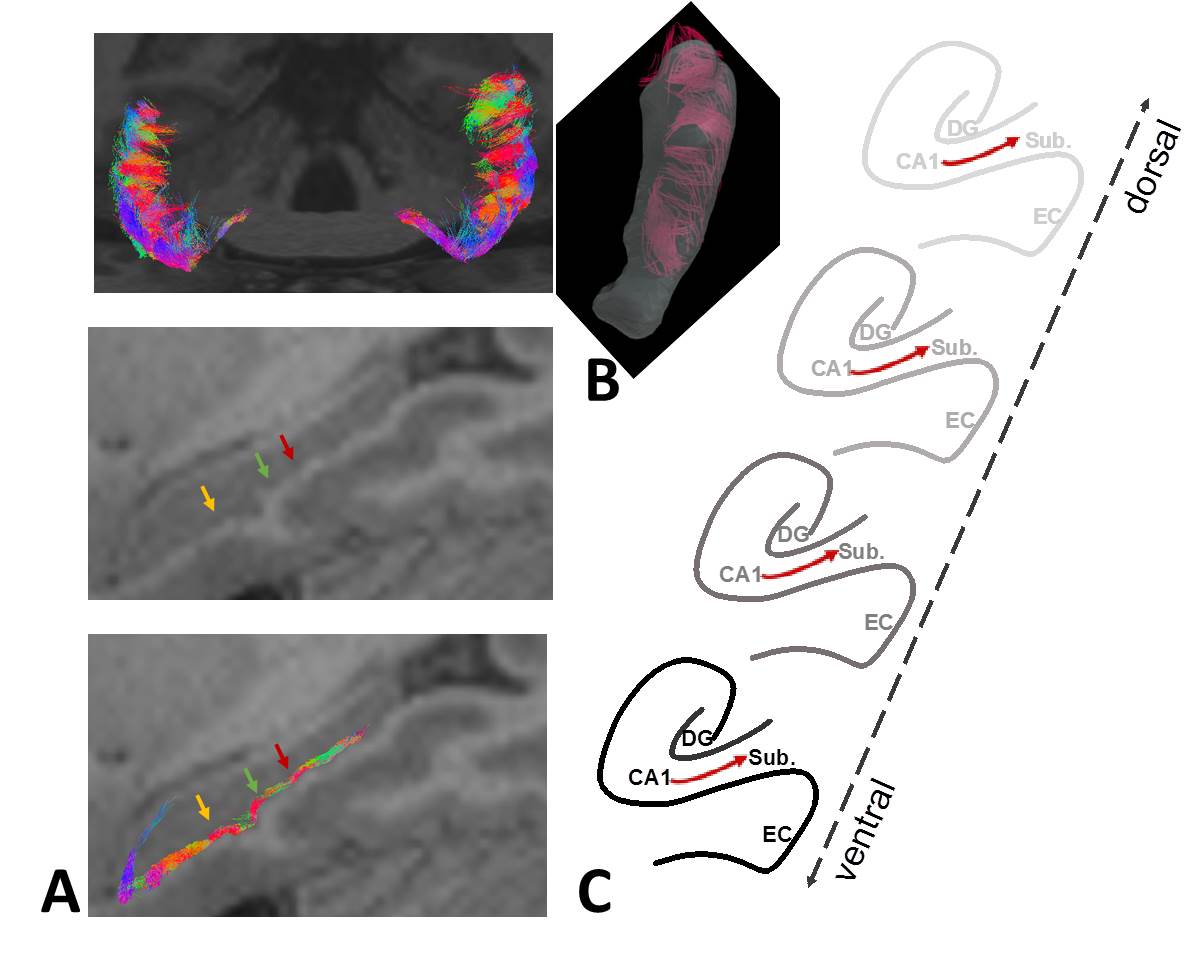
Post-mortem data (Figure 1B-D) show that the complex fiber architecture in the hippocampus can mostly be resolved by high-resolution diffusion MRI, as illustrated in Figure 1E, which can be then used to generate pathway-specific tractography (Figure 1F). The dissection of hippocampal fiber tracts using HCP dMRI data showed similar results (Figures 2 and 3). Three individual pathways within and connecting hippocampus were reliably identified: Perforant Pathway (PP), the Alveus, and CA1-Subiculum (CA1-Sub) pathways (Figure 2). For the PP bundles, Figure 4 showed the quantitative distribution of FA and the normalized number of fiber tracts along longitudinal course of PP. There seemed to be significantly higher volume of entorhinal cortex (EC) and hippocampus, as well as fiber projection density of PP on the right side as compared to left side in these participants who all claim right-handedness. For the CA1-Sub pathway, there is a characteristic pattern of multiple fiber clusters with bumpy ridges projected from the longitudinal base of hippocampus (Figure 5), which may be associated with the specific morphological signature of hippocampal dentation 8. However, not all fiber tracts (e.g., mossy fibers, Schaffer collaterals) could be consistently identified in each individual.Discussion
The ability to reconstruct the major hippocampal pathways non-invasively with dMRI is important to study the hippocampal circuits that are not available on conventional MRI. In our approach, the accuracy of the subfield segmentation will directly affect our tractography ability to separate the target pathways from intermingled axonal and dendritic networks in the hippocampus. The high resolution HARDI dataset from HCP is also important to resolve crossing fibers common in the hippocampus. Even though we demonstrate the feasibility to reconstruct several hippocampal pathways in normal subjects, it remains to be investigated whether the same approach can be used to study patients with hippocampal atrophy as well as the optimal resolution and acquisition parameters.Conclusion
Based on high-resolution HCP dataset and automated brain segmentation, we were able to dissect several continuous hippocampus pathways and estimate diffusion characteristics along its trajectory. In vivo characterization of the intra-hippocampal circuits is critical in Alzheimer’s disease (AD)-related research and may provide a biomarker for early detection of AD pathology in the hippocampus before morphological and clinical presentations become apparent.Acknowledgements
Data were provided by the Human Connectome Project, WU-Minn Consortium (Principal Investigators: David Van Essen and Kamil Ugurbil; 1U54MH091657) funded by the 16 NIH Institutes and Centers that support the NIH Blueprint for Neuroscience Research; and by the McDonnell Center for Systems Neuroscience at Washington University.
This work was partly supported by NIH Brain Initiative grants (R01 EB025133, R01 EB025133 02S1), and Alzheimer’s Association Research Grant AARG-17-533484. This work was also performed under the rubric of the Center for Advanced Imaging Innovation and Research (CAI2R, www.cai2r.net), a NIBIB Biomedical Technology Resource Center (NIH P41 EB017183).
References
1. Bird CM, Burgess N. The hippocampus and memory: insights from spatial processing. Nature Reviews Neuroscience volume 9, pages 182–194 (2008).
2. Setsompop K, Kimmlingen R, Eberlein E, et al. Pushing the limits of in vivo diffusion MRI for the Human Connectome Project. Neuroimage 2013; 80: 220–233.
3. Van Essen DC, Smith SM, Barch DM, et al. The WU-Minn Human Connectome Project: an overview. Neuroimage 2013; 80: 62–79.
4. Behrens TEJ, Berg HJ, Jbabdi S, et al. Probabilistic diffusion tractography with multiple fibre orientations: what can we gain? Neuroimage 2007; 34: 144–155.
5. Sotiropoulos SN, Moeller S, Jbabdi S, et al. Effects of image reconstruction on fiber orientation mapping from multichannel diffusion MRI: Reducing the noise floor using SENSE. Magnetic Resonance in Medicine 2013; 70:1682–1689.
6. Peled S, Friman O, Jolesz F, Westin C-F. Geometrically constrained two-tensor model for crossing tracts in DWI. Magn Reson Imaging 2006; 24: 1263–1270.
7. Iglesias, J.E., Augustinack, J.C., Nguyen, K., et al. A computational atlas of the hippocampal formation using ex vivo, ultra-high resolution MRI: Application to adaptive segmentation of in vivo MRI. Neuroimage, 115, July 2015, 117-137.
8. Beattie JF, Martin RC, Kana RK et al, Hippocampal Dentation: Structural Variation and its Association with Episodic Memory in Healthy Adults. Neuropsychologia. 2017 July 01; 101: 65–75.
Figures