3134
Hippocampal subfield segmentation and partial volume effects - reliability assessment1German center for neurodegenerative diseases (DZNE), Magdeburg, Germany, 2Institute of cognitive neurology and dementia research, Magdeburg, Germany, 3Aging & Cognition Research Group, German center for neurodegenerative diseases (DZNE), Magdeburg, Germany, 4Department of Biomedical Magnetic Resonance, Otto-von-Guericke University, Magdeburg, Germany, 5Department of clinical sciences, Clinical memory research unit, Malmoe, Sweden, 6Center for Behavioral Brain Sciences, Magdeburg, Germany, 7Leibniz Institute for Neurobiology, Magdeburg, Germany
Synopsis
The hippocampus is involved in a variety of cognitive and functional tasks. Research groups rely on volumetric segmentations to assess: the integrity of the HC and its subfields as well as their involvement in cognitive tasks. Unfortunately, due to its size and location, most studies use non-isotropic T2-weighted images to segment the HC. The aim of this project is to determine whether partial volume effects due to T2-weighted slice angulation and non-isotropic resolution have an impact in the segmentation process. The results indicate that both, angulation and non-isotropic acquisition have a significant impact in specific subfields.
Introduction
During the last years the hippocampus (HC) and its subfields have attracted the attention of the neuroscientific community interested in unveiling their role in cognitive processes, as well as in neurodegeneration [1, 2, 3]. Numerous efforts have been made in order to establish reliable automated [4, 5] as well as manual [6, 7] segmentation routines. Segmentation algorithms and manual strategies typically rely on T2-weighted images, which due to size, shape, location of the HC together with limitations in the acquisition time, unfortunately cannot be acquired with isotropic resolution. Being aware of potential partial volume effects, scientists try to pilot the T2-weighted slices "perpendicular" to the HC’s longitudinal axis. Nevertheless, since both HC are not parallel to each other it is impossible to pilot a slice perpendicular to both. The purpose of this study is to assess the dependence of HC segmentation on partial volume effects derived from T2-weighted slice angulation and non-isotropic resolution.Methodology
T1 and T2-weighted 0.45 mm isotropic whole-brain images from a total of 8 subjects were acquired using a 7T Siemens MR system (Erlangen, Germany) using a 32 channels head coil and prospective motion correction [8] (acquisition details in fig. 1). To simulate different acquisition orientation, we took the sampling grid from a standard T2-weighted slab acquisition (0.4x0.4x1.1 mm) parametrically applied rotation transform to the grid coordinates and (sub-) sampled the ultra high resolution 0.45 mm isotropic whole brain T2-weighted image. Half voxel size Gaussian filter was applied to approximate down-sampling point spread function and avoid alias effect. Rotation angles between -30 and 30 degrees in steps of 5 degrees were applied to the original grid coordinates to simulate different angulations between the HC's longitudinal axis and the T2-weighted coronal orientation. Similarly images were subsampled along the slice direction with thickness values between 0.45 and 1.80 mm in steps of 0.45 mm. All images (408 rotated and resampled + 8 original sets) were then submitted to ASHS [4] in order to generate HC segmentations based on a predefined anatomical template [7]. The segmentations generated using the original images; isotropic 0.45 resolution and no angulation were used as reference values. Volume ratios (measured volume/reference volume) were generated for each rotation angle and slice thickness values. To assess volume variability as a function of angulation, the measured volume ratios at -10 and +10 degrees with slice thickness values of 1.80 mm were compared using Kruskal-Wallis non parametric test. Similarly, to investigate the influence of partial volume effects, the volumes ratios measured at -5 degrees with isotropic resolution were compared using Kruskal-Wallis to those acquired at -5 degrees using a slice thickness of 1.80 mm (most similar to values currently used in clinical and research studies).
Results
The effects of image resampling and rotation can be seen in figure 2. Figure 3 illustrates how different HC subfields and cortical areas present different levels of vulnerability to partial volume effects. Significant differences when comparing volume ratios measured using isotropic resolution versus 0.45x0.45x1.8 mm resolution were found in: CA2, dentate gyrus (DG), Tail, subiculum (Sub), entorhinal cortex (ErC), A35, A36 and parahipocampal cortex (PhC), all with p<0.05. Similarly, significant differences in volume ratio due to angulation were detected in CA3, A35 and PhC also with p<0.05.Discussion
The results indicate that segmented masks generated by ASHS suffer from partial volume effect, an inherent characteristic of MR anisotropic acquisitions. Normally, in clinical and research studies the T2-weighted sequence used to segment the HC is acquired using highly anisotropic resolutions e.g. 0.45x0.45.2 or 0.5x0.5x1.5 in the case of ADNI and DELCODE respectively. In this study, we have demonstrated how the volume of some HC’s subfields depends on the angulation of the T2-weighted slice with respect to the HC’s longitudinal axis; fact that should be taken into account in longitudinal studies. A difference in angulation between longitudinal measurements could bias the volume comparison between time points and therefore lead researchers in the wrong direction. For this reason we encourage researchers to report volumes together with the angulation of the T2-weighted slice with respect to HC’s longitudinal axis. Similarly, we found regions of interest in which the volume measured using anisotropic resolution was up to 40% larger than its isotropic counterpart, which might be relevant for researchers focused in correlating histological and MR measurements.Acknowledgements
The authors would like to thank the Combinatorial Neuroimaging Core Facility at the Leibniz Institute for Neurobiology in Magdeburg for their support as well as the volunteers for their participation.References
1.- Berron et al - Neurobiol Aging. 2018 May;65:86-97. doi: 10.1016/j.neurobiolaging.2017.12.030. Epub 2018 Jan 31.
2.- Berron et al - J Neurosci. 2016 Jul 20;36(29):7569-79. doi: 10.1523/JNEUROSCI.0518-16.2016.
3.- Maass et al - Nat Commun. 2014 Nov 26;5:5547. doi: 10.1038/ncomms6547.
4.- Yuskevich et al - Hum Brain Mapp. 2015 Jan;36(1):258-87. doi: 10.1002/hbm.22627. Epub 2014 Sep 2.
5.- Iglesias et al - Neuroimage. 2015 Jul 15;115:117-37. doi: 10.1016/j.neuroimage.2015.04.042. Epub 2015 Apr 29.
6.- Wisse et al - Neuroimage. 2012 Jul 16;61(4):1043-9. doi: 10.1016/j.neuroimage.2012.03.023. Epub 2012 Mar 14.
7.- Berron et al - Neuroimage Clin. 2017 May 26;15:466-482. doi: 10.1016/j.nicl.2017.05.022. eCollection 2017
8.- Maclaren et al - PLoS One. 2012;7(11):e48088. doi: 10.1371/journal.pone.0048088. Epub 2012 Nov 7.
Figures
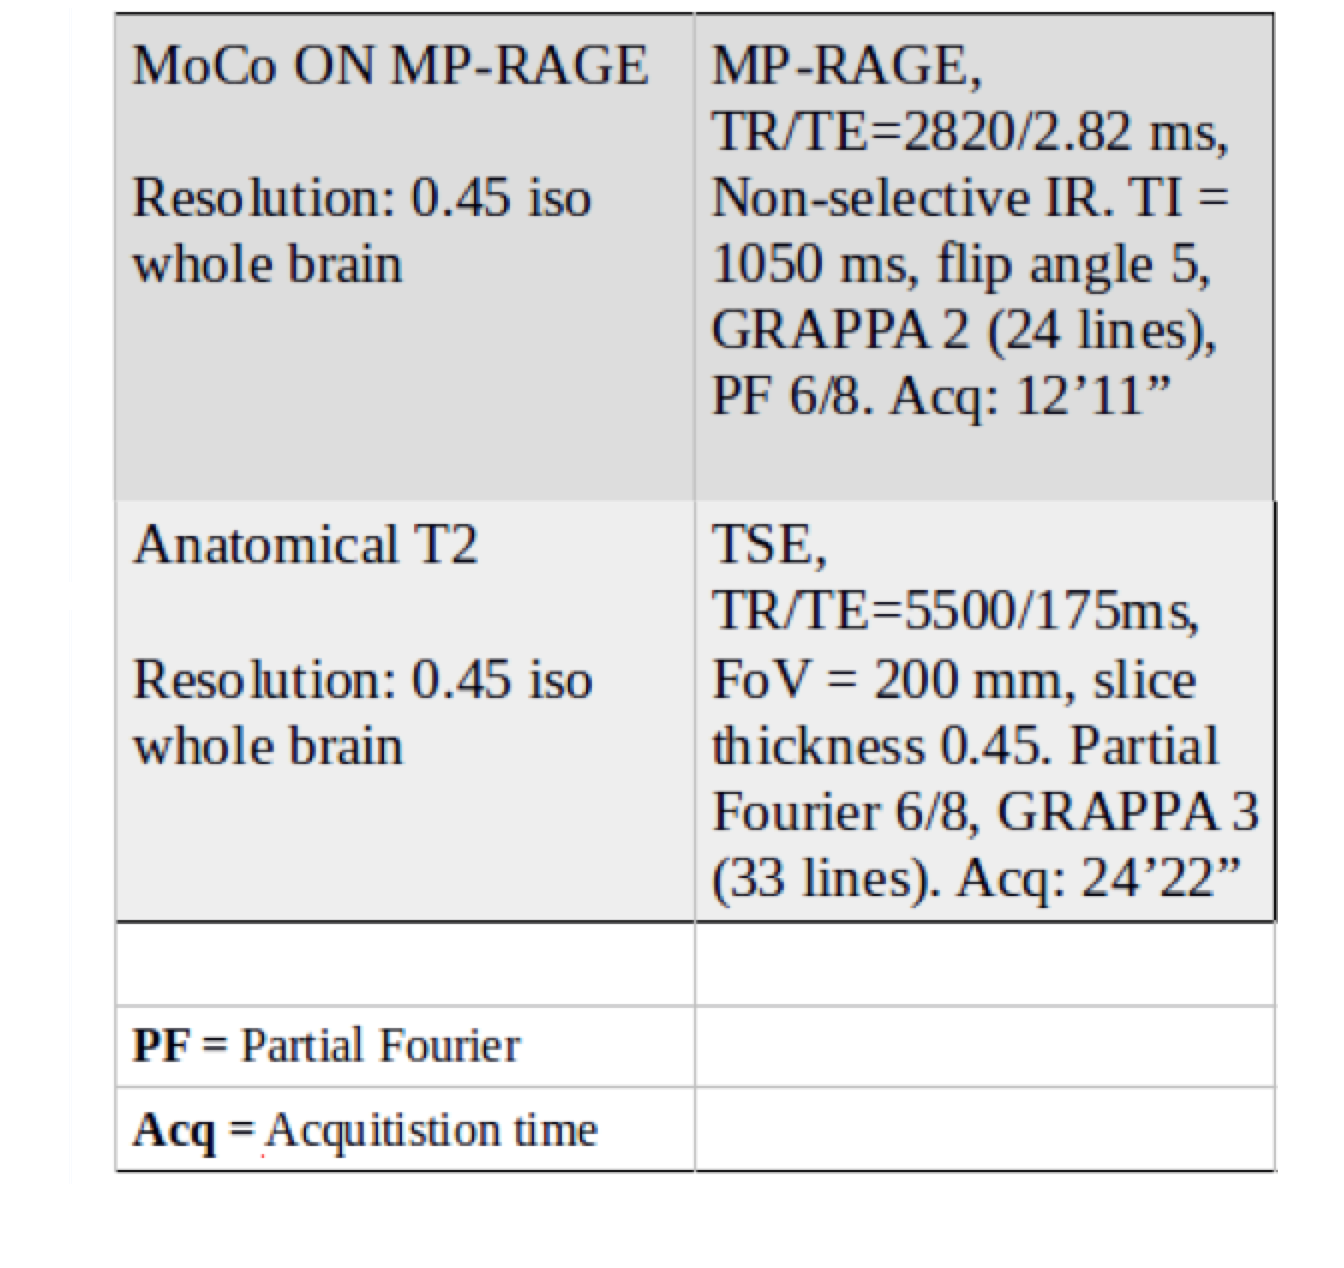
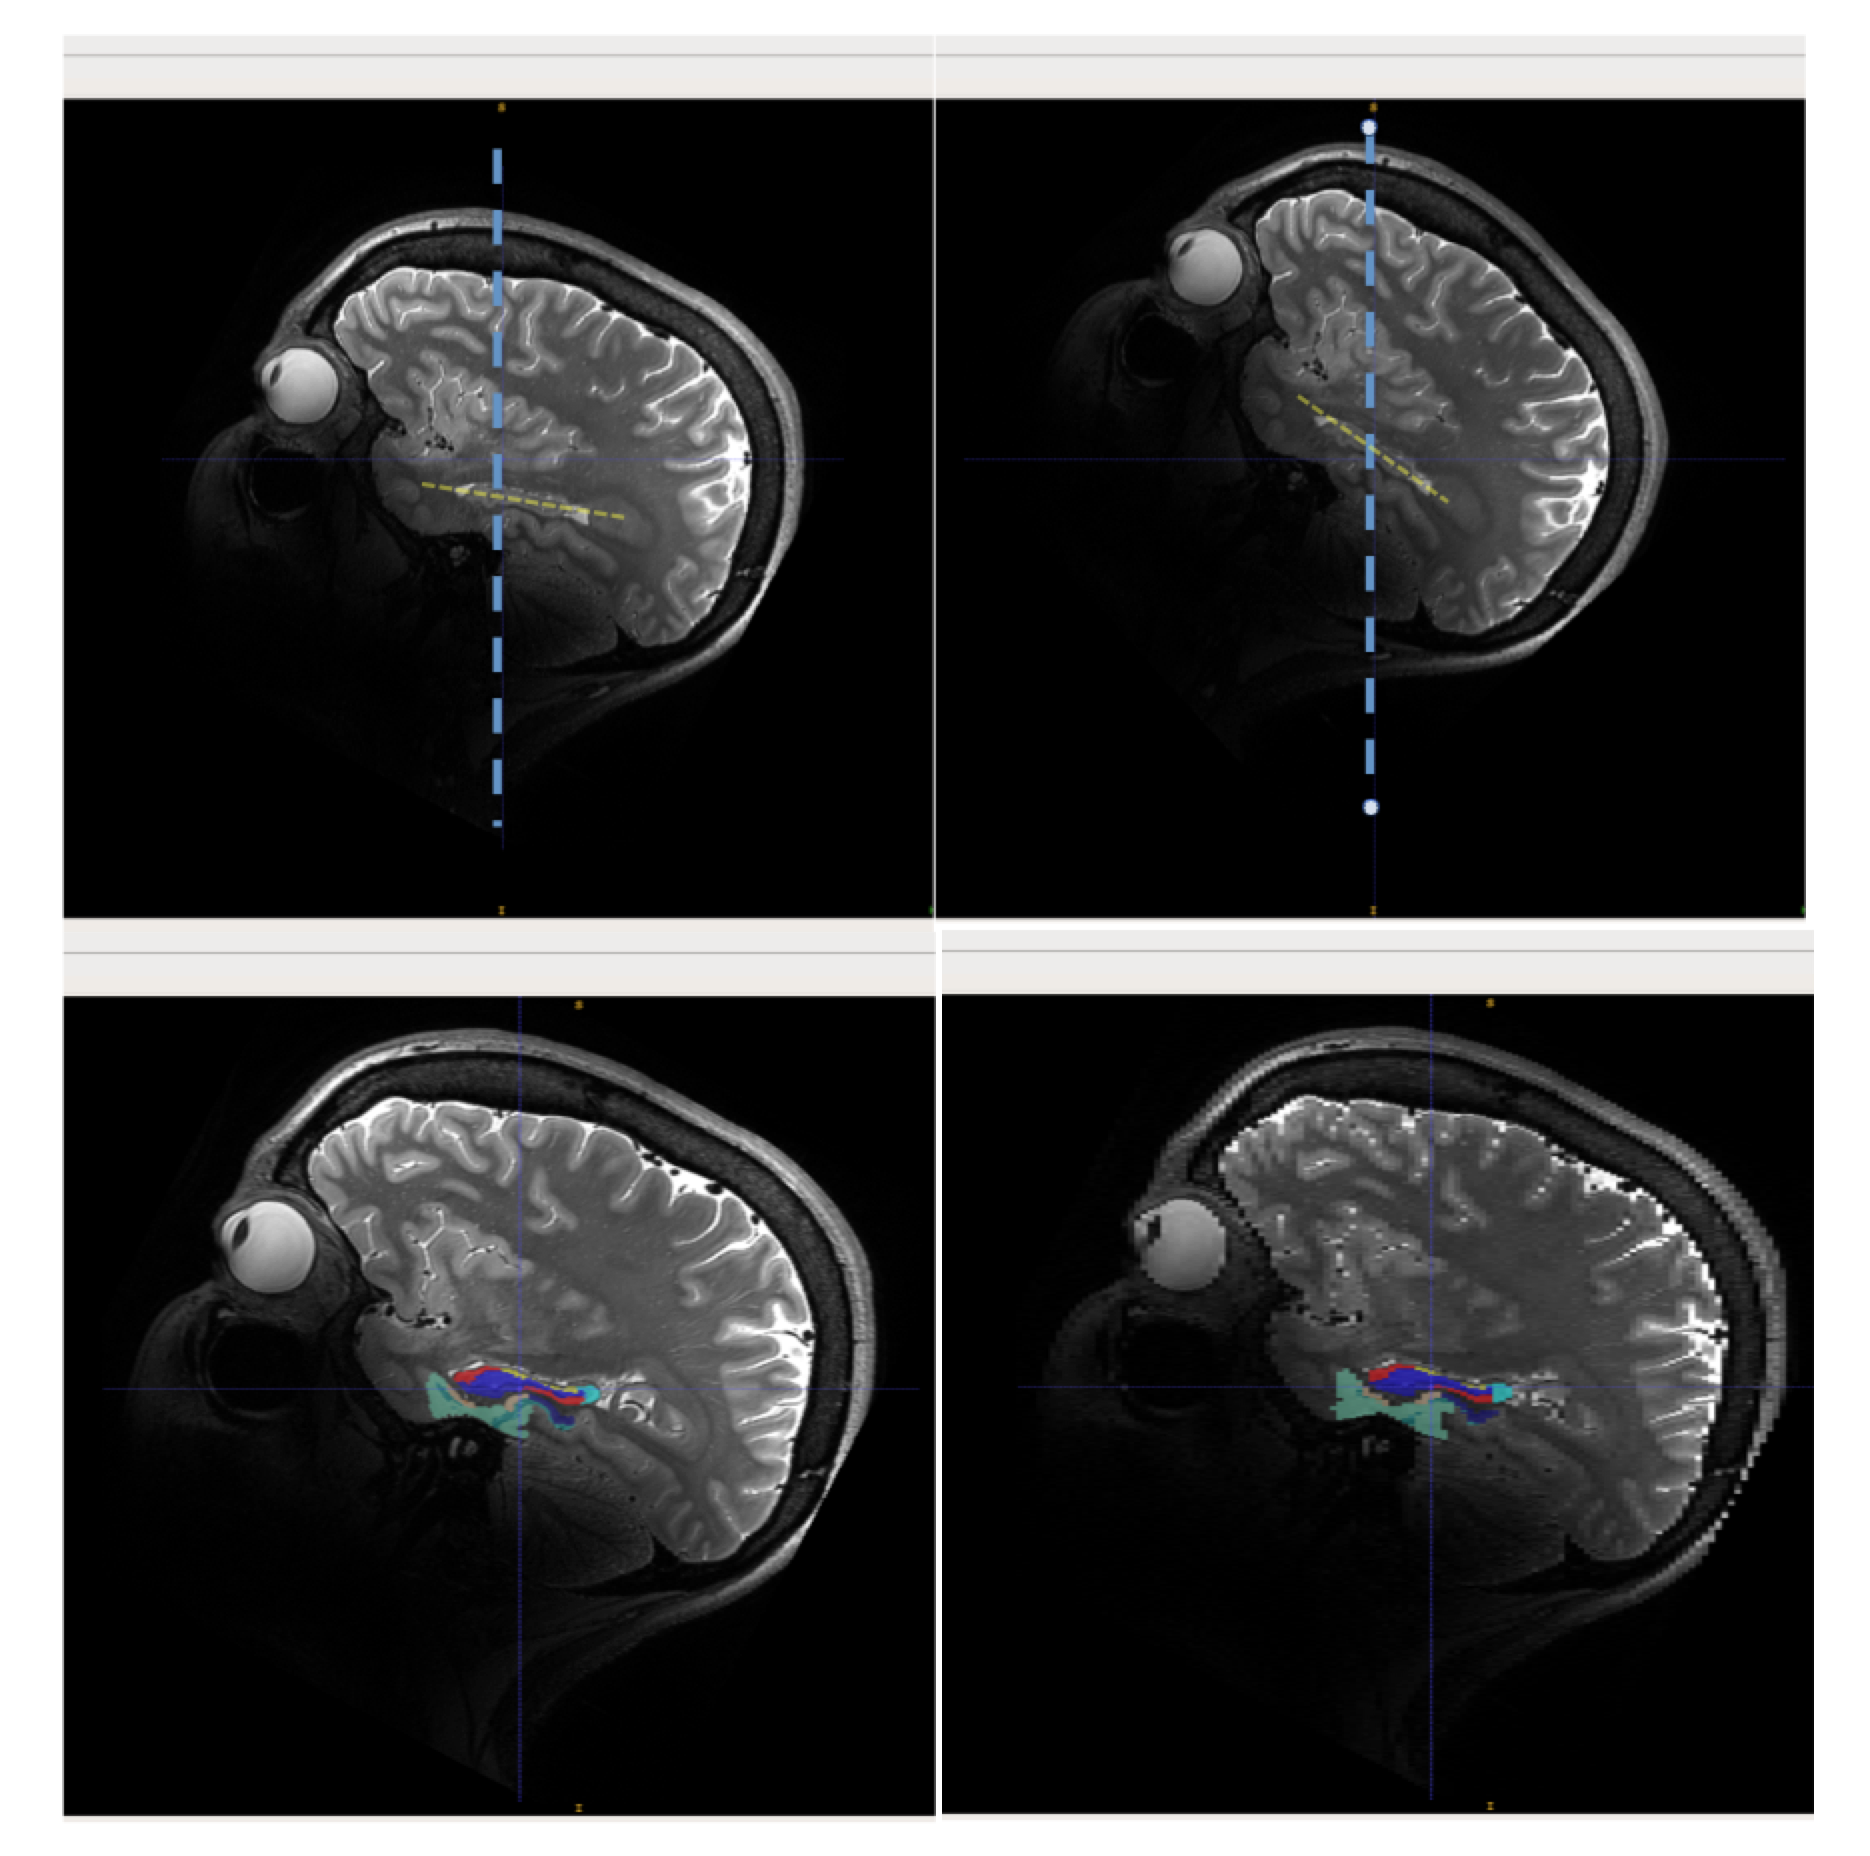
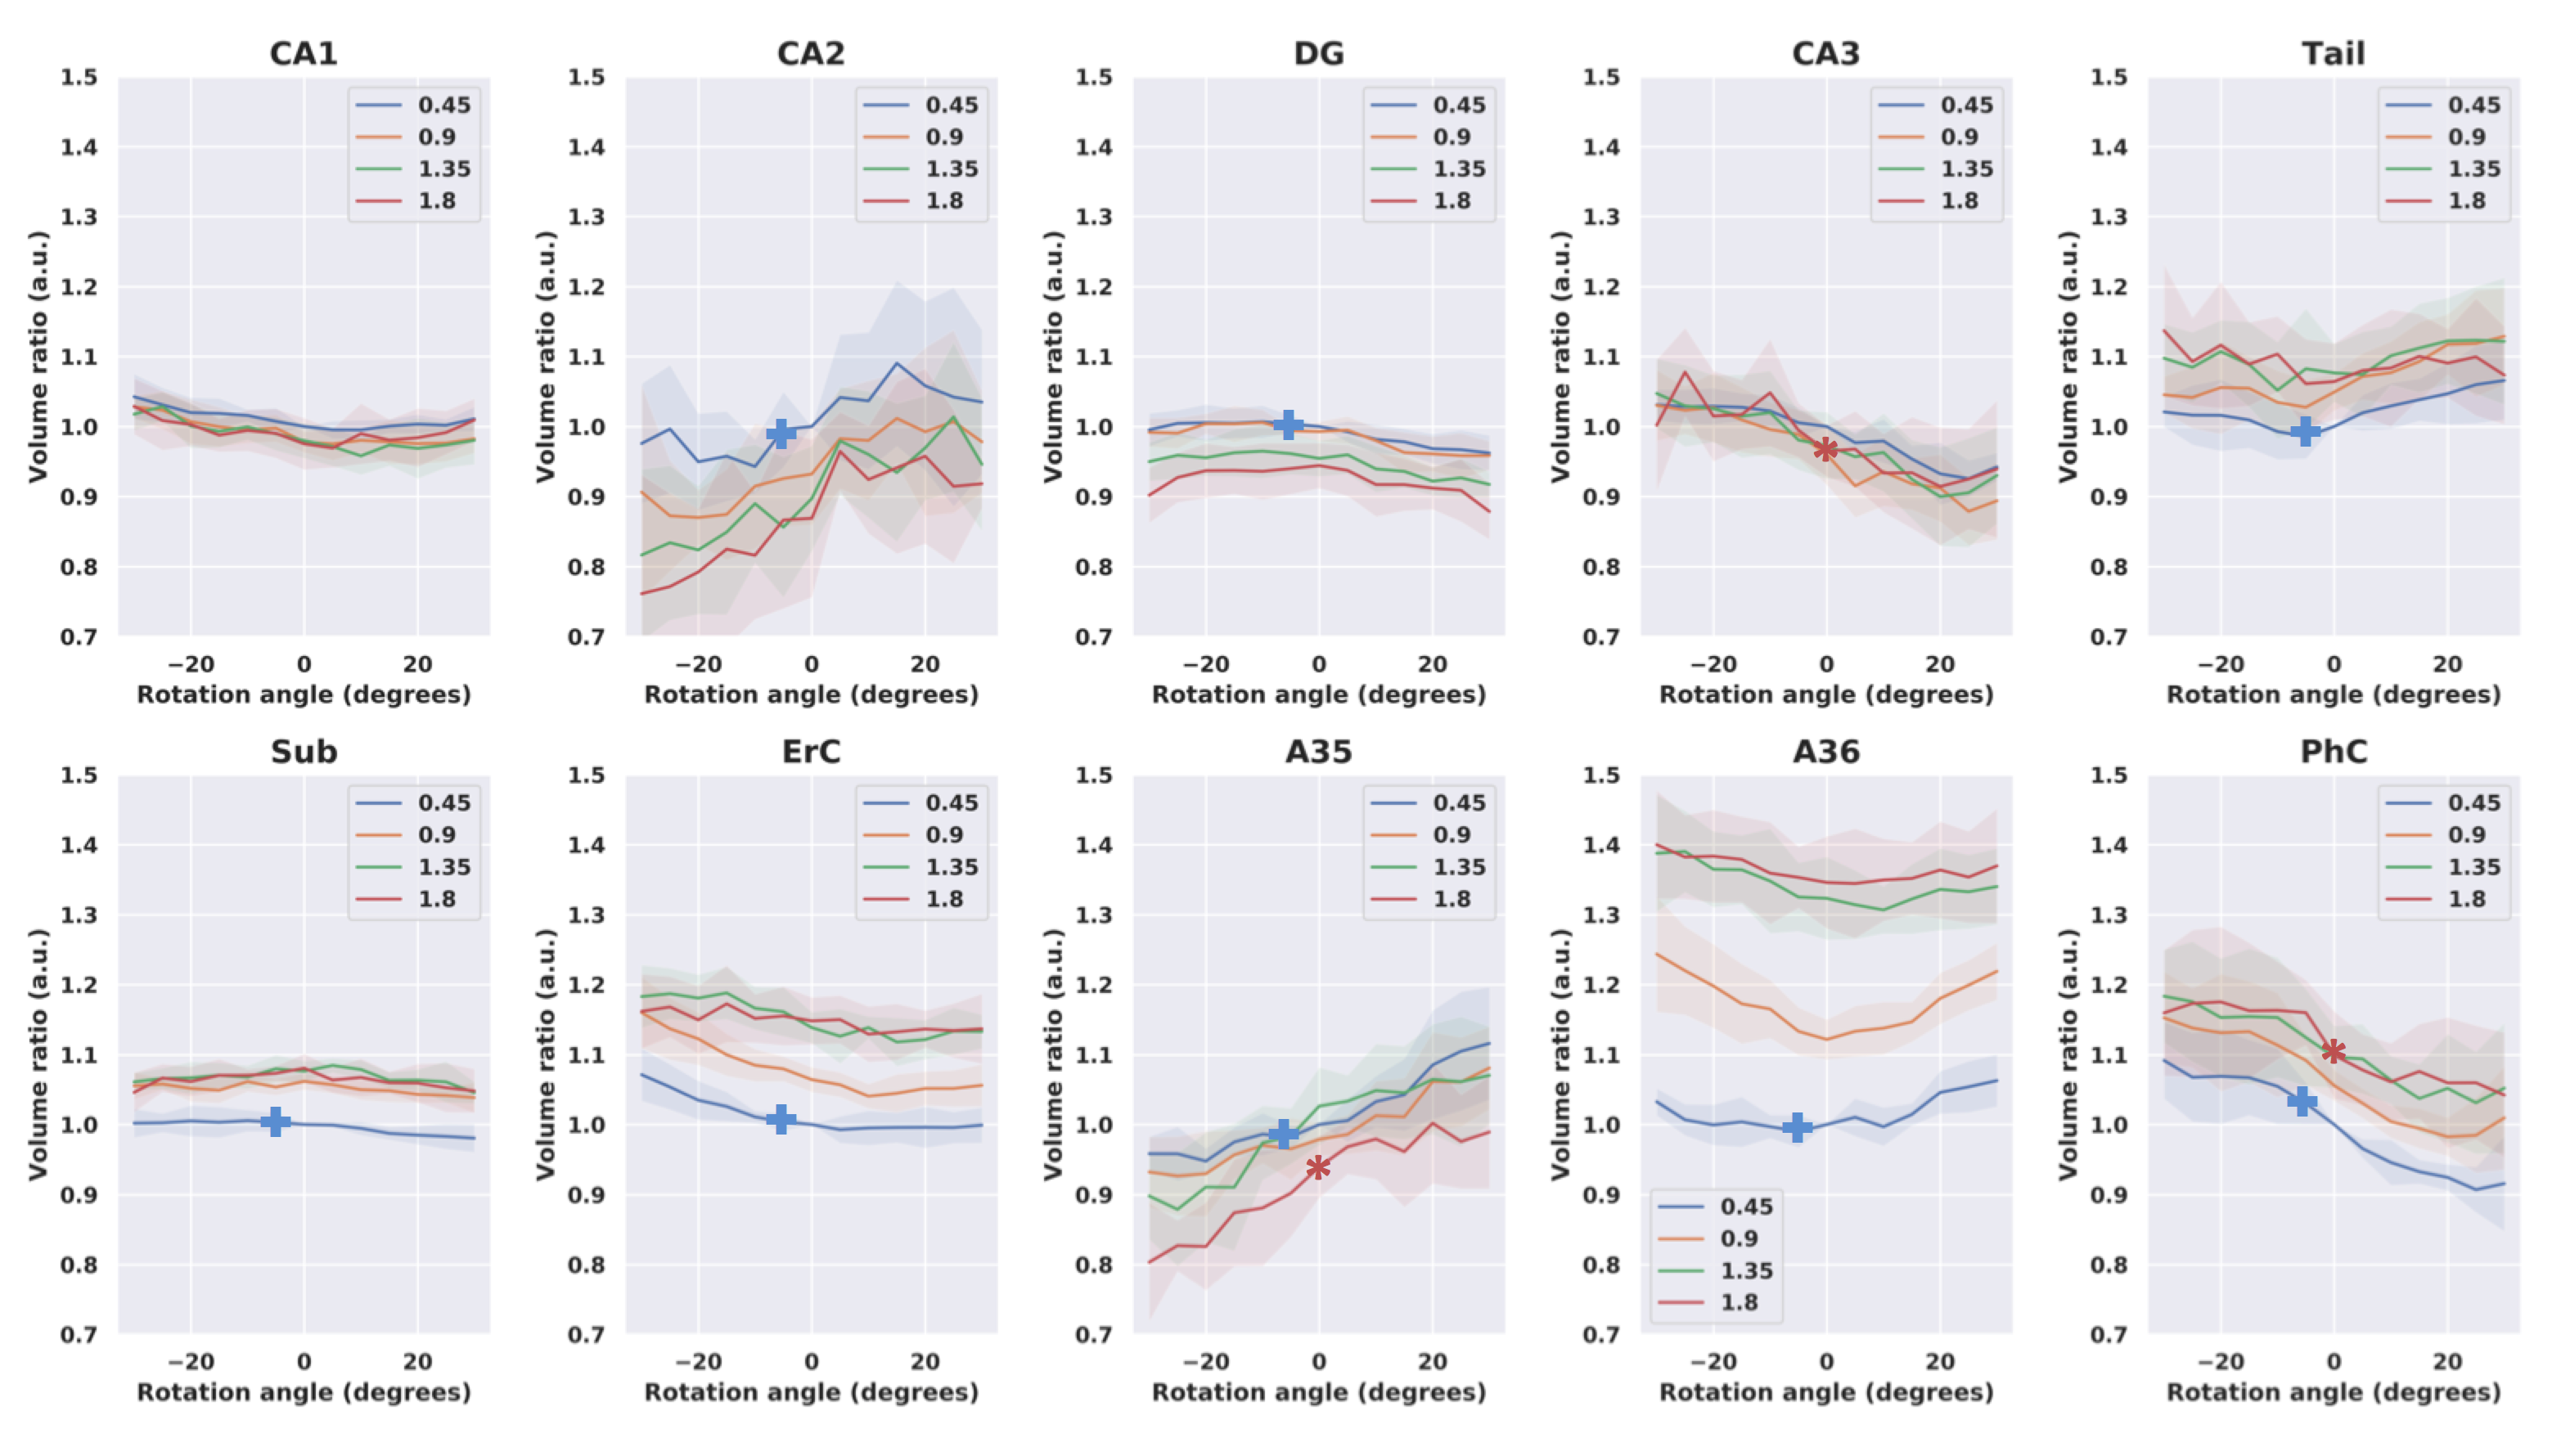
Figure 3: Volume ratios as a function of rotation angle for isotropic and different levels of anisotropic resolutions, denoted in different colors, measured in the different regions of interest generated by ASHS. Significant differences in volume between isotropic and 0.45x0.45x1.80 mm resolution for each of the regions of interest are denoted by a blue cross. Regions where, under the most anisotropic resampling (slice thickness 1.80 mm), a significant variation in volume was measured between -10 and 10 degrees rotation angles are denoted by a red star.