3131
Sub-millimeter blood flow mapping of cortical and hippocampal gray matter1Centre for Functional Metabolic Mapping, Robarts Research Institute, University of Western Ontario, London, ON, Canada, 2Department of Cognitive Neuroscience, Maastricht University, Maastricht, Netherlands, 3Brain and Mind Institute, University of Western Ontario, London, ON, Canada, 4Department of Medical Biophysics, Schulich School of Medicine and Dentistry, University of Western Ontario, London, ON, Canada, 5Center for Neuroscience Imaging Research, Institute for Basic Science (IBS) & Department of Biomedical Engineering, Sungkyunkwan University, Suwon, Korea, Republic of
Synopsis
Acquisition of sub-millimeter whole-brain blood flow (CBF) maps was recently demonstrated to be feasible using 7T MRI. Here, we show that such high resolution CBF maps can be used to differentiate cortical regions, in general, and subregions within the hippocampal formation, in particular. We found that higher baseline perfusion was especially present in regions known to be highly myelinated and/or characterized by low quantitative T1 values. Moreover, these initial results warrant the use of CBF data to improve the interpretability of fMRI activation maps at a finer scale.
Introduction
High-quality human whole-brain 0.7 mm3 isotropic resolution cerebral blood flow (CBF) mapping using arterial spin labeling (ASL) has been demonstrated using 7T MRI [1]. Sub-millimeter baseline CBF can potentially be used for cortical parcellation into distinct brain areas [2], as well as fine characterization and/or differentiation of sub-areas based on differences in perfusion and, therefore, in their vascular density [3]. Here, we demonstrate the use of such high-fidelity CBF map for cortical surface mapping of perfusion and evaluate its utility with regards to detection of possible differences across subregions of the hippocampal formation using a recently published coordinate system [4].Methods
Acquisition: All data were acquired on a whole-body 7T MRI scanner (Siemens Healthineers) with a 32-channel receive head-coil (Nova Medical) on one female volunteer (20 yr) during 12 separate sessions. Each session contained at least six arterial spin labeling (ASL) runs positioned at different locations across the brain to measure CBF in the most efficient manner. In addition, whole-brain 0.7 mm3 quantitative T1 and B1+ maps were obtained. For further acquisition details, see Fig. 1. Dielectric pads were placed proximal to the temporal lobe area to locally increase the transmit B1+ field and to improve the labeling efficiency [7].
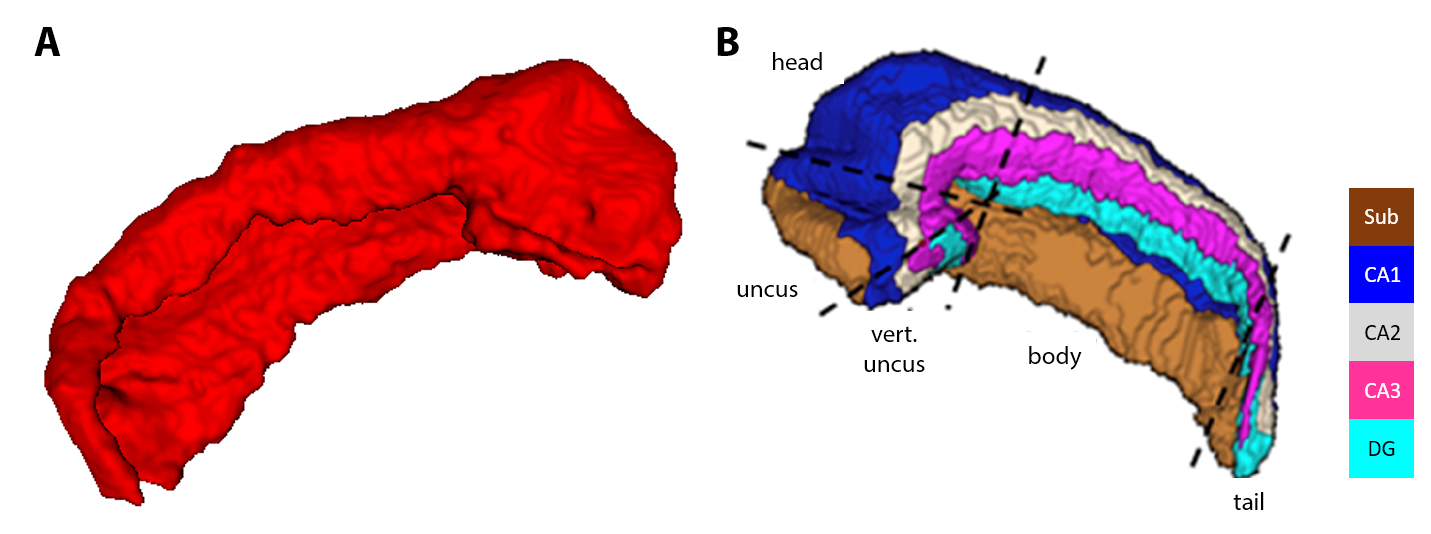
Analyses: B1+-corrected MP2RAGE data were obtained using the code and procedure as described in [5], and the corrected T1w volume was then used for automatic cortical surfaces reconstruction using FreeSurfer (v6.0). A distortion-matched IR-EPI T1 map was coregistered to the MP2RAGE T1 map using ANTs non-linear transformations [8]. The resulting warp field was then used for transforming the CBF map to the MP2RAGE data for mapping baseline perfusion onto the surface to allow comparison across cortical regions, as defined using a multimodal brain atlas [9]. Finally, the hippocampal formation was manually segmented in the upsampled (0.3 mm3) IR-EPI T1 map, for unfolding and mapping of hippocampal CBF using an in-house developed coordinate system [4].
Results
Clear differences in baseline perfusion can be observed across the cortex, see Fig. 2 (only left hemisphere is shown). Here, the primary (i.e. highly myelinated) cortical areas, especially the somatosensory and motor cortices (shown in green regions in Fig. 3) as well as the visual cortex (in blue), were characterized by higher baseline perfusion levels. Note that CBF was artificially low in the inferior parts of the temporal and frontal lobes (most dark brown regions) due to lower (temporal) SNR.
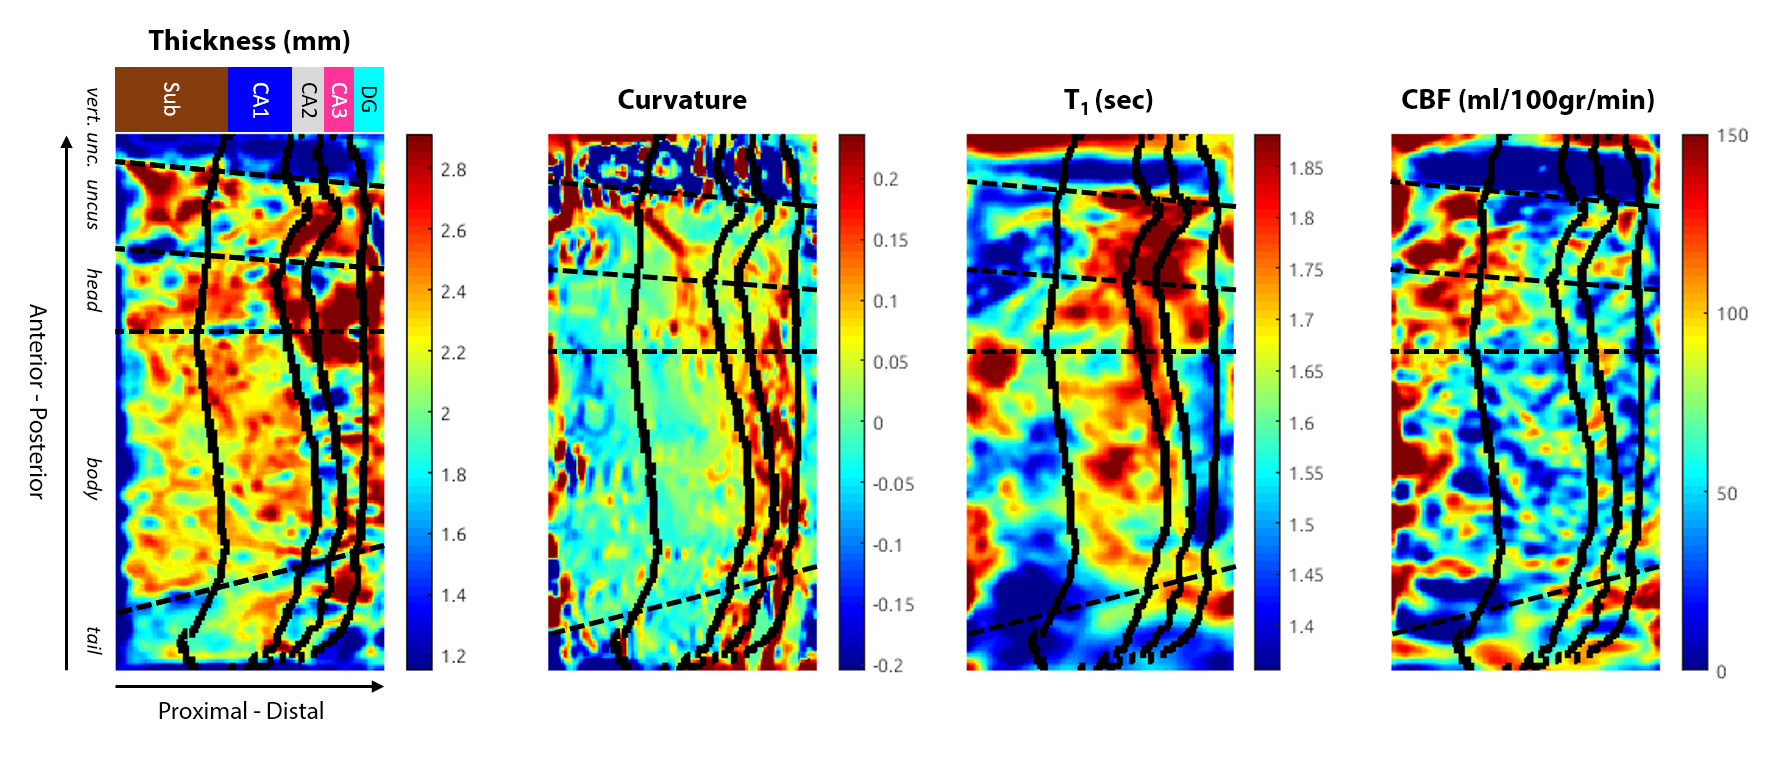
After unfolding using manual hippocampal segmentation (see Fig. 4), higher perfusion was especially observed in the subiculum (Sub) within the uncus and head portion of the hippocampus, while thickness and T1 were high in CA1 and CA3 at a similar location along the posterior-anterior axis (see Fig. 5). As expected due to its more folded anatomy, curvature was higher towards the most distal part of the hippocampus formation.
Discussion
The current
results show that sub-millimeter CBF data, among other parameters [2], can be
used to discern between cortical regions, as well as for differentiation
between subregions within more fine-scale structures. Here, we demonstrate the
first utilization of baseline perfusion to delineate hippocampal subfields, by
combining it with a recently published coordinate system [4].
In general,
higher baseline perfusion levels were observed in cortical and hippocampal
regions that are highly myelinated (i.e. low T1) [10]. However, data
from multiple subjects need to be acquired to carefully assess the correlation
between CBF and myelination. While the acquisition duration of the current
whole-brain dataset is too long for typical (f)MRI studies, and data quality
suboptimal in low B1+ regions, it warrants further exploration
by focusing on other brain structures of interest as well. For future studies,
the acquisition time can dramatically be reduced, and data quality improved if
one has specific hypotheses related to a subset of regions using more optimized
acquisition parameters (i.e. slab positioning). Finally, for correct
interpretation of the resulting cortical CBF maps, as well as potential fMRI
data, additional data modalities to measure vascular density (e.g.
time-of-flight and susceptibility-weighted imaging) should be used to rule out
or correct for potential large vessel biases.Acknowledgements
This research has been financially supported by VIDI grant (452-11-002) to KU. We thank Andrew Webb for providing us with the dielectric pads used in this study. We acknowledge help by Markus Barth and Josef Pfeuffer on earlier versions of the 3D EPI ASL sequence code used here.References
[1] Ivanov et al. (2018) Proc. Intl. Soc. Mag. Reson. Med. 26 p. 2301. [2] Haast et al. (2017). Proc. Intl. Soc. Mag. Reson. Med. 25 p. 352. [3] Gusnard and Raichle (2001) Nat Rev Neurosci. Oct;2(10):685-94. [4] DeKraker et al. Neuroimage. 2018 Feb 15;167:408-418. [5] Marques and Gruetter, PLoS One. 2013 Jul 16;8(7). [6] Eggenschwiler et al. Magn Reson Med. 2012 Jun;67(6). [7] Teeuwisse et al. Magn Reson Med. 2012 Apr;67(4). [8] Avants et al. Neuroinformatics. 2011 Dec;9(4):381-400. [9] Glasser et al. Nature. 2016 Aug 11;536(7615):171-178.Figures
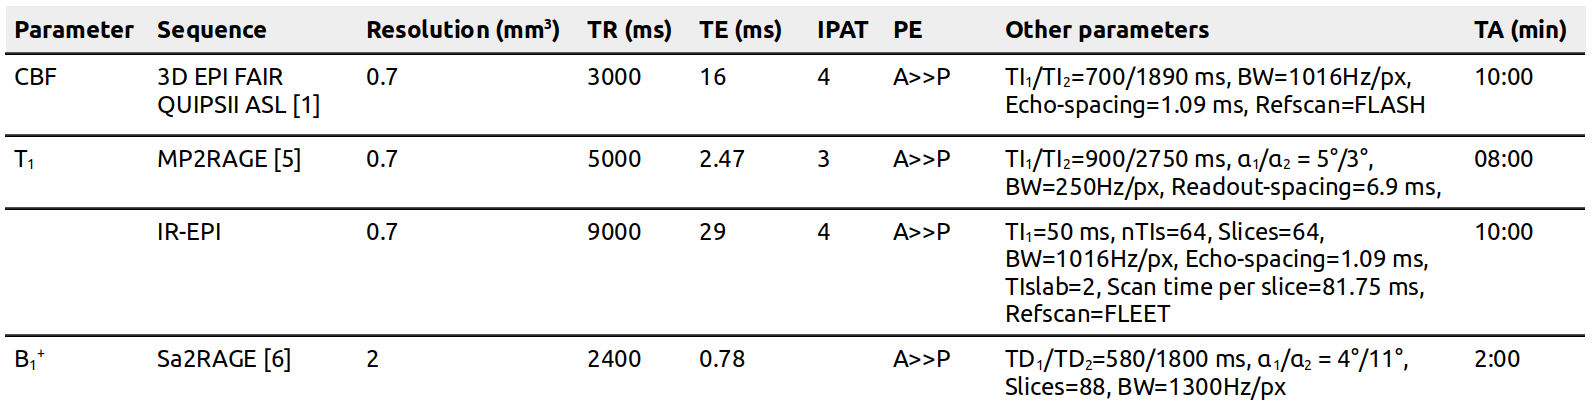
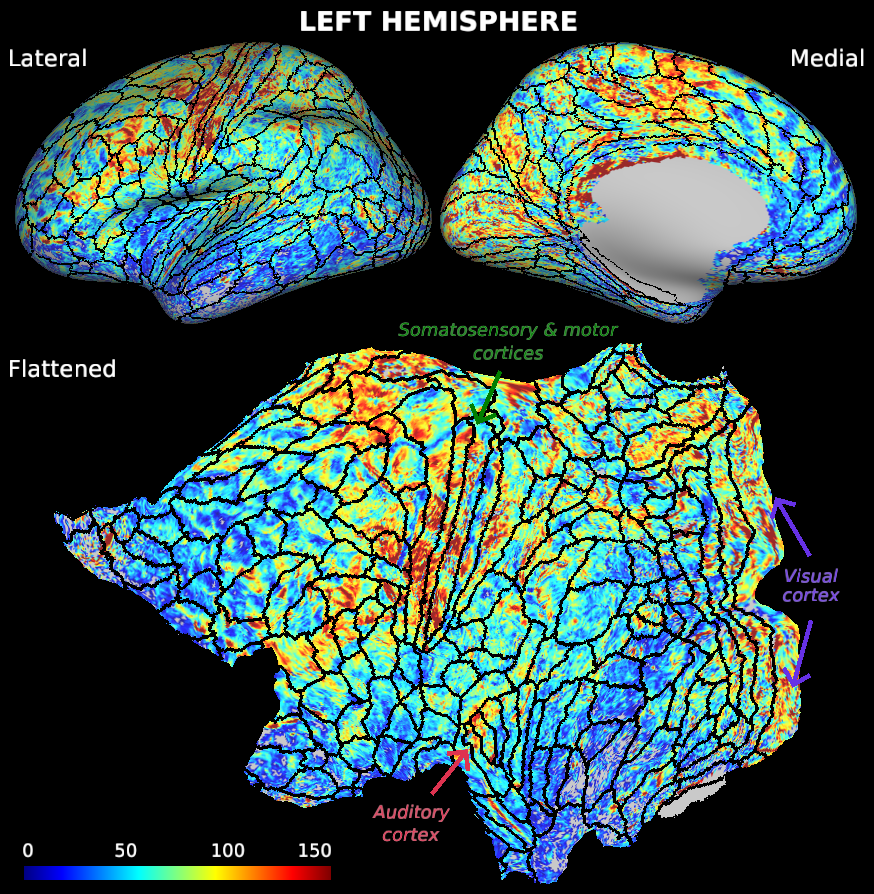
Fig. 2 Cortical CBF surface maps. Clear differences can be observed with regards to the perfusion across the brain, ranging between 0-150 ml/100 grams/min. Higher perfusion was particularly observed within the primary cortical regions (i.e. somatosensory, motor, auditory and visual cortices as annotated on the flattened surface). Lower perfusion is visible in the inferior temporal lobe, presumably due to lower data quality in these regions.
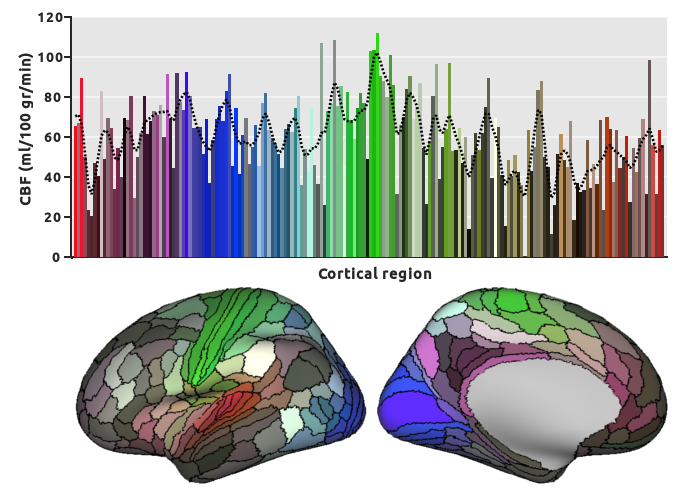
Fig. 3 Average CBF per cortical region. Bars are color-coded as specified by the multi-modal cortical atlas [9] to identify the location on the cortical surface. The dotted line shows the general tendency (i.e. smoothed fit) of CBF across the groups of cortical regions (e.g. green vs. blue). Highest CBF values are observed in the somatosensory & motor cortices, shown in green, while lower values area observed in inferior frontal and temporal lobes (dark brown regions).