3122
Diagnostic value of signal intensity histogram analysis based on magnetic resonance cube sequence on hippocampal sclerosis in temporal lobe epilepsy1The First Affiliated Hospital of Dalian Medical University, DALIAN, China
Synopsis
Hippocampal sclerosis(HS)is the most common pathological form of medial temporal lobe epilepsy, characterized by loss of hippocampus and related structural selective neurons and reactive gliosis. With magnetic resonance(MR) imaging, the detection rate for HS has been found to vary largely and such substantial variations in the detection rate have been primarily attributed to the subjective nature of the assessment of scans. Texture analysis is a technique used to quantify image textures
Synopsis
Hippocampal sclerosis(HS)is the most common pathological form of medial temporal lobe epilepsy, characterized by loss of hippocampus and related structural selective neurons and reactive gliosis. With magnetic resonance(MR) imaging, the detection rate for HS has been found to vary largely and such substantial variations in the detection rate have been primarily attributed to the subjective nature of the assessment of scans. Texture analysis is a technique used to quantify image textures. In this study, HS was distinguished by using non-invasive MRI texture analysis based on 3D measurement.
Objective
The purpose of this work was to measure the hippocampal head and amygdala texture parameters in patients with unilateral temporal lobe epilepsy hippocampal sclerosis in the coronal 3D CUBE T 2 FLAIR sequence, and to evaluate the diagnostic value of each texture parameter in hippocampal sclerosis.
Materials and Methods
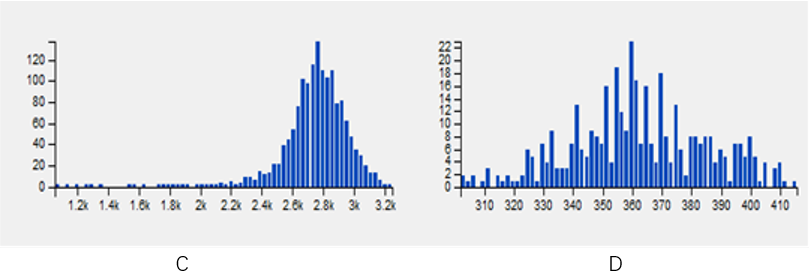
Nine patients diagnosed with hippocampal sclerosis and twelve healthy subjects were evaluated. The Omni-Kinetics software was used to delineate the maximum three layers of the hippocampus and amygdala on the CUBE image and merge to form a three-dimensional ROI, then obtain the three-dimensional ROI signal intensity histogram information and its parameters. The texture parameters were compared using two independent samples t test and Mann-Whitney U test between groups. Receiver operating characteristic (ROC) was used to evaluate the differential diagnosis efficiency of each parameter.Results
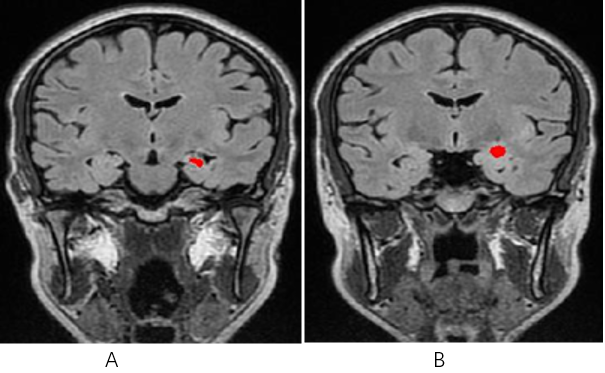
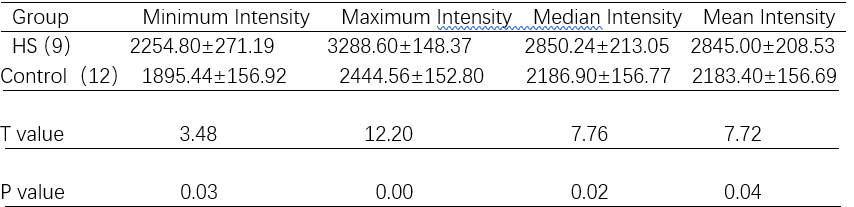
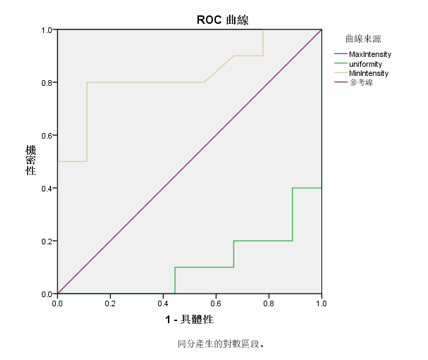
Routine images showed that 5 of 9 patients had right hippocampal sclerosis and 4 had left hippocampal sclerosis. There were no bilateral hippocampal changes in signal intensity and no cases with bilateral atrophy. All patients had normal amygdala except one high signal. Based on the CUBE signal intensity histogram parameters, Minimum Intensity,Maximum Intensity, Median Intensity, Mean Intensity, Mean Deviation, uniformity, the 5th, 10th, 25th, 75th, 90th percentiles have significant differences between the hippocampal sclerosis side and control hippocampus. Maximum Intensity, Median Intensity, Mean Intensity, Mean Deviation,the 5th, 10th, 25th, 75th, 90th percentile have significant differences between the hippocampal sclerosis side and the contralateral side (p <0.05); There was no significant difference in amygdala (p>0.05); there was no significant difference between the hippocampus and amygdala in the contralateral lesions (P>0.05). According to ROC analysis, the Maximum Intensity of T2WI was the best parameters.
Discussion
On visual inspection of MR imaging scans, HS is often associated with noticeable hippocampal atrophy and increased T2 signal intensity[1]. In clinical work, some cases of hippocampal sclerosis do not have increased T2WI signal, which is difficult to detect by conventional MRI[2]. We extract the texture features of hippocampal sclerosis by using the method of imageology. Comparison of hippocampal textures between hippocampal sclerosis group, contralateral hippocampus and control group, then, the diagnostic value of texture parameters in hippocampal sclerosis was obtained. The information obtained on the hippocampus by texture analysis demonstrates the complexity of the structure of this organ, as underlined also by histologic anatomic observations[3]Conclusion
The histogram analysis of magnetic resonance CUBE signal intensity can provide a reliable objective basis for the diagnosis of hippocampal sclerosis in temporal lobe epilepsy.Acknowledgements
This work has not received any funding.References
[1] Yu O,Mauss Y,Namer I J et al. Existence of contralateral abnormalities revealed by texture analysis in unilateral intractable hippocampal epilepsy .Magn Reson Imaging, 2001, 19: 1305-10.
[2] Jafari-Khouzani Kourosh,Elisevich Kost,Patel Suresh et al. FLAIR signal and texture analysis for lateralizing mesial temporal lobe epilepsy .Neuroimage, 2010, 49: 1559-71.
[3] Baldissin Maurício Martins,Souza Edna Marina de,Investigation of magnetic resonance imaging texture analysis as an aid tool for characterization of refractory epilepsies.Arq Neuropsiquiatr, 2013, 71: 920-4.
Figures