3118
Voxel Based Morphometry in Temporal Lobe Epilepsy: a pilot study using MT maps instead of conventional T1-weighted data1Neuroradiology Unit, Brain MRI 3T Research Center, IRCCS Mondino Foundation, Pavia, Italy, 2Queen Square MS Centre, Department of Neuroinflammation, UCL Queen Square Institute of Neurology, Faculty of Brain Sciences, University College London, London, United Kingdom, 3Department of Brain and Behavioural Sciences, University of Pavia, Pavia, Italy, 4Brain MRI 3T Research Center, IRCCS Mondino Foundation, Pavia, Italy, 5”C.Munari” Epilepsy Surgery Centre, ASST Ospedale Metropolitano Niguarda, Milan, Italy
Synopsis
Temporal Lobe Epilepsy (TLE) is the most common form of focal epilepsy. Neuroimaging and neuropathological studies indicates that the structural network affected in TLE extends to both temporal and extra-temporal structures. In this work, quantitative 3DMT maps were used in a Voxel Based Morphometry(VBM) framework to assess atrophy in left and right TLE compared to controls. Our findings revealed that 3DMT maps, thankfully to their excellent grey-white matter contrast, can be successfully employed for VBM in epilepsy identifying temporal and extra-temporal grey and white matter alterations in patients. This study is a proof-of-principle to adopt 3DMT for voxel based analysis in TLE.
Introduction
Temporal Lobe Epilepsy (TLE) is the most common form of focal epilepsy, accounting for about 70% of cases undergoing epilepsy surgery. It is often associated with hippocampal sclerosis, low-grade tumours, or malformation of cortical development, but some cases remain without specific pathology even after histological examination (1). Regardless of the underlying pathology, converging evidence from neuroimaging and neuropathological studies indicates that the structural network affected in TLE extends to both temporal and extra-temporal brain structures. Several studies have explored structural abnormalities in TLE using Voxel Based Morphometry (VBM) on conventional 3DT1 data (2,3). However, it has been shown in other diseases that magnetization transfer (MT) maps may provide a better grey/white matter demarcation (4). This is attractive for detecting malformations of cortical development, often associated with a loss of grey/white matter demarcation. This pilot study aimed at evaluating structural abnormalities in TLE, divided in left and right groups, compared to healthy controls (HC) using 3DMT maps instead of conventional 3DT1.Methods
Subjects: 33 TLE patients (19 left TLE: 33.2±9.9yrs, 10males, 14 right TLE: 39.5±10.7yrs, 6males) and 32 HC (32.6±8.2yrs, 18males). After temporal lobectomy, histopathology revealed hippocampal sclerosis (7 cases, 4 left and 3 right), focal lesions (tumours, cavernoma, scars 8 cases, 5 left and 3 right), focal cortical dysplasia (4 cases, 2 left and 2 right) and cryptogenics with only a gliosis (14 cases, 8 left and 6 right).
MRI acquisition: A multi-parameter mapping (MPM) (5) protocol was implemented by acquiring 3D multi-echo PD, R1 and MT-weighted gradient-echo scans using a Siemens Skyra 3T scanner (Siemens AG, Erlangen, Germany).
3DMT and VBM analysis: MPM maps were elaborated with the hMRI tool (http://hMRI.info) under Matlab and quantitative 3D maps of MT, pseudo PD, R1 and R2* were generated. 3DMT maps of all subjects were segmented into grey matter (GM), white matter (WM) and cerebrospinal fluid (CSF) using the CAT12 toolbox (6). Using the DARTEL framework, the segmented images were normalized to MNI space (ICBM-152) with 1.5 mm isotropic voxels, and smoothed using a kernel of 6-6-6 mm3 in SPM12 toolbox (7).
Statistical analysis: The smoothed and normalized images were used as inputs for the voxel-wise general linear model analysis. A one Way ANOVA analysis was performed to identify the atrophic regions of right TLE versus HC, left TLE versus HC and right TLE versus left TLE. Gender, age and total intracranial volume (TIV) were used as covariates. The significance was set at p<0.001 with an extension of 100 voxels and with FWE correction at p<0.05 at cluster level.
Results
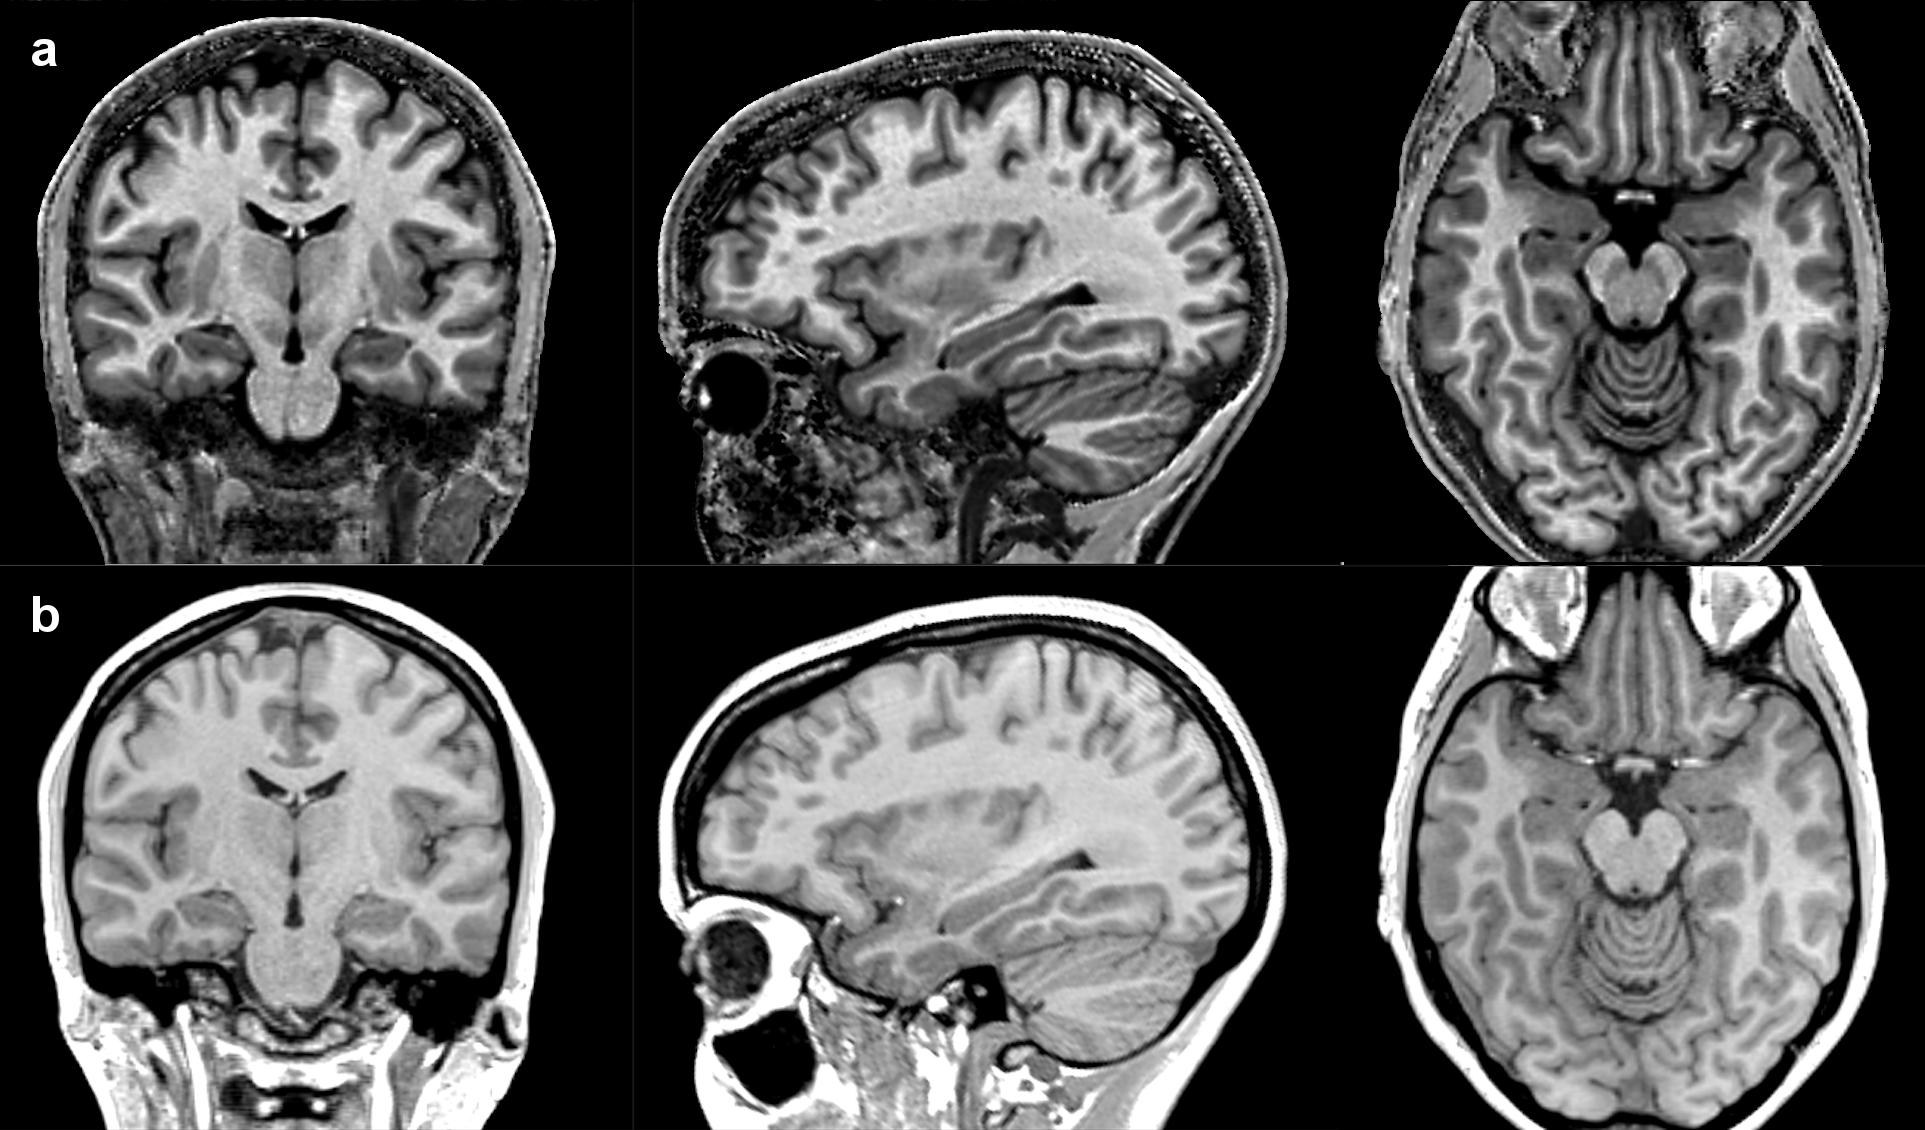
The 3DMT maps obtained showed an excellent grey/white matter contrast (Fig.1). The enhanced grey/white matter contrast of the 3DMT compared to 3DT1 (Fig.1) resulted also in a more accurate segmentation of the two cerebral tissues and cerebro spinal fluid.
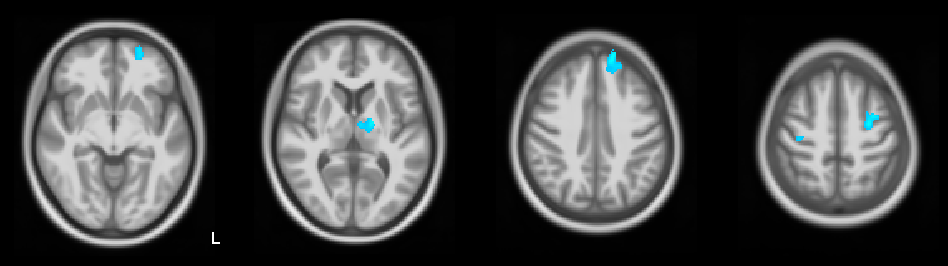
Most of grey matter atrophic changes were identified in the left hemisphere of both left and right TLE patients, compared to HC. Specifically, grey matter abnormalities in left TLE were found in left fronto-orbital gyrus, left superior frontal gyrus, left thalamus, and bilateral precentral gyrus (Fig.2).
Grey matter abnormalities in right TLE were found in bilateral cerebellar hemispheres and vermis, left fronto-orbital gyrus, left superior temporal gyrus (Fig.3).
Significant white matter atrophy was identified only in right TLE patients, mainly in bilateral cerebellum, deep right temporal lobe and bilateral fornix (Fig.4).
No significant differences were found in direct comparisons between left and right TLE patients.
Discussion
This pilot study using VBM on 3DMT maps identified grey and white matter atrophy, localised in the cerebellum and cerebral areas previously reported for classical VBM studies on conventional 3DT1 (2). For instance, the thalamus is the subcortical region more often found atrophic in TLE. In our pilot study, a lack of significant temporo-mesial atrophy may be due to the low percentage of patients of this study with hippocampal sclerosis, compared to classical TLE studies. A peculiar lateralized pattern of abnormalities emerged: prevalent grey matter atrophy in left TLE, and on the contrary a prevailing white matter atrophy in right TLE.Conclusions
3DMT map obtained by MPM, with excellent grey-white matter contrast, can be successfully employed for VBM in epilepsy. This study is a proof-of-principle to adopt 3DMT for voxel based analysis in TLE patients, both for study groups and single subject analysis.Acknowledgements
3TLE is a multicentric research project granted by Italian Health Ministry (NET2013-02355313): Magnetic resonance imaging in drug-refractory temporal lobe epilepsy: standardization of advanced structural and functional protocols at 3T, to identify hippocampal and extra-hippocampal abnormalities.References
- Blumcke et al. Histopathological findings in brain tissue obtained during epilepsy surgery. N Engl JMed 2017;377:1648-562.
- Keller SS1, Roberts N. Voxel-based morphometry of temporal lobe epilepsy: an introduction andreview of the literature. Epilepsia. 2008 May;49(5):741-573.
- Beheshti I, Sone D, Farokhian F, Maikusa N, Matsuda H. Gray Matter and White MatterAbnormalities in Temporal Lobe Epilepsy Patients with and without Hippocampal Sclerosis. FrontNeurol. 2018;9:107.
- Sethi A, Evelyn-Rahr E, Dowell N, Jain S, Voon V, et al. Magnetization transfer imagingidentifies basal ganglia abnormalities in adult ADHD that are invisible to conventional T1weighted voxel-based morphometry. Neuroimage Clin. 2017;15:8–14.
- Weiskopf N, Suckling J, Williams G, Correia MM, Inkster B et al. Quantitative multi-parameter mapping of R1, PD(*), MT, and R2(*) at 3T: a multi-center validation. Frontiersin Neuroscience. 2013;7:95 doi: 10.3389/fnins.2013.00095.
- Gaser C, Dahnke R. CAT - A Computational Anatomy Toolbox for the Analysis of Structural MRIData. Hum Brain Mapp 2016.
- Ashburner J, Barnes G, Chen C, Daunizeau J, Flandin G, et al. SPM8 Manual The FILMethods Group (and Honorary Members). Functional Imaging Laboratory. 2013: 475–1.
Figures