3110
Semi-automatic cloud-based workflow for evaluating the central vein sign for MS diagnosis in a multicenter clinical setting1Neuroimaging, QMENTA Inc., Barcelona, Spain, 2Translational Neuroradiology Section, National Institute of Neurological Disorders and Stroke, National Institutes of Health, Bethesda, MD, United States, 3Mellen Center for Multiple Sclerosis Treatment and Research, Cleveland Clinic, Cleveland, OH, United States, 4QMENTA Inc., Barcelona, Spain
Synopsis
The central vein sign (CVS) is
INTRODUCTION
IMAGE ACQUISITION
IMAGE ANALYSIS WORKFLOW
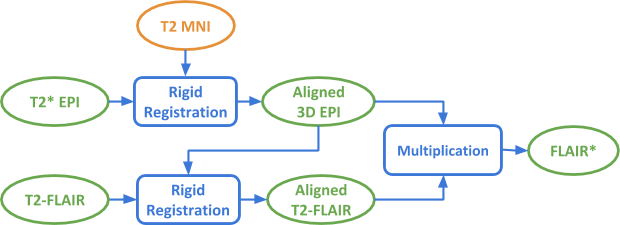
A custom-built neuroimaging analysis workflow was implemented in the QMENTA cloud platform including the following processing steps: raw DICOM data preprocessing, calculation of FLAIR* images, automatic FLAIR-based lesion segmentation, semi-automatic lesion mask quality check (QC), interactive manual annotation of the CVS and automatic calculation of central vein positive lesion rate at the subject-level (Figure 1).
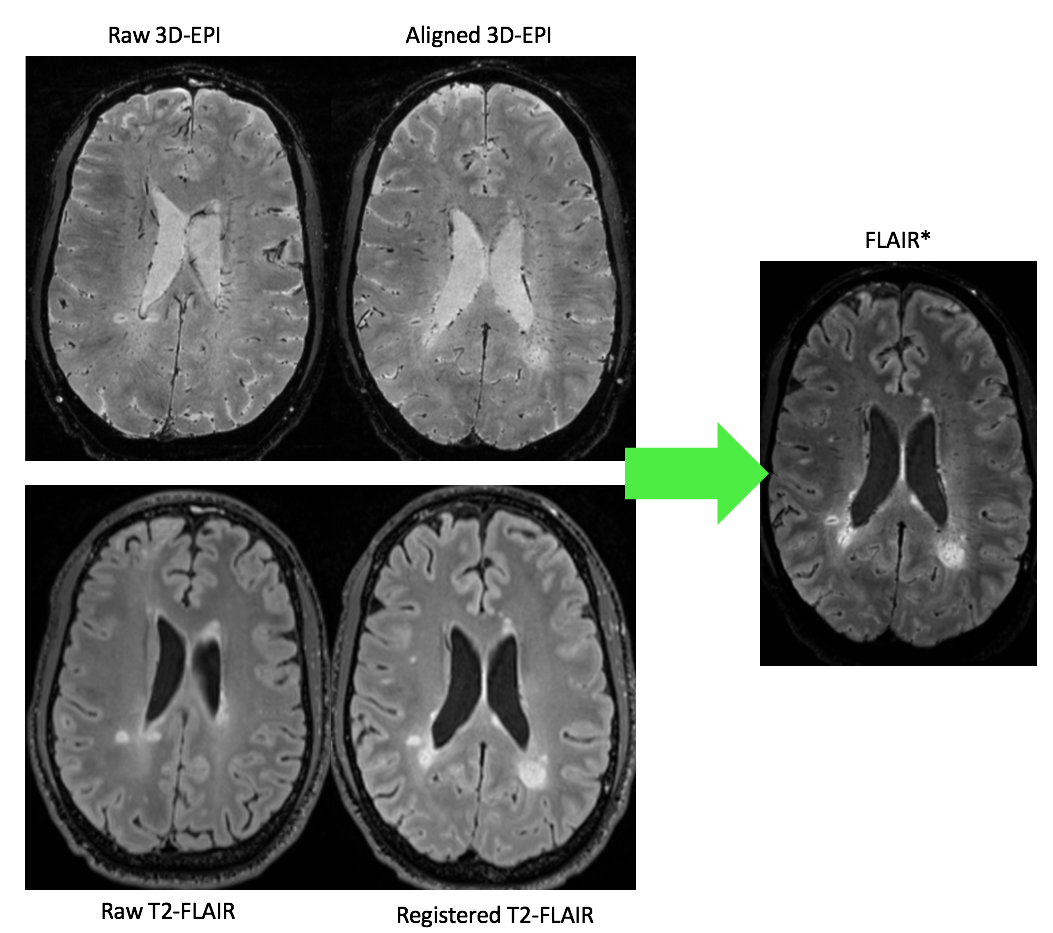
DICOM data uploaded by the imaging center were automatically tagged based on DICOM tags and sequence naming to detect the appropriate T2*3D-EPI and T2-FLAIR input images within the files of each analyzed subject. Once selected, the files were converted into NIfTI format. FLAIR* images were computed as follows: T2* 3D-EPI images were rigidly registered to the MNI 152 template using ANTs software5, as a means of AC-PC alignment and FOV standardization, while remaining in the native resolution. T2-FLAIR images were then rigidly registered to the aligned 3D-EPI images and interpolated to match the latter’s resolution (0.65 mm isotropic). The aligned images were then multiplied to obtain the FLAIR* images. A schema of the processing pipeline is shown in Figure 2 while native and processed images are shown in Figure 3.
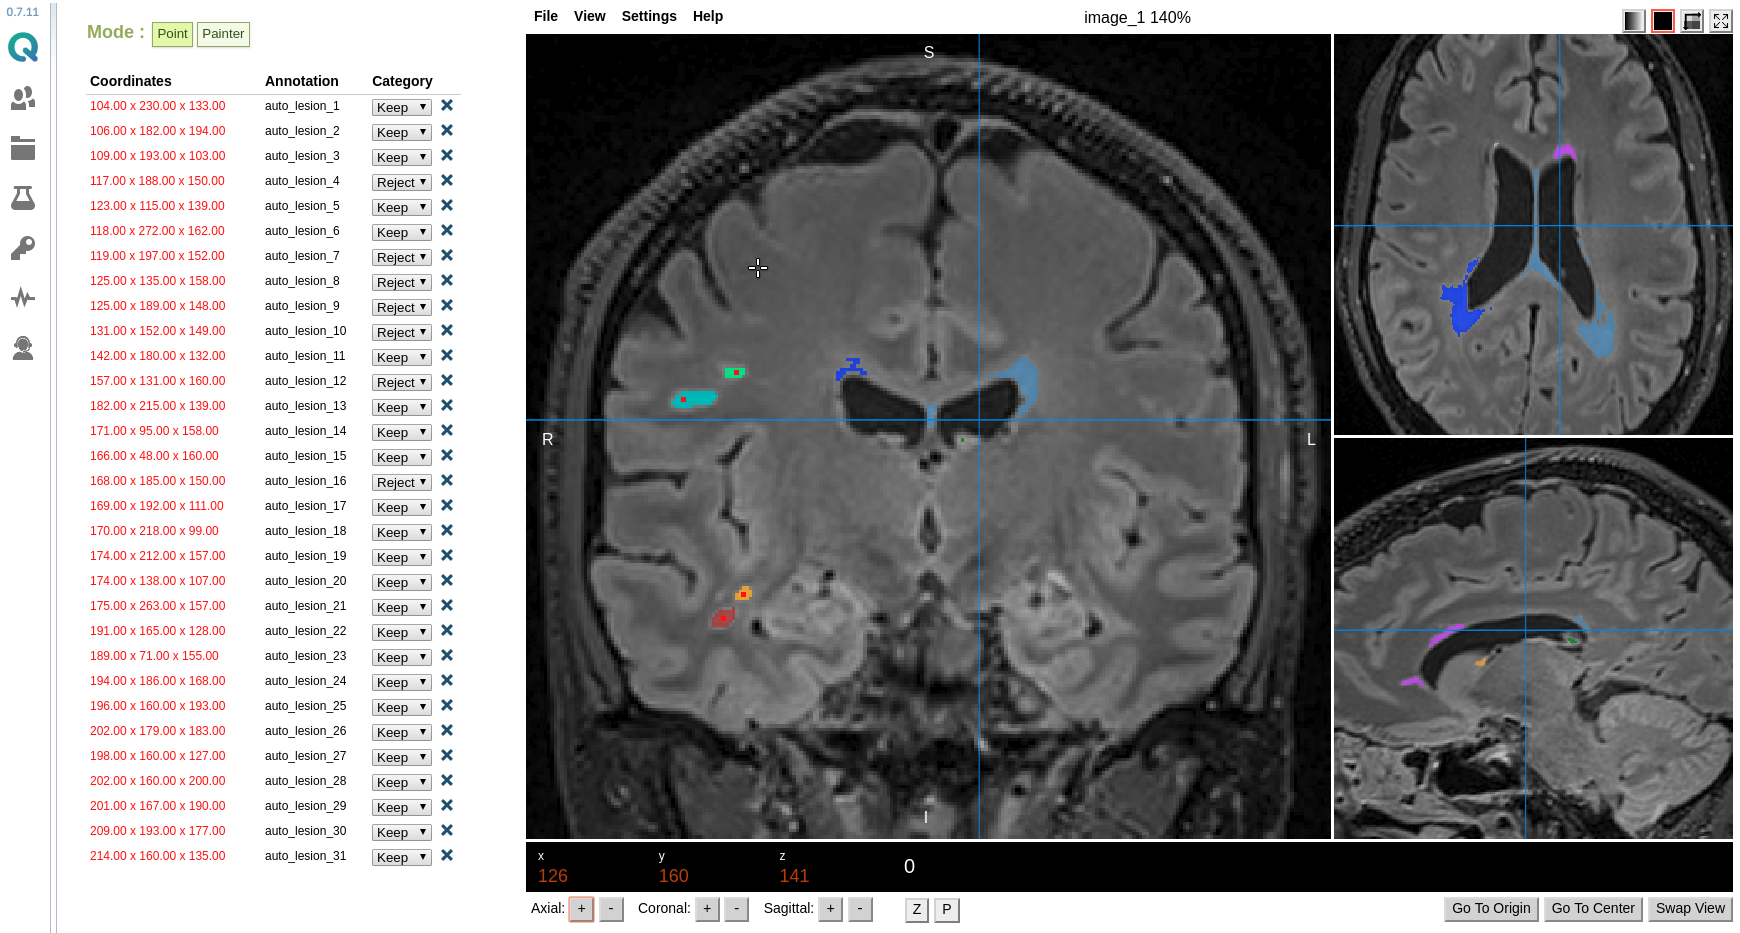
Lesion masks were automatically computed from the aligned T2-FLAIR image using the LST-LPA algorithm6. Each disconnected lesion volume from the mask was given a unique identifier and the labeled lesion mask was displayed as an overlay over the T2-FLAIR image, using a viewer derived from Mindcontrol software7. Additionally, the centroid of each lesion volume was pre-computed and listed as shown in Figure 4. When clicking on one of the listed lesions, the multiplanar T2-FLAIR images were re-centered over the selected lesion. During the QC step, each segmented lesion could be accepted (true positive) or rejected (false positive). In the latter case, the lesion volumes were deleted from the masks once QC was completed.
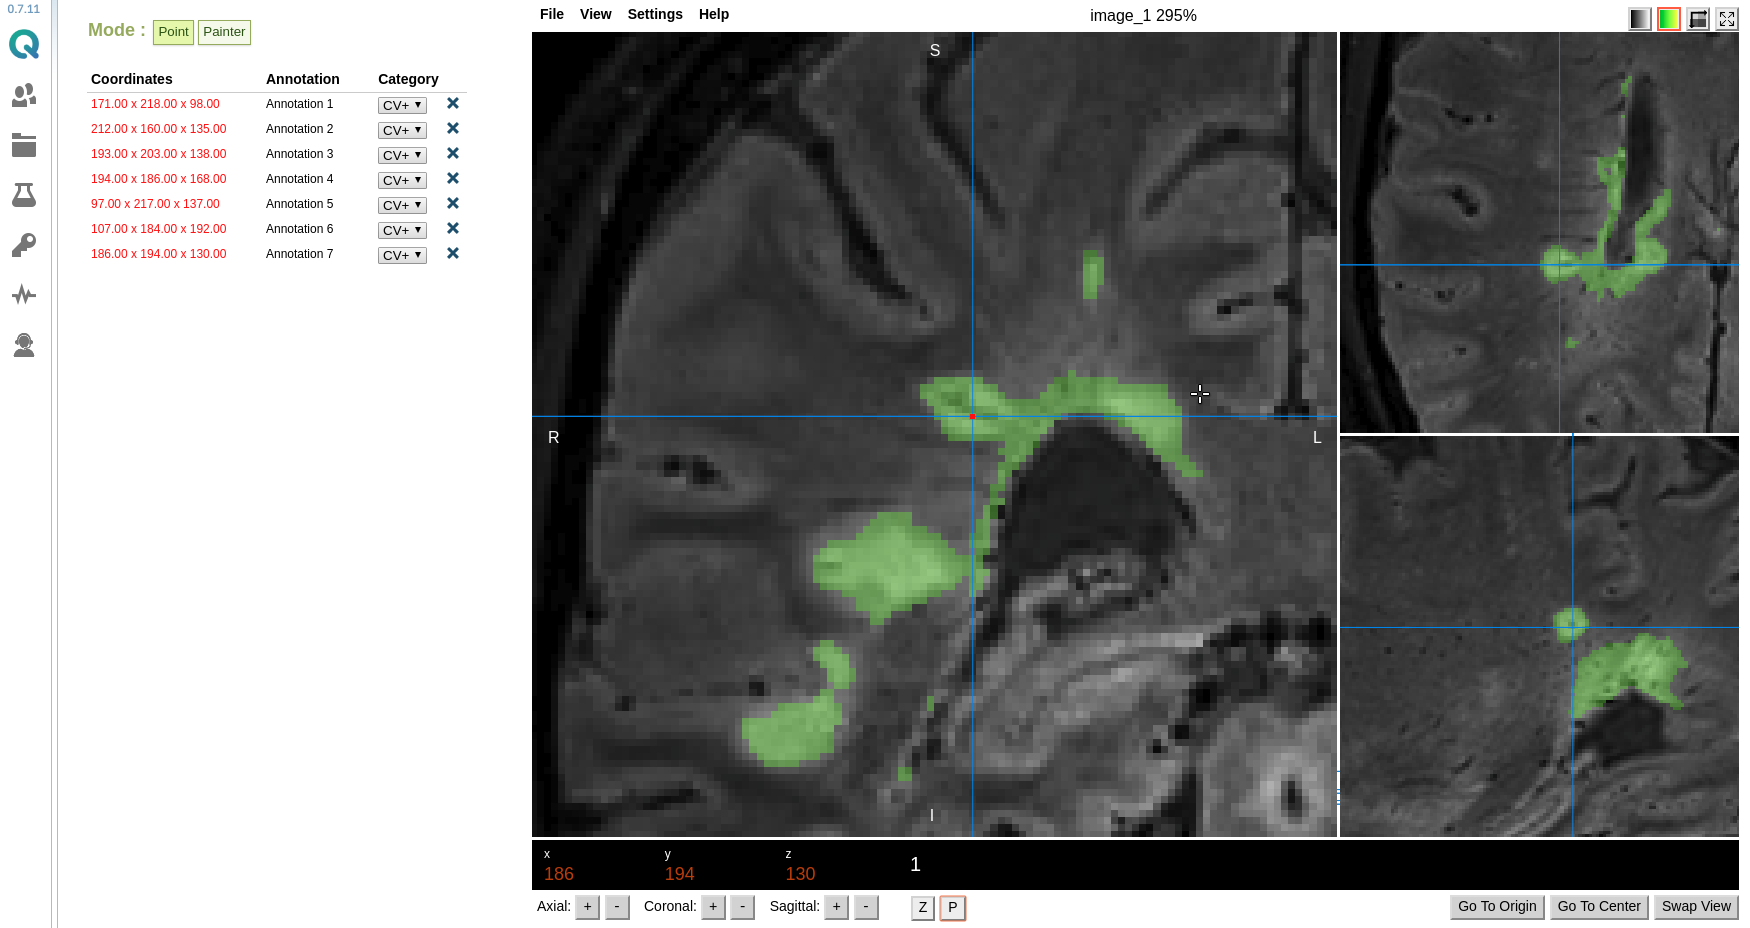
Using a similar display interface, the curated lesions masks were overlaid over the FLAIR* images. The lesion masks allowed to quickly identify the brain lesions to evaluate for the central vein sign. Using various display functionalities (zoom, pan, lesion mask transparency), the CVS could be manually assessed on the multiplanar FLAIR* images for all detected lesions in each subject. Once the CVS was identified in a lesion, the lesion was listed with its spatial coordinates and marked as central vein positive (or CV+), as illustrated in Figure 5. Once the CVS evaluation was completed, the number of CV+ lesion annotations per subject was automatically calculated and saved in a downloadable datasheet that contains the aggregated information of all subjects in the project, including original lesion count and manually detected false positives/negatives.
DISCUSSION/CONCLUSION
Acknowledgements
The Race to Erase MS foundation and NAIMS cooperative are acknowledged for their financial support.References
- Sati P, Oh J, Constable RT, Evangelou N, Guttmann CR, Henry RG, Klawiter EC, Mainero C, Massacesi L, McFarland H, Nelson F. The central vein sign and its clinical evaluation for the diagnosis of multiple sclerosis: a consensus statement from the North American Imaging in Multiple Sclerosis Cooperative. Nature Reviews Neurology. 2016 Dec;12(12):714.
- Sati P, George IC, Shea CD, Gaitán MI, Reich DS. FLAIR*: a combined MR contrast technique for visualizing white matter lesions and parenchymal veins. Radiology. 2012 Dec;265(3):926-32.
- Sati P, Patil S, Inati S, Wang WT, Derbyshire JA, Krueger G, Reich DS, Butman JA. Rapid MR susceptibility imaging of the brain using segmented 3D echo-planar imaging (3D EPI) and its clinical applications. Magnetom FLASH. 2017;68:26-32.
- Lazovski N, Ramos M, Moreno-Dominguez D, Sato T, Peeters T, Prčkovska V, Rodrigues P. Neuroimaging workflow in the cloud : standardizing research. OHBM 2017: 23rd Annual Meeting of the Organization for Human Brain Mapping. 2017. DOI: 10.13140/RG.2.2.30763.75041
- Avants BB, Epstein CL, Grossman M, Gee JC. Symmetric diffeomorphic image registration with cross-correlation: evaluating automated labeling of elderly and neurodegenerative brain. Medical image analysis. 2008 Feb 1;12(1):26-41.
- Schmidt P. Bayesian inference for structured additive regression models for large-scale problems with applications to medical imaging (Doctoral dissertation, lmu). URN: urn:nbn:de:bvb:19-203731
- Keshavan A, Datta E, McDonough IM, Madan CR, Jordan K, Henry RG. Mindcontrol: A web application for brain segmentation quality control. NeuroImage. 2017 Mar 30.
Figures