3109
Improved Structural Imaging of the Default Mode Network on the Compact 3T1Sydney Translational Imaging Laboratory, Heart Research Institute, University of Sydney, Sydney, Australia, 2GE Healthcare, Richmond, Melbourne, Victoria, Australia, 3GE Global Research, Niskayuna, NY, United States, 4Department of Radiology, Mayo Clinic, Rochester, MN, United States, 5Department of Radiology, Royal Prince Alfred Hospital, Sydney, Australia
Synopsis
We compared diffusion MRI tractographic representations of the default mode network using high-angular resolution scans from the Compact 3T with high-performance gradients to equivalent data acquired on a standard clinical scanner. Overall performance in terms of strength, accuracy and visualisation of the DMN was superior for the Compact 3T data, with improved global tracking performance and improved measurement of weaker connections.
Introduction
The default mode network (DMN) plays a central role in brain health and many important diseases including depression1. However, delineation and measurement of its constituent white matter (WM) pathways using diffusion MRI is limited by multiple factors, including: crossing fibres, image distortion, low spatial resolution and insufficient signal-to-noise ratio. The impact of these factors may be minimised through improved gradient technology2. In this pilot study, we aimed to compare structural connectivity of the DMN using high-angular resolution diffusion MRI scans from a Compact 3T scanner with high-performance gradients with those from standard clinical hardware. We hypothesised that the strength of connectivity would be greater using data from the Compact 3T, and that the rate of spurious tracking and the qualitative delineation of the relevant WM bundles would also be improved.Methods
One healthy adult subject was imaged using the GE Compact 3T MRI scanner (peak gradient amplitude 80 mT/m, slew rate 700 T/m/s)3-5 under an IRB-approved protocol. To account for additional concomitant fields arising from the asymmetric transverse gradients, frequency shifting6 and gradient pre-emphasis7 were applied. High-order gradient non-linearity correction with even-order terms was applied8.
- “C3T-750”: 1.2 mm3, TE=58.6 ms, TR=6000 ms, FA=90°, 750 directions; 3 shells at b=700 (134), 1000 (214) and 2800 (402) mm/s2 plus 42 b=0 volumes, multiband factor=3, in-plane acceleration factor=2, ~80 minutes. This dataset was down-sampled to 33, 64, 140, 280, 420, 560 and 700 directions while retaining uniformly-distributed gradient directions and equal proportions of b-values in each shell.
We compared these data to data from normal subjects drawn from the Chronic Diseases Connectome Project (CDCP) (n=27, age 33±12, 46% female) acquired on a standard clinical scanner (GE Discovery 750w; peak gradient amplitude 44 mT/m, slew rate 200 T/m/s) with a 140-direction protocol.
- “CDCP-140”: 2mm3, TE=91.8 ms, TR=4323 ms, FA=90°, 140 directions; 3 shells at b=700 (25), 1000 (40), 2800 (75) mm/s2, including 8 b=0 volumes, multiband factor=3, in-plane acceleration factor=2, ~10 minutes.
Each dataset was denoised, corrected for susceptibility, eddy-currents and motion using TOPUP and eddy_cuda9. A WM response function was generated using the Dhollander method and fibre orientation distributions created using constrained spherical deconvolution10. Anatomically-constrained tractography of the whole-brain using 10 million tracks was performed and then the connection weights of the major connections of the DMN were quantified, taking into account underlying fibre density using masks from the Harvard-Oxford atlas. We estimated spurious tracking rates as the proportion of tracks exiting the 99% dense bundle volume.
Results
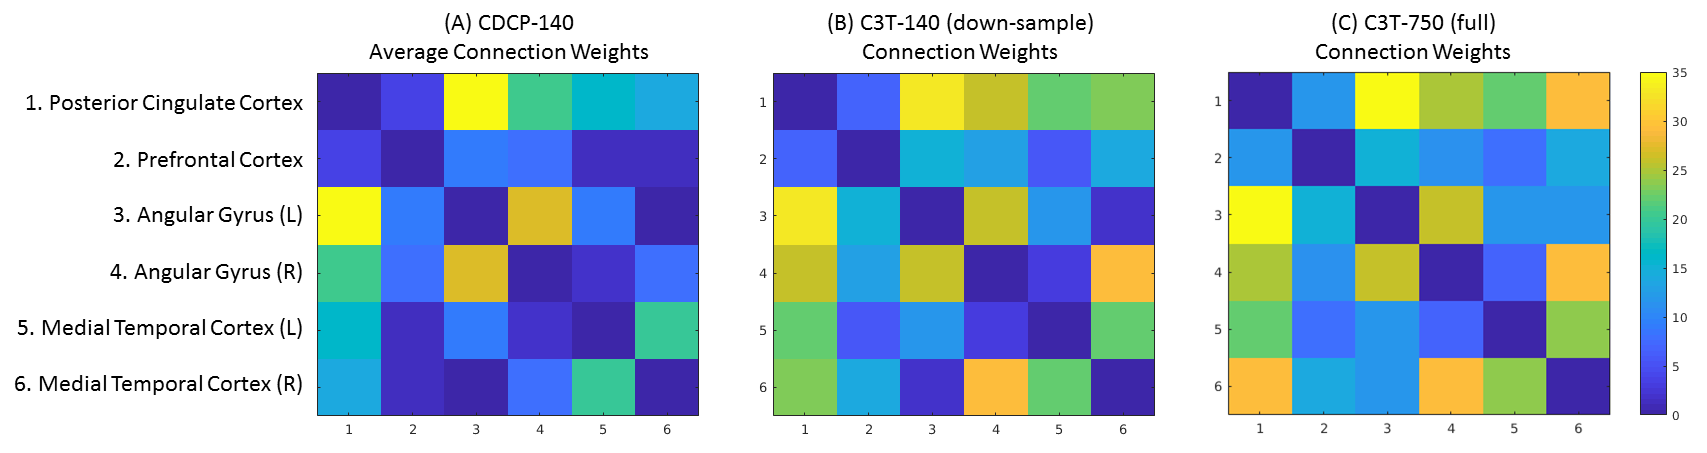
The pattern of connectivity was consistent across the DMN in the CDCP cohort and the single-subject C3T dataset, and agreed with previous literature1 (Figure 1). Network strength (NS; calculated as the sum of connection weights) was greatest in the C3T-750 data (NS=502) compared to the CDCP average (NS=381; 31.7% improvement). NS improved with higher angular resolution (from NS=322 at 33 directions to NS=502 at 750 directions: 55.9% improvement), however this was relatively inefficient - the increase between the C3T-140 sub-sample and C3T-750 was only 11.5%.
These overall NS results masked a high degree of heterogeneity within the connections. Large variations in measured topology were found, with the most dramatic examples in: (1) the medial-temporal-to-PCC connection pair, which decreased in the C3T data where the ratio of the connection weight to the mean was 1.52 in CDCP-140, compared to 1.09 for the C3T-750 data; (2) in the medial-temporal-to-mPFC connection pair, which was increased in the C3T data (CDCP-140: 0.13; versus C3T-750: 0.74).
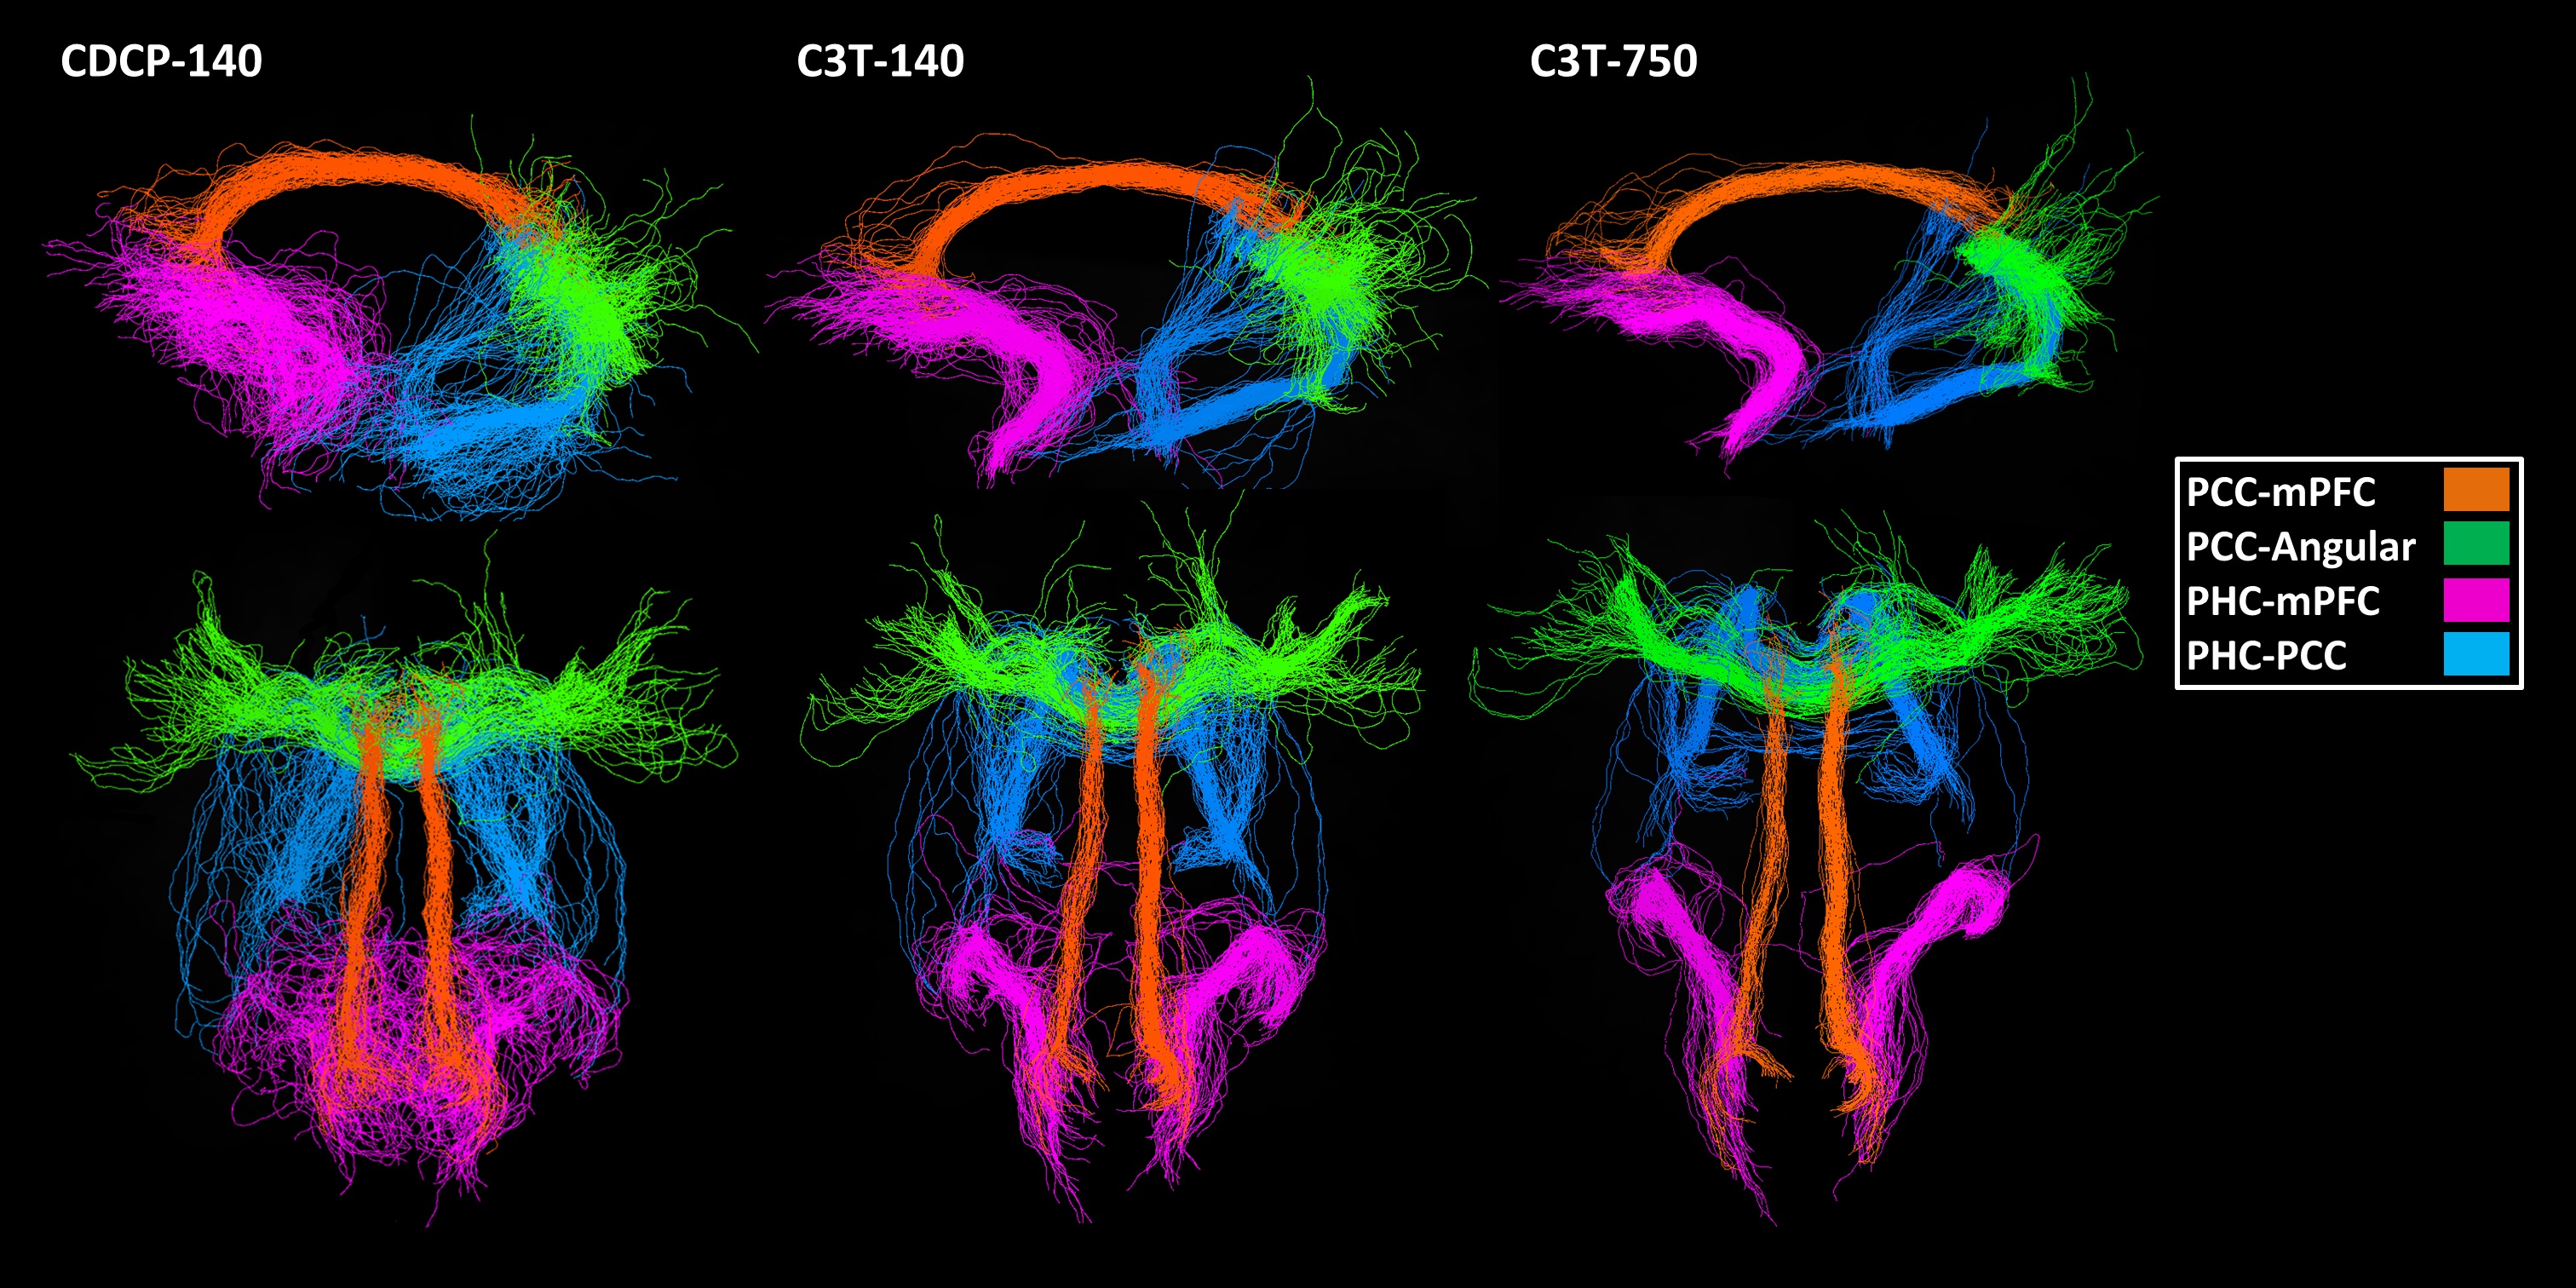
Spurious tracking (the proportion of tracks not retained within the dense bundle volume) was most frequent in the medial temporal lobe, a known region of high geometric distortion (CDCP-140 average 40%, C3T-140 38%, C3T-750 35%). Among the other connection pairs, rates of spurious tracking were consistently lower, and were lower in the C3T-750 data (average of all other connection pairs: CDCP-140 25%, C3T-140 23%, C3T-750 17%). Visualisations of the DMN for the CDCP-140, C3T-140 and C3T-750 datasets are shown in Figure 2.
Discussion
Data from the Compact 3T produced a stronger default mode network measurement with less spurious tracking and better visualisations at a single-subject level than equivalent data acquired on standard clinical hardware. While global connection strength increased using Compact 3T data, the key improvement is likely to be removal of anatomical bias in accuracy across connection measurements, which may have important implications for connectomic network analyses.Conclusion
For studies of WM anatomy and quantification of connection strength using diffusion MRI (e.g., in the DMN), scanner hardware with high-performance gradients, such as the Compact 3T, may offer a greater level of performance than has previously been possible.Acknowledgements
No acknowledgement found.References
1. Greicius, M.D., et al., Resting-state functional connectivity reflects structural connectivity in the default mode network. Cereb Cortex, 2009. 19(1): p. 72-8.
2. Tan, E.T., et al., High slew-rate head-only gradient for improving distortion in echo planar imaging: Preliminary experience. J Magn Reson Imaging, 2016. 44(3): p. 653-64.
3. Foo, T.K.F., et al., Lightweight, compact, and high-performance 3T MR system for imaging the brain and extremities. Magn Reson Med, 2018. 80(5): p. 2232-2245.
4. Lee, S.K., et al., Peripheral nerve stimulation characteristics of an asymmetric head-only gradient coil compatible with a high-channel-count receiver array. Magn Reson Med, 2016. 76(6): p. 1939-1950.
5. Weavers, P.T., et al., Technical Note: Compact three-tesla magnetic resonance imager with high-performance gradients passes ACR image quality and acoustic noise tests. Med Phys, 2016. 43(3): p. 1259-64.
6. Weavers, P.T., et al., B0 concomitant field compensation for MRI systems employing asymmetric transverse gradient coils. Magn Reson Med, 2018. 79(3): p. 1538-1544.
7. Tao, S., et al., Gradient pre-emphasis to counteract first-order concomitant fields on asymmetric MRI gradient systems. Magn Reson Med, 2017. 77(6): p. 2250-2262.
8. Tao, S., et al., Gradient nonlinearity calibration and correction for a compact, asymmetric magnetic resonance imaging gradient system. Phys Med Biol, 2017. 62(2): p. N18-N31.
9. Andersson, J.L.R. and S.N. Sotiropoulos, An integrated approach to correction for off-resonance effects and subject movement in diffusion MR imaging. Neuroimage, 2016. 125: p. 1063-1078.
10. Jeurissen, B., et al., Multi-tissue constrained spherical deconvolution for improved analysis of multi-shell diffusion MRI data. Neuroimage, 2014. 103: p. 411-426.
Figures