3107
Synthetic harmonization of multi-site multi-vendor MRI data to improve MS lesion segmentation1Center for Neuroscience and Regenerative Medicine, Henry Jackson Foundation, Bethesda, MD, United States, 2Department of Electrical and Computer Engineering, Johns Hopkins University, Baltimore, MD, United States, 3Department of Neurology, Johns Hopkins University School of Medicine, Baltimore, MD, United States, 4Radiology and Imaging Sciences, National Institute of Health, Bethesda, MD, United States
Synopsis
Segmentation of lesions from magnetic resonance images of patients with multiple sclerosis is a challenging task, especially when involving multi-center or multi-scanner data. State-of-the-art lesion segmentation algorithms require training data to use identical acquisition protocols as the input data, but this is often difficult to control. In this work, we employ image synthesis to allow data from one scanner to resemble the data acquired in a different scanner. Overall lesion segmentation accuracy improves and the amount of false positives are reduced using synthesized images, indicating image synthesis can improve segmentation consistency in a heterogeneous dataset.
Introduction
Segmentation of lesions from magnetic resonance images of patients with multiple sclerosis is a challenging task. Accuracy of most state-of-the-art lesion segmentation algorithms rely on lesion masks manually delineated on multi-contrast MR images, which are used as training data. Segmentation accuracy decreases when the MR imaging sequences or scanner types of the training data do not match with that of the test data.1,2 This poses a significant problem in analyzing multi-site or multi-scanner studies, where it is not possible to have consistent imaging protocols. We propose to solve this problem by altering multi-contrast MR test images to have similar MR intensity distributions as the training data using synthesis. This ensures that a lesion segmentation algorithm, optimized for training data, can be applied to the test data as well, which may not have gold standard lesion masks as training data.Methods
T1-w MPRAGE and FLAIR images were obtained in 5 patients over 5 years (n=21 scans) from Johns Hopkins (JHU) on a Siemens 3T. MPRAGE and FLAIR from 20 patients were also obtained from UMC Utrecht (UMC)6 on a Philips 3T. Manual lesion masks were available for both datasets.
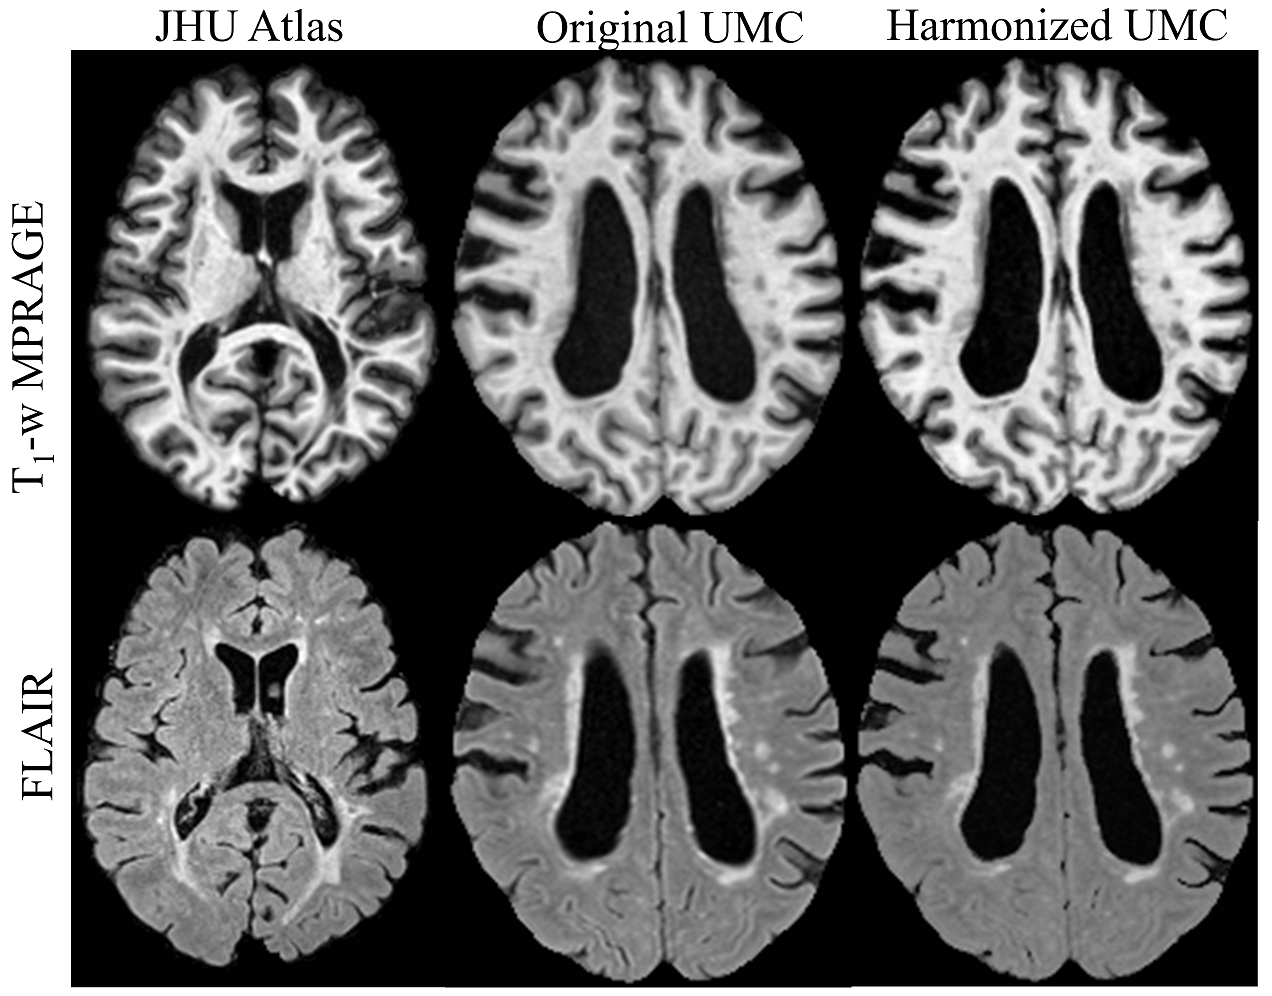
We apply a patch-based synthesis approach3 to match the intensity properties of the two different data sets. The advantage of this approach is that it does not require the same scan acquired with both acquisition protocols for training. For each patch in a target image, the algorithm finds similar patches from atlas images, and synthesizes a new image based on a weighted-mean combination. The optimal weights are found via a Gaussian mixture model. In this way, the new image is based on the anatomy of target image, but created from intensities of the atlas image. Two experiments were conducted; first, JHU data was treated as the atlas and UMC as target, creating SynUMC, and then vice versa, creating SynJHU. T1 and FLAIRs were independently synthesized. Fig. 1 shows examples of UMC images and the synthesized ones.
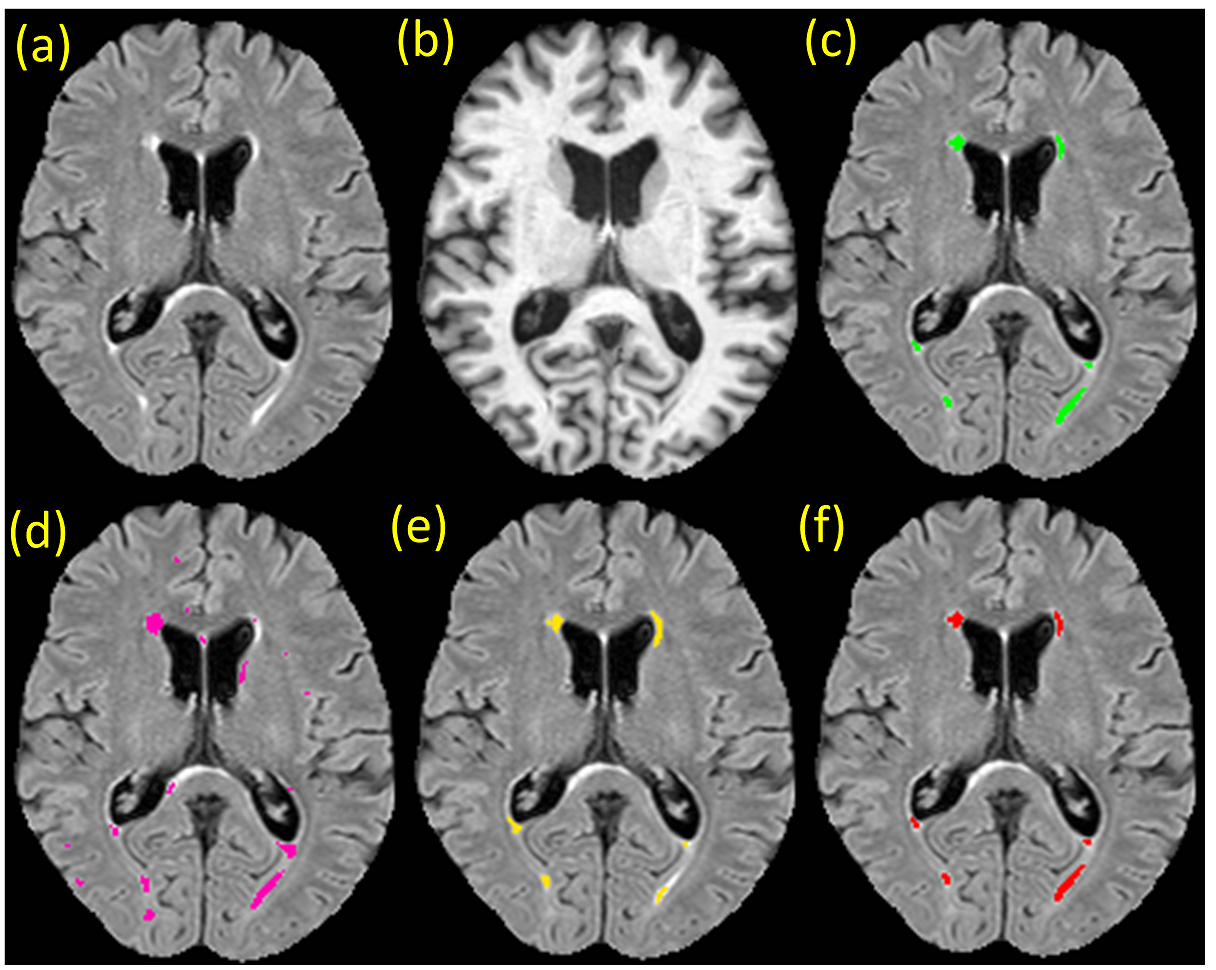
A deep learning based lesion segmentation algorithm, FLEXCONN4, was trained with 7 subjects each from the two datasets, JHU and UMC. The JHU trained model was applied to UMC and SynUMC(n=13) images, and then compared with the UMC trained model, which served as the reference standard. Similarly, the UMC trained model was applied to the JHU and SynJHU(n=14) data, and compared with the reference standard of JHU trained model. Fig. 2 shows examples of segmentations obtained from the two trained models. Dice, positive predictive value(PPV), lesion false positive rate(LFPR), and volume difference(VD) were used as comparison metrics with paired t-test to compute p-values.
Results
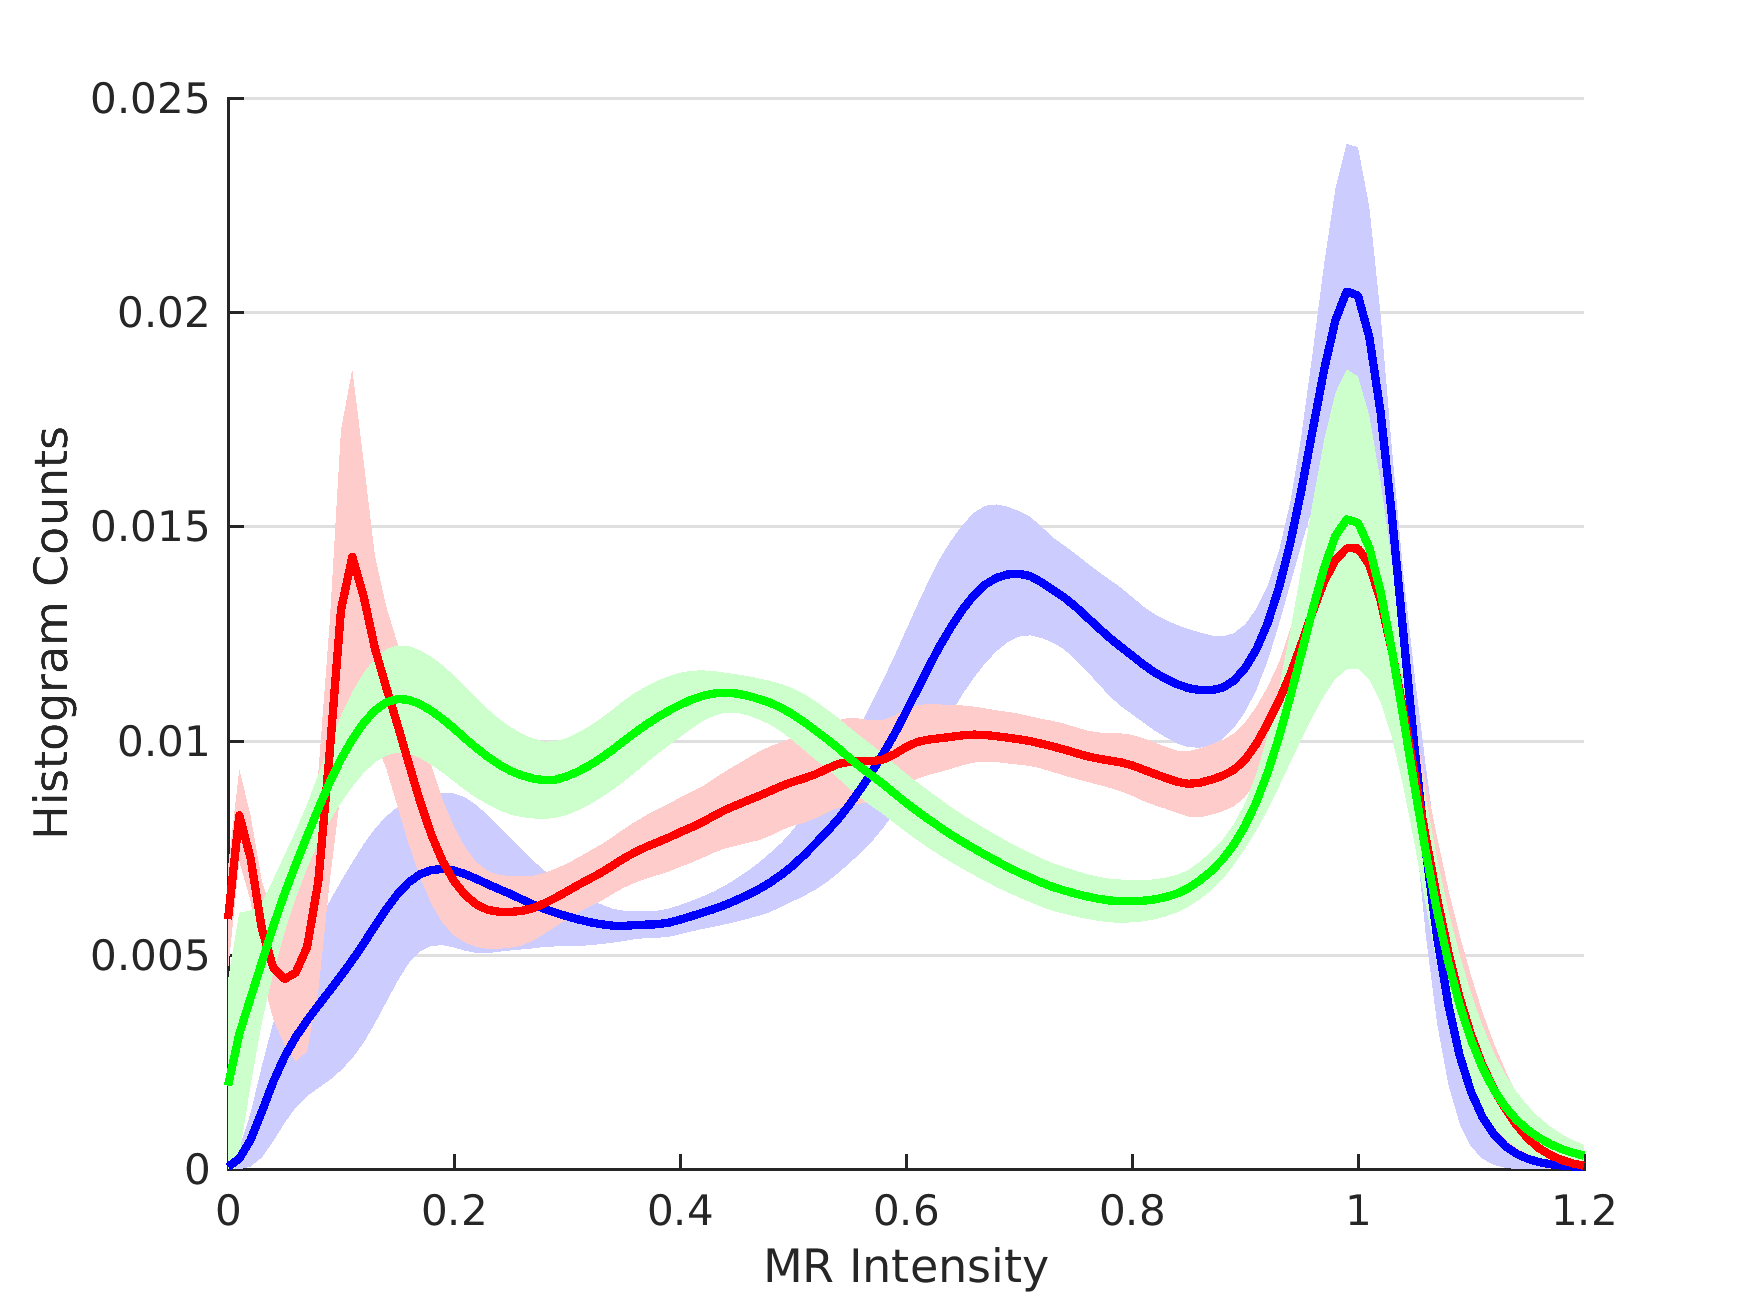
After synthesis, the MR intensity distributions of SynUMC images become more similar to JHU, with the average KL divergence5 from JHU reducing to 0.060 compared to 0.212 for UMC(p<0.001) for T1s, and reducing from 0.081 to 0.068(p=0.006) for FLAIRs. Similarly, the average KLD of JHU and SynJHU compared to UMC was 0.168 vs 0.153(p=0.045) for T1, and 0.744 vs 0.705(p=0.02) for FLAIR, indicating better intensity matching. Fig. 3 shows intensity histograms of UMC and SynUMC T1s compared to the JHU T1.
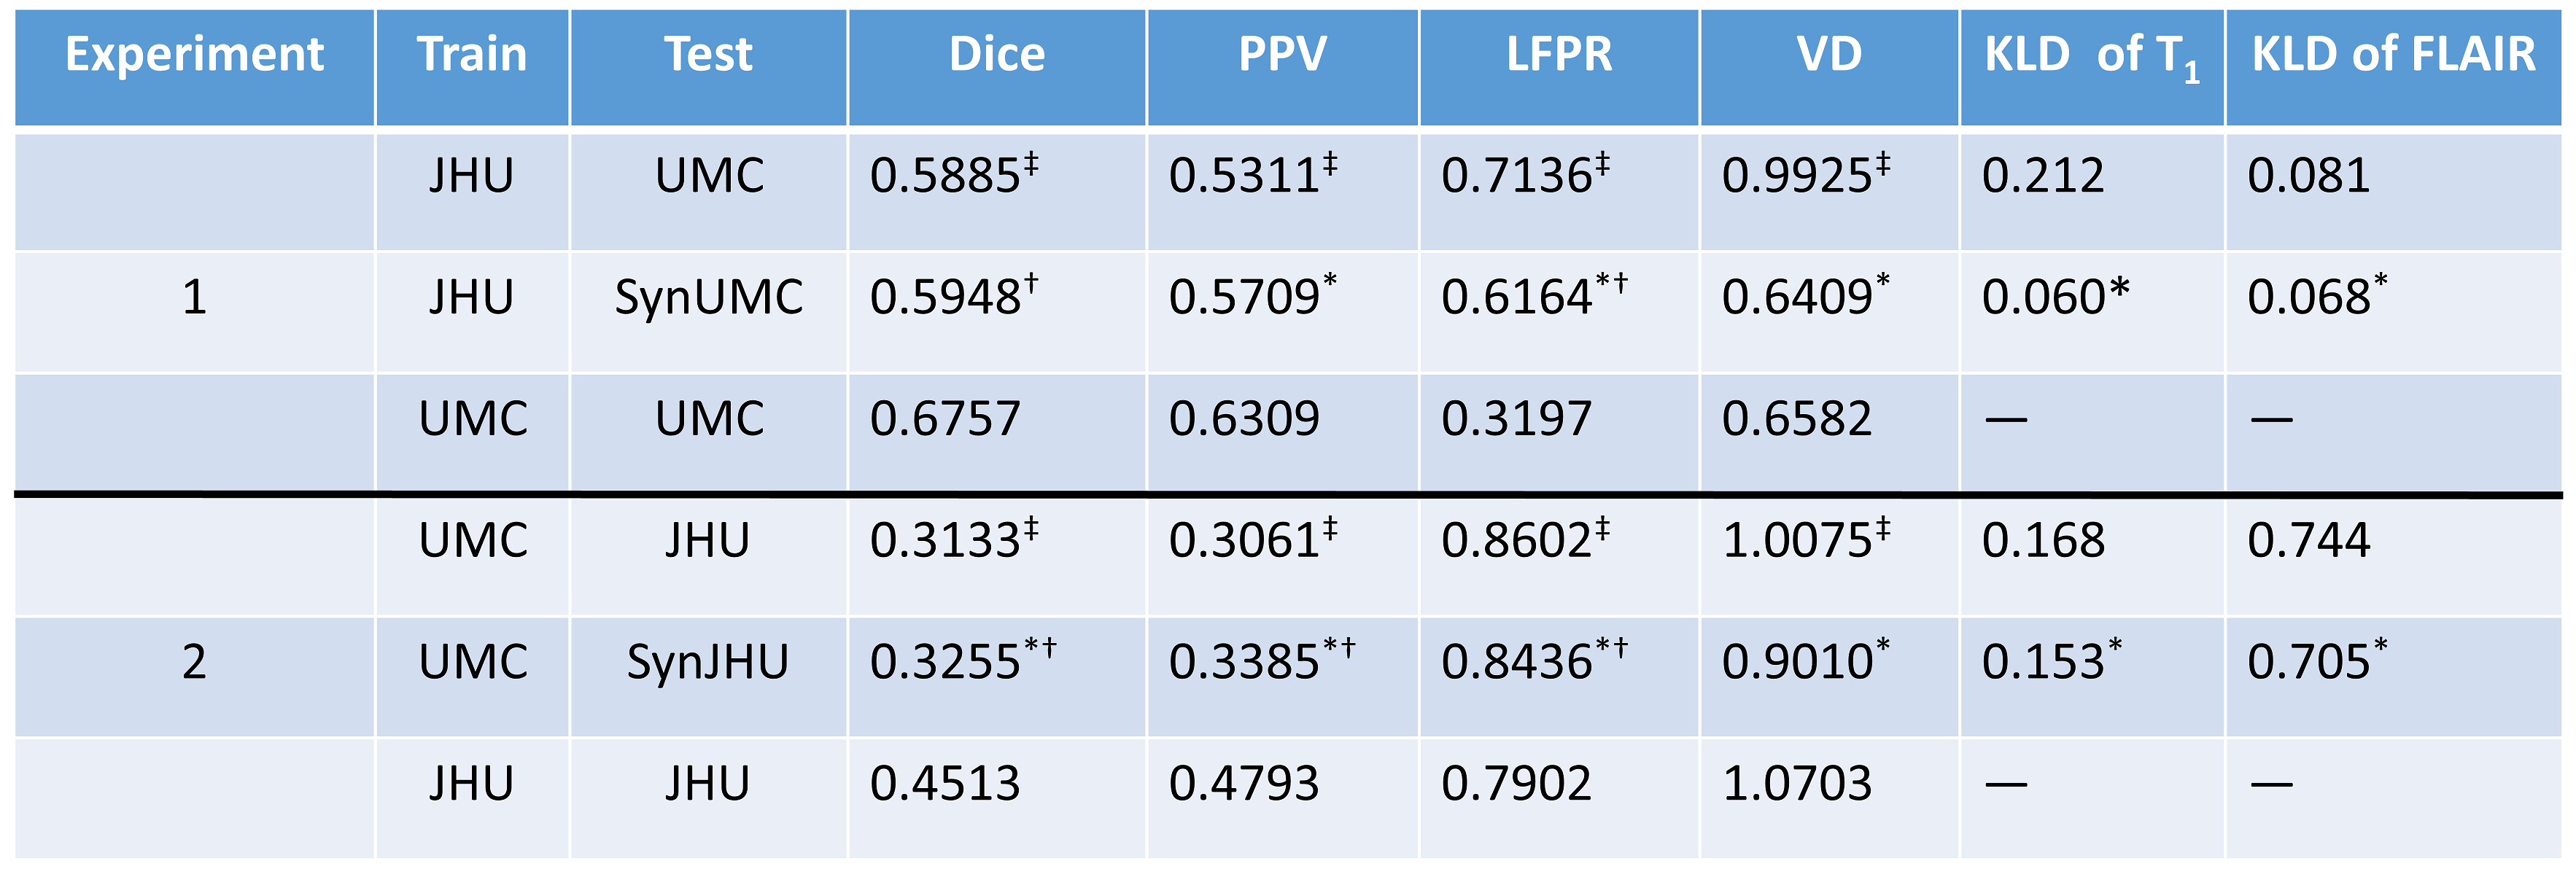
The best segmentation is achieved when it is trained with data from the same MR protocols. With UMC training applied to UMC images, mean Dice, PPV, LFPR, and VD were 0.6757, 0.6309, 0.3197, 0.6582. Segmentation with JHU training data on UMC resulted in 0.5885, 0.5311, 0.7136, and 0.9925, all of them being significantly worse. However, when SynUMC was segmented with JHU training data, metrics were improved to 0.5948, 0.5709, 0.6164, and 0.6409. Although Dice and LFPR were still significantly lower (p<0.01) than UMC training, PPV and VD became more similar (p>0.05). Fig. 4 shows detailed comparison between the original, synthetic and reference standard segmentations. Although the Dice scores of synthetic images were still lower than original training in both experiments, false positives were generally reduced.
For the second experiment, segmentation of JHU images with JHU training data resulted in mean Dice, PPV, LFPR, and VD as 0.4513, 0.4793, 0.7902, and 1.0703. Segmentation of JHU images with UMC training data yielded 0.3133, 0.3061, 0.8602, and 1.0075. Except for VD, the other three metrics were significantly worse than JHU training. However, UMC training on SynJHU yielded 0.3255, 0.3385, 0.8436, and 0.9010, where all of them significantly (p<0.001) improved from UMC training on JHU, with only VD statistically similar to JHU training.
Conclusion
Although training data from the same cohort gives the best possible accuracy, synthesized images, having similar MR image intensity properties as the target, produces improved lesion segmentations in absence of proper training data.Acknowledgements
This work was supported by the Department of Defense in the Center for Neuroscience and Regenerative Medicine and the Intramural Research Program of the National Institutes of Health. This work was also partially supported by grant from National MS Society RG-1507-05243 and NIH/NINDS R01NS082347.References
- Shinohara RT, Oh J, Nair G, et. al. Volumetric Analysis from a Harmonized Multisite Brain MRI Study of a Single Subject with Multiple Sclerosis. American J. of Neuroradiology. 2017;38(8):1501-1509.
- Gasperini C, Rovaris M, Sormani MP, et. al. Intra-observer, inter-observer and inter-scanner variations in brain MRI volume measurements in multiple sclerosis. Multiple Sclerosis Journal 2001;7(1):27-31.
- Roy S, Carass A, Prince JL. Patch based intensity normalization of brain MR images. Proc. IEEE Int Symp Biomed Imaging (ISBI). 2013; 342‐345.
- Roy S, Butman JA, Chan L, Pham DL. TBI contusion segmentation
from MRI using convolutional neural networks. Proc. IEEE Int Symp Biomed
Imaging (ISBI). 2018; 158‐162.
- Kullback S, Leibler RA. On information and sufficiency. Annals of Mathematical Statistics. 1951;22(1): 79–86.
- http://wmh.isi.uu.nl/data/
Figures