3105
A high-resolution multi-parametric quantitative method to investigate tissue (micro)structure1Institute of Neuroscience and Medicine, Research Centre Juelich, Juelich, Germany, 2JARA-BRAIN-Translational Medicine, Research Centre Juelich, Aachen, Germany, 3Institute of Neuroscience and Medicine (INM-11, JARA), Research Centre Juelich, Juelich, Germany, 4Department of Neurology, RWTH Aachen University, Aachen, Germany, 5Institute of Neuroscience and Medicine (INM-4), Research Centre Juelich, Juelich, Germany
Synopsis
We report on a multi-parametric quantitative method based on four 1x1x2mm3 3D multiple-echo gradient-echo acquisitions (GRE), complemented by AFI for B1+ mapping (whole-brain TA=21min). The most notable parameters derived are water content, T1 and T2*, magnetization transfer ratio (MTR), bound proton fraction (fbound) and magnetization exchange rate (kex). Results are reported from seven volunteers, one post-mortem brains and one tumour patient. The use of multiple contrasts for tissue segmentation is illustrated. Correlations between parameters are investigated with the aim of better understanding sources of T1 relaxation. f_bound and k_ex are found to be lower in tumour than in healthy tissue.
Introduction
Multi-contrast MRI provides deeper insight into tissue properties than single contrasts – e.g. for brain parcellation [1]. Going one step forward, we report on a multi-parametric quantitative method. Such information can be used for advanced in vivo neuroanatomy (e.g. tissue segmentation / brain parcellation [1, 2]);, various clinical questions (e.g. diabetes [3]), and to investigate tissue microstructure We illustrate in the following a small part of the many questions which can be addressed by multi-parametric quantitative mapping.Materials and Methods
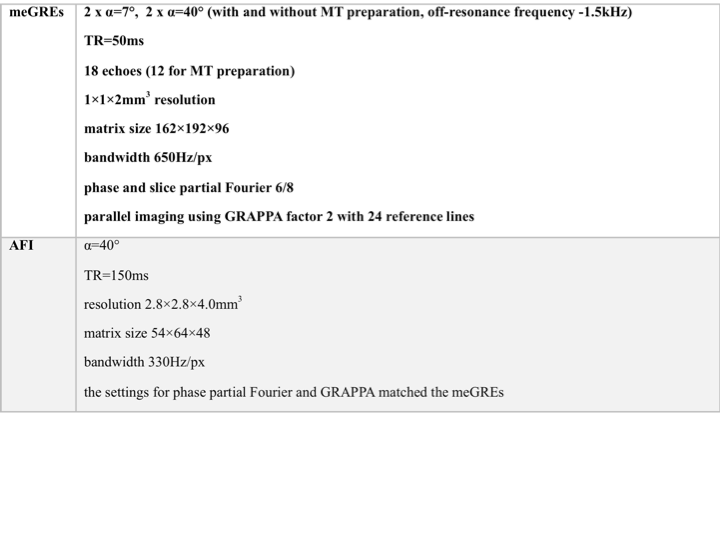
Eight volunteers (age 60-70, mean 65±3), one fixed brain (male donor 71 y.o., without known neurological affections) and one patient with glioblastoma multi-forme (female, 46 y.o.) were imaged using a 3T TRIO (Siemens, Erlangen) with body-coil transmit, 32-channel (volunteers) or 12-channel (fixed brains) receiver coil and a hybrid MR-PET (patient) with birdcage transmit and 8-element receiver coil. The optimal parameters were determined separately for in vivo and post-mortem scanning to provide highest accuracy and precision (similar to [4]). The acquisition parameters are summarized in Table 1. Water content and relaxation parameters were derived as described in [Schall 2018]. The same processing was applied to the MT-prepared scans, deriving the equilibrium magnetisation (M0sat) T1sat , and T2*sat influenced by magnetisation transfer. The following quantities were calculated:
MTR= (1-M0sat /M0)*100 [pu] ,
fbound≈M0b /M0a = MTR/T1 ,
kex(norm)=MTR/ T1sat /f_bound = T1 / T1sat ,
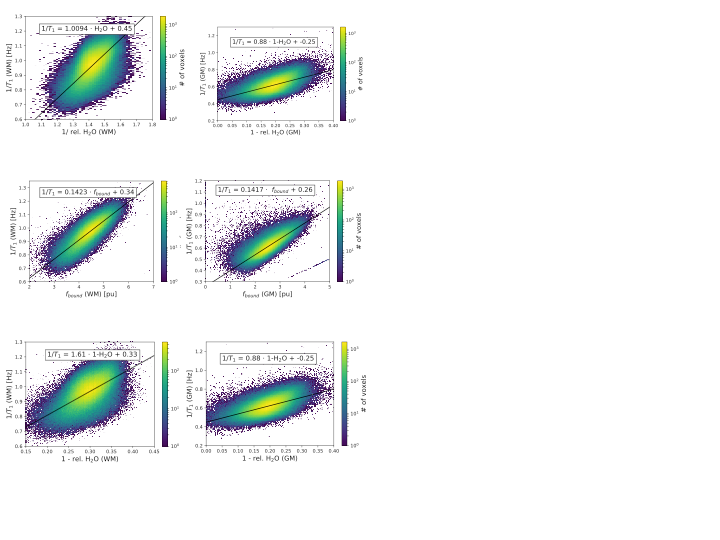
with [pu] percent unit, M0b bound proton, M0a free proton equilibrium magnetization and kex pseudo first-order constant for the transfer of magnetization [5, 6] normalised to the pool size. Since several parameters reflect the same basic properties of tissue in subtly different ways, the number of independent quantities extracted from the acquired magnitude data was qualitatively addressed by performing a principal component analysis (PCA) on the original data and by investigating correlations between the quantitative parameters. The latter most notably include the H2O-T1, fbound-T1 and H2O-fbound relationships. Two different models of T1 relaxation were investigated: bound-water mediated [8], resulting in a linear dependence of R1 on 1/H2O; and due to an averaged relaxivity of macromolecules R1~fbound or R1~(1-H2O) [see 7].
Results
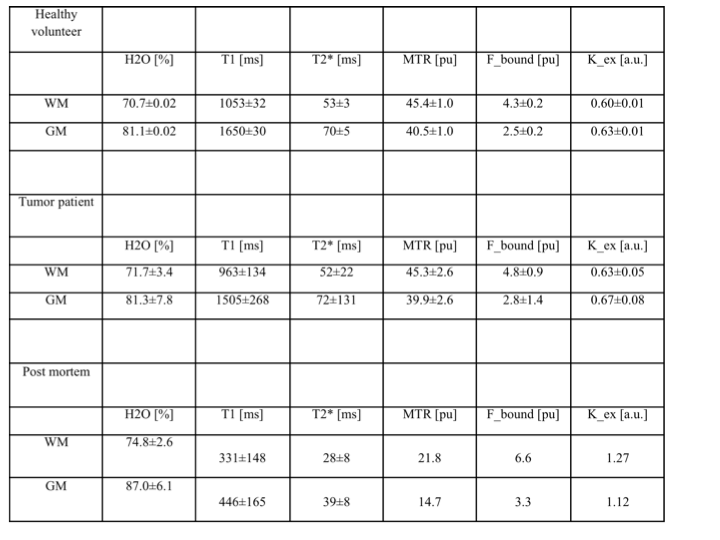
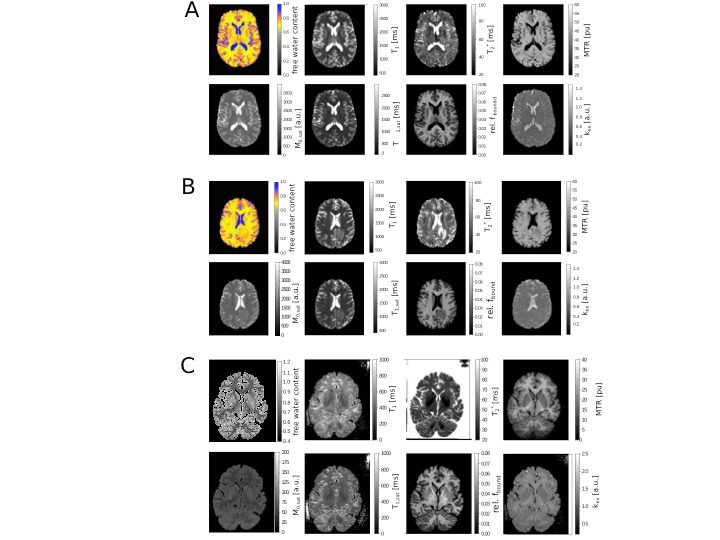
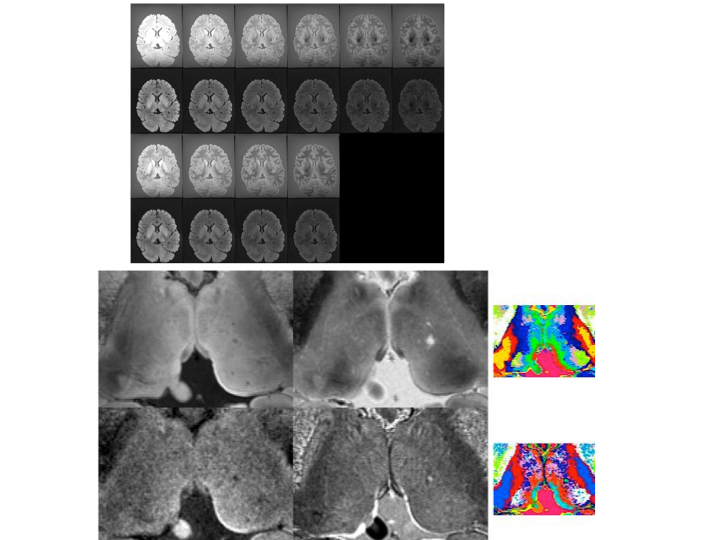
Figs. 1a-c show representative maps for a healthy volunteer, a tumour patient and a fixed brain. The mean values for each tissue class are listed in Table 2. The PCA analysis of the acquired 60 contrasts in vivo and 28 in fixed tissue identified 7-8 signal-containing components. Based on these high-SNR contrasts, tissue segmentation can be easily performed, as shown in Fig. 2. By discarding the remaining components a substantial noise reduction can be achieved. Scatter plots depicting correlations between H2O, fbound and T1 are shown in Fig. 3a-c together with linear fit coefficients.Discussion and Conclusions
In addition to water content - shown to be highly
regulated in the healthy brain and sensitive to disease [9]- and relaxation
parameters T1 and T2*, the present method incorporates simultaneously derived qMT
information. The two underlying assumptions are that the bound proton pool is
fully saturated and that direct saturation of the water pool is negligible. High-resolution,
whole-brain coverage can be achieved in TA=21min, which can be easily reduced
by decreasing the resolution, reducing the coverage and/or increasing the
acceleration factor for parallel imaging at higher fields. Compared to other methods
for macromolecular proton fraction mapping [10], the present method additionally
provides water content (among others, the exact complement of the entire
macromolecular pool) and T2* (sensitive to iron content/distribution and myelin),
uses clinically available sequences and simplicity of modelling. The calculated
fbound maps are visually equivalent to those derived from more
rigorous approaches to MT theory [10], but the exact values are 2-3 times
smaller. However, the rigourous MT analysis can be applied to the present data
retrospectively, since the acquisition parameters are not far from the
optimized ones [10]. High intra-subject contrast accompanied by reduced inter-subject
variability of fbound in the healthy collective warrants usefulness
in describing e.g. pathological demyelination. By investigating correlations
between T1 and simultaneously acquired H2O and MT-derived fbound,
mechanisms for T1 relaxation can be investigated more closely. Correlation
coefficients between H2O and T1 might reflect properties of water pools in the
brain [8] and show promise to characterizing disease [e.g. meningioma11].
Whereas kex largely lacks contrast in healthy tissue, it decreases
in the tumour region (Fig. 1), the reason remains to be investigated.
Finally,
in comparison to multi-contrast-weighted imaging, multi-parametric,
quantitative imaging has the indisputable advantage of describing biological quantities
relevant to disease and tissue microscopy.Acknowledgements
No acknowledgement found.References
[1] Foucher et al, PLOS One. 2018 Jun 15;13(6):e0196297. doi: 10.1371/journal.pone.0196297
[2] Glasser, M. F., Coalson, T. S., Robinson, E. C., Hacker, C. D., Harwell, J., Yacoub, E., . . . Van Essen, D. C. (2016). A multi-modal parcellation of human cerebral cortex. Nature, 536(7615), 171-178. doi:10.1038/nature18933
[3] Oros-Peusquens et al., Proc. Intl. Soc. Magn. Reson. Med. 2018
[4] Schall et al, 2018, PLOS One, 13(8)
[5] Wolff and Balaban, 1989, Magnetic Resonance in Medicine, 10(1):135-144
[6] Tofts, 2003, Quantitative MRI of the brain, John Wiley and Sons Ltd.
[7] Rooney, 2007, Magnetic Resonance in Medicine, 72(2):308-318
[8] Fatouros and Marmarou, 1999, Neurosurgery, 90(1):109-115
[9] Shah NJ, Ermer V, Oros-Peusquens, A. M. (2011). Measuring the absolute water content of the brain using quantitative MRI. Methods Mol Biol, 711, 29-64. doi:10.1007/978-1-61737-992-5_3
[10] K. Li et al. Magn Reson Med. 2016. 76: 635–644. doi:10.1002/mrm.25893.
[11] Oros-Peusquens et al, Proc. Intl. Soc. Magn. Reson. Med. 2016
[12] Koenig, S. H. (1991). Cholesterol of myelin is the determinant of gray-white contrast in MRI of brain. Magn Reson Med, 20(2), 285-291.
Figures