3103
Accelerated quantification of ultrashort-T2 brain components with ultrashort-TE relaxometry1Department of Radiology and Biomedical Imaging, University of California San Francisco, San Francisco, CA, United States
Synopsis
This study presents accelerated quantification of the ultrashort-T2 components in the brain with approximately 4-fold reduction in scan time. Retrospective undersampling across 5 healthy volunteers showed strong correlations between the ultrashort-T2 component amplitude, relaxation times, and frequency shifts between 8 TE and 32 TE datasets, showing that it is possible to rapidly obtain high quality images of brain ultrashort T2 components that are associated with myelin membrane protons.
Introduction
Recent studies have characterized ultrashort-T2 components in the brain using a novel ultrashort echo time (UTE) relaxometry method5. These components are most likely associated with methylene protons in myelin phospholipid membranes and are potentially a more direct measure of myelination1, 2, 3, 4, 5. To characterize such components, prior studies acquired 32 different TE’s within a single scan, requiring 45-50 minutes for whole head coverage. While important for initial characterizations, such scans cause discomfort to the subject and are impractical for routine studies. Here we present correlation studies across five separate subjects which show that using a fewer TE count (8) still results in high fidelity images with almost no image quality loss while greatly reducing scan time. When using 8 TEs, a factor of 4 acceleration, components of the signal such as the magnitude (rho), relaxation time (T2*), and frequency shift (∆f) were highly correlated with the parameters derived from the original 32 TEs.Methods
Acquisition
Whole brain relaxometry was performed on a GE MR750 3T MRI scanner using a 3D UTE pulse sequence with a non-selective hard pulse excitation. The delay between excitation and readout was shifted between TRs to acquire 32 different sets of TEs within a single scan ranging from: 24µs to 5ms. “32TE” = [24, 40, 60, 80, 120, 160, 200, 280, 360, 440, 600, 800, 1000, 1200, 1400, 1600, 1800, 2000, 2200, 2400, 2600, 2800, 3000, 3200, 3400, 3600, 3800, 4000, 4200, 4400, 4600, 5000] µs. Images were fitted with all 32 TEs as well as subset of strategically chosen TEs to include TEs < 1ms as well as fat/water in-phase and out-of-phase TEs for quantification of the ultrashort-T2 component that has a chemical shift similar to lipids2,5. The subsets of TEs tested were: “8TE (1)” = [24, 120, 280, 440, 1000, 2200, 3200, 4400] µs, “8TE (2)” = [24, 80, 200, 360, 600, 1000, 2200, 4400] µs, “7TE” = [24, 120, 280, 440, 1000, 2200, 4400] µs, “6TE” = [24, 200, 440, 1000, 2200, 4400] µs. Other key parameters were 2-2.2 mm isotropic resolution, 4.1-5.8-fold parallel imaging acceleration reconstructed with non-Cartesian ESPIRiT6, and a total scan time of 45 minutes for 32 TEs.
Fitting method
All sets of TE data were fit to the following signal model to estimate the component relaxation times, \Tts, and frequency shifts, $$\Delta f_k$$:
$$S(TE)=\exp(i2\pi\Delta f_x TE) \sum_{k=1}^N \rho_{k} \exp(-TE/T_{2,k}^*) exp(i2\pi \Delta f_k TE + \phi_k)$$
with $$N=2$$ components where the first captured all long-T2* (> 1 ms) components and the second captured the ultrashort-T2* (< 1 ms) components. Fitting code is available online at https://github.com/LarsonLab/UTEMRI_Brain.
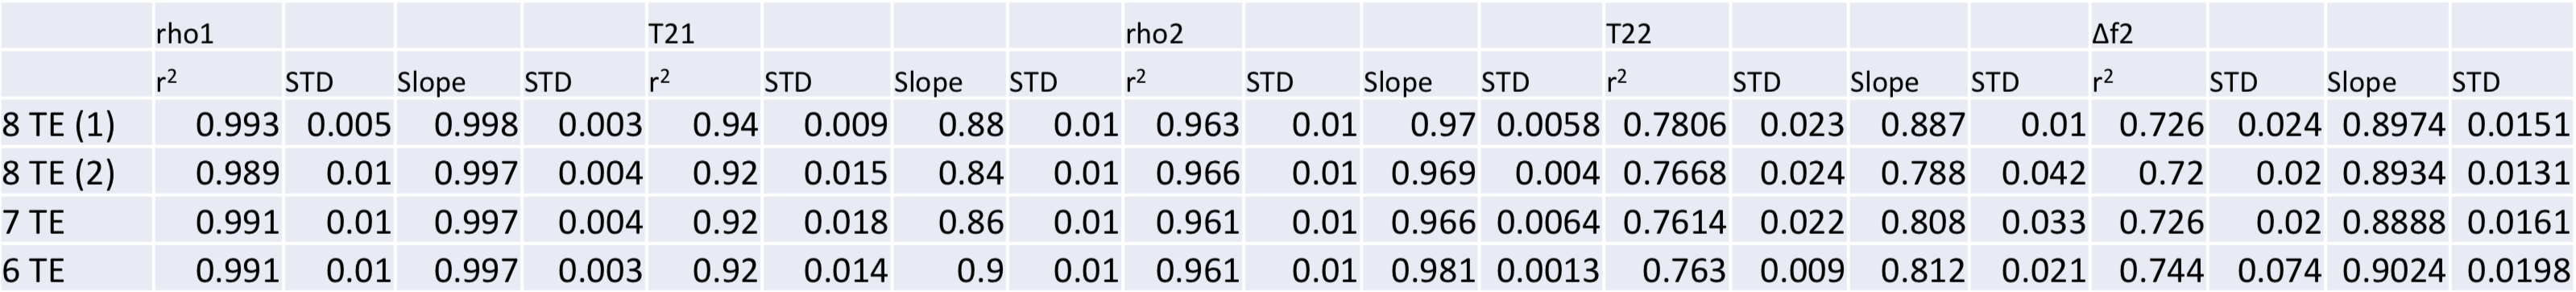
Correlation of determination values (r2) and slopes were calculated using MATLAB (Mathworks) to compare different sets of TEs. Robust fitting was computed for the ultrashort-T2 component magnitude (rho2) to reduce the effect of outliers during fitting.
Results and Discussion
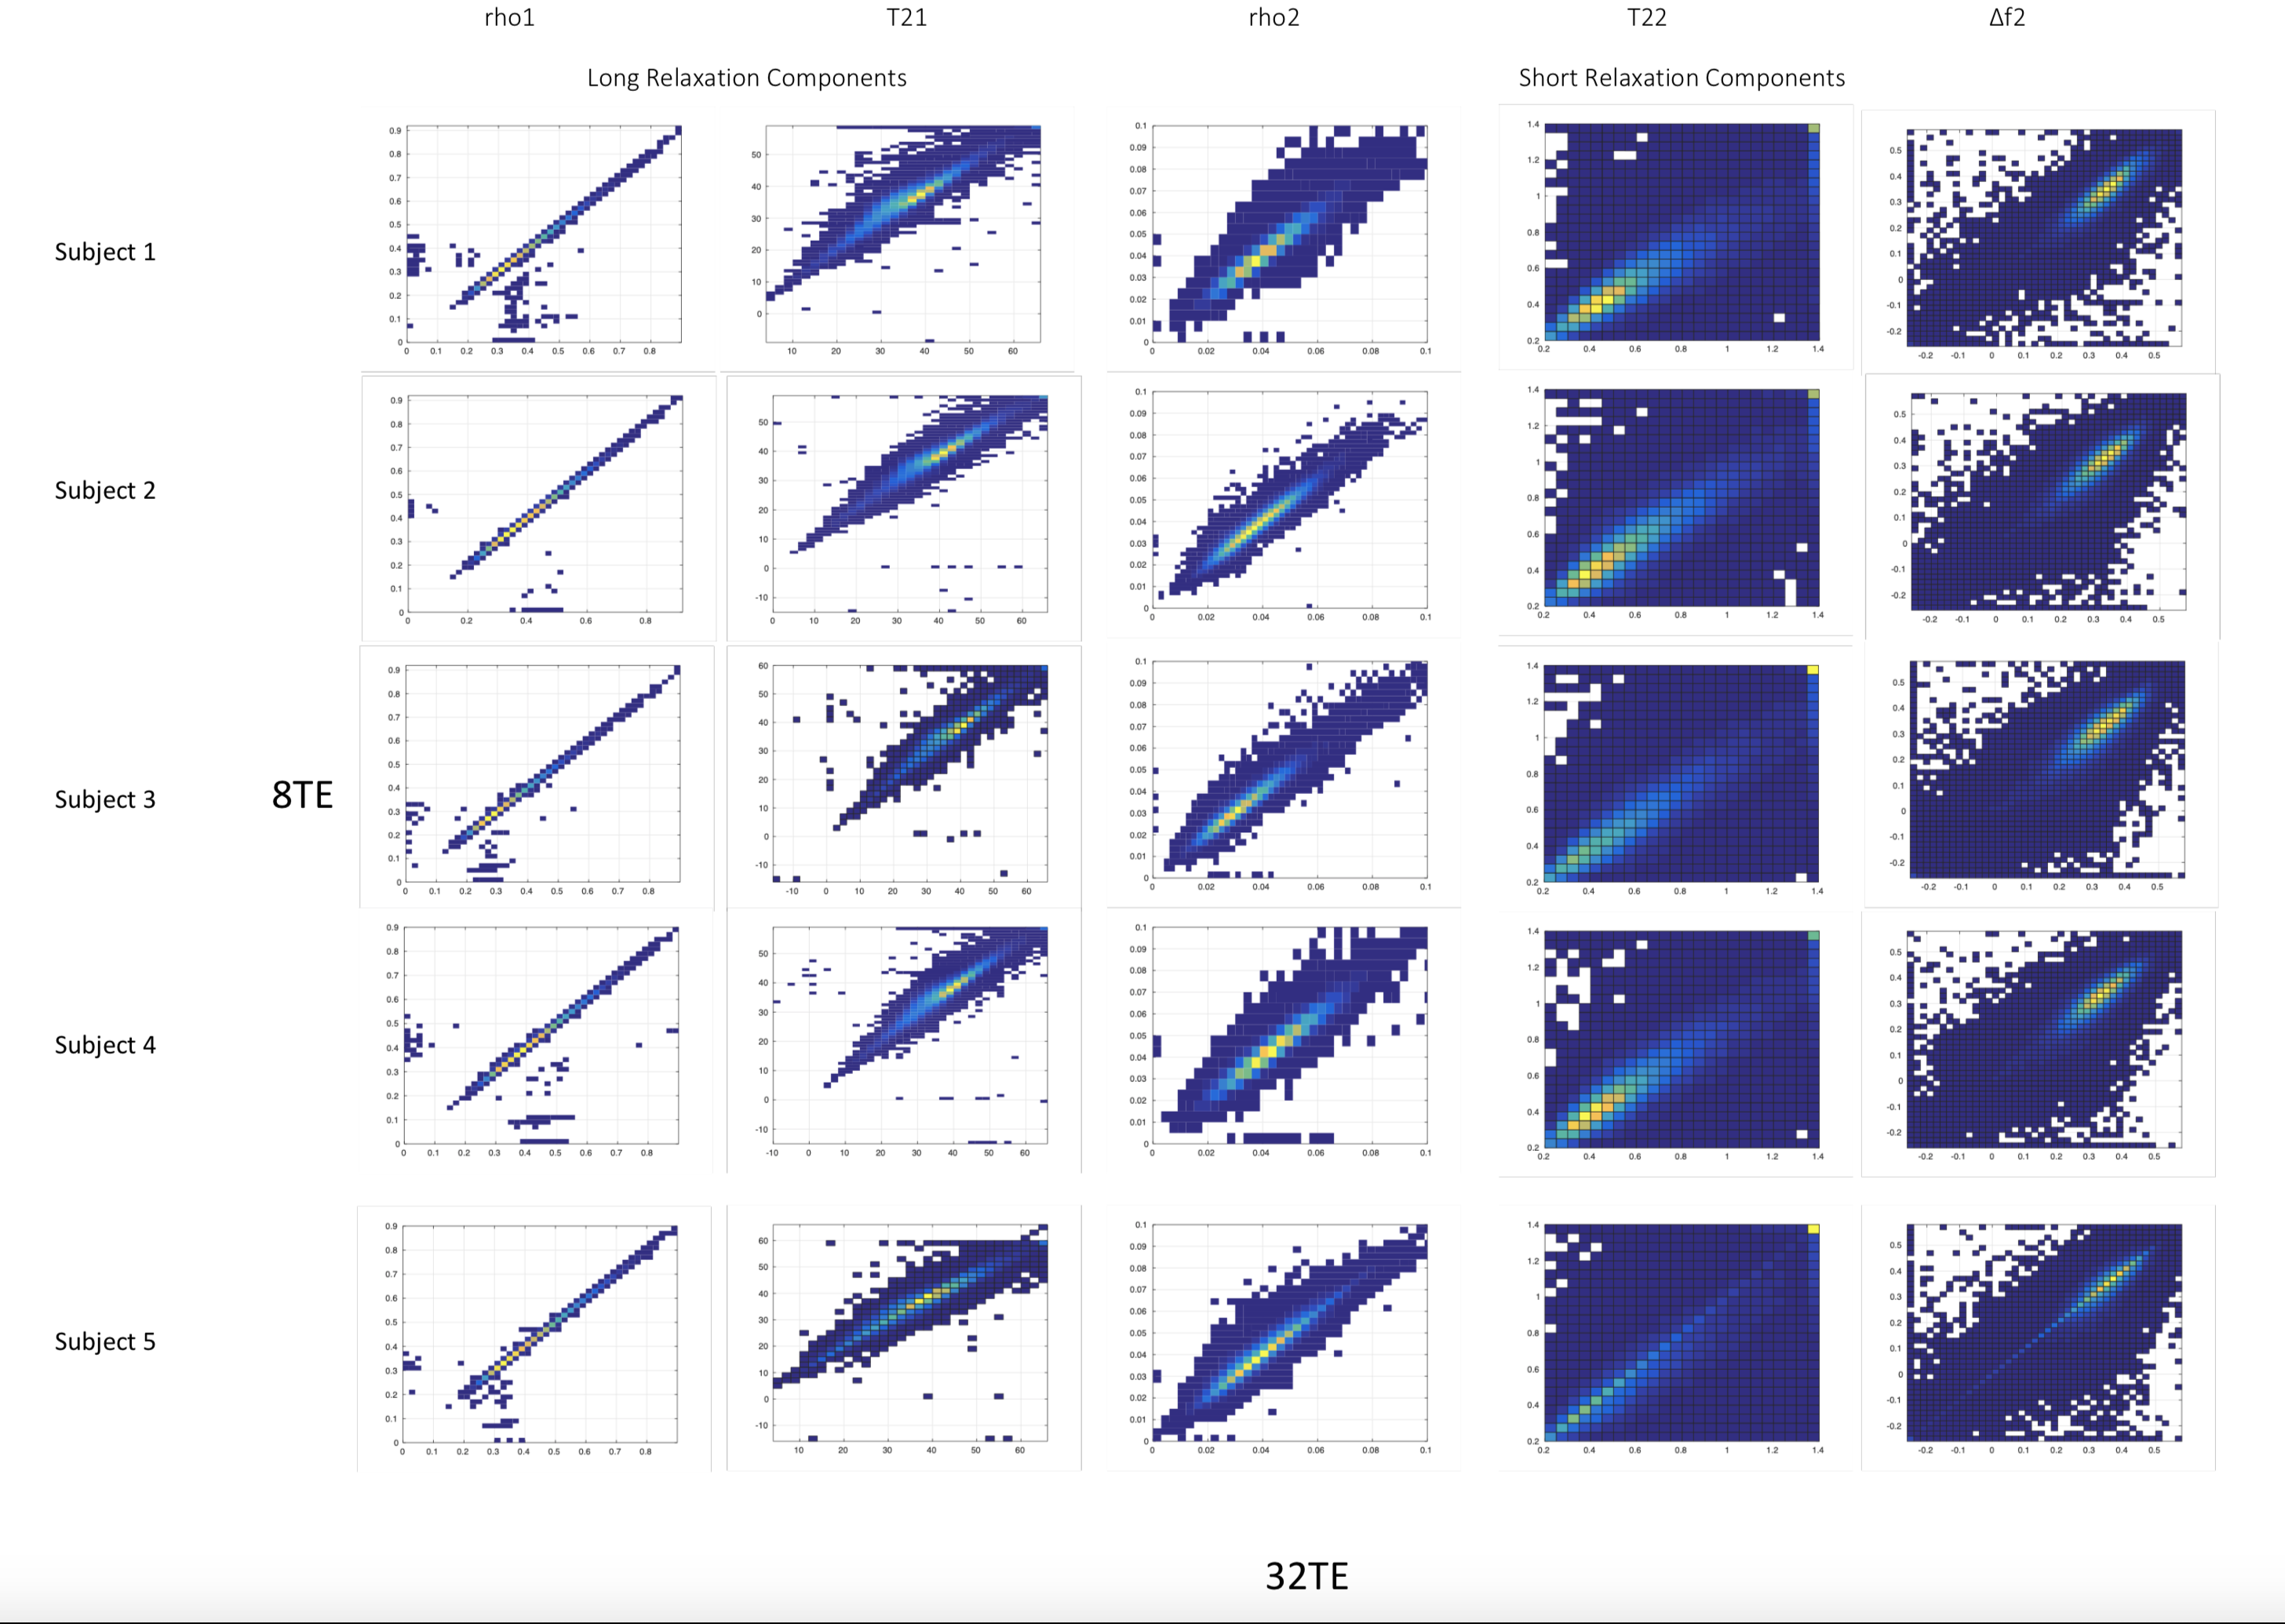
The correlation plots in Figure 1 show strong positive correlations for both short and long components when fitted with 32TE and 8TEs. We see a high correlation for the magnitude of the ultrashort-T2 components (rho2), our key parameter of interest. Lower correlation for the ultrashort-T2 relaxation time (T22) as well as ultrashort-T2 component frequency shift (∆f2) are also visible.
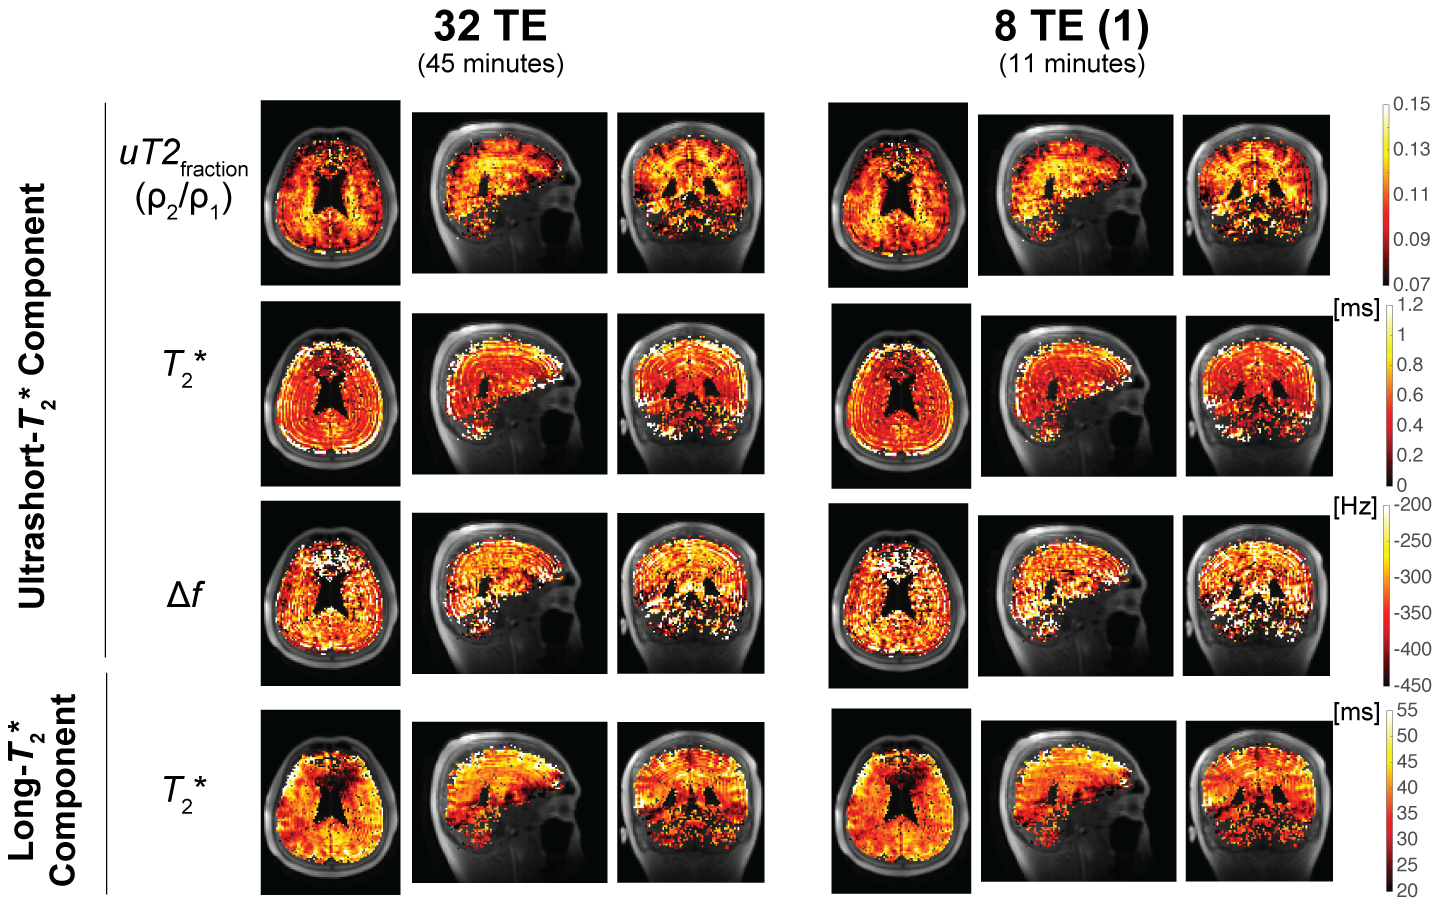
Parameter maps generated with 32 TEs and retrospectively with 8 TEs show a high degree of similarity in distribution across the brain (Fig. 2). Ultrashort-T2 fraction is primarily elevated in white matter with both datasets. The long-T2 component relaxation time is estimated to be shorter with the 8TE subset, likely due to less longer TE times in the fitting. The subsampling shows no apparent changes in our key parameter of interest, the ultrashort-T2 component fraction (rho2/rho1). The cerebellum and the frontal sinuses were excluded from fitting due to large magnetic field shifts resulting from susceptibility differences.
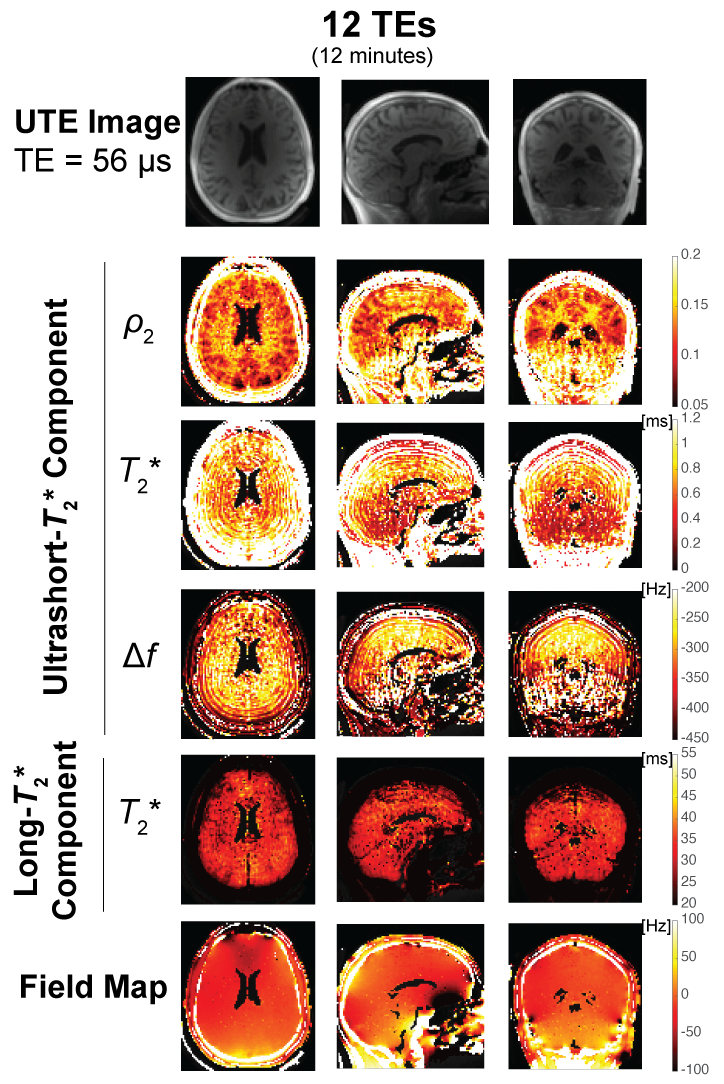
Prospective-derived ultrashort-T2 relaxometry parameter maps (Fig. 4) showed the ultrashort-T2 component magnitude (rho) maps had correspondence with white matter. Compared to the retrospective studies, this scan had increased T1-weighting that lead to some shifts in the parameter value ranges. The results of this scan demonstrate the ability to acquire ultrashort-T2 relaxometry in clinically feasible scan times.
Conclusion
We present a comparison study on the effects of relaxometry-based fitting ultrashort T2 components in the brain with as few as 8 TEs for acceleration. We see strong correlations between 32TE and 8TE fit images and a positive qualitative assessment when viewing parameter fit maps consistent over 5 volunteers. These results show the feasibility of achieving high quality images of ultrashort T2 brain components with an accelerated scan time, reducing discomfort and/or noncompliance of patients who undergo such scans and allowing for this method to be easily combined in a protocol with other image contrasts.Acknowledgements
This work was supported by research grants: NIH R21NS089004, NMSS research grant PP3360.References
1. Horch, R. A., Gore, J. C., & Does, M. D. (2011) Origins of the ultrashort-T(2) (1) H NMR signals in myelinated nerve: A direct measure of myelin content?. Magn Reson Med 66, 24-31.
2. Wilhelm, M. J., Ong, H. H., Wehrli, S. L., Li, C., Tsai, P.-H., Hackney, D. B., & Wehrli, F. W. (2012) Direct magnetic resonance detection of myelin and prospects for quantitative imaging of myelin density. Proc Natl Acad Sci U S A109, 9605-10.
3. Du, J., Ma, G., Li, S., Carl, M., Szeverenyi, N. M., VandenBerg, S., Corey-Bloom, J., & Bydder, G. M. (2014) Ultrashort echo time (UTE) magnetic resonance imaging of the short T2 components in white matter of the brain using a clinical 3T scanner. Neuroimage 87, 32-41.
4. Du J., Sheth V., He Q., Carl M., Chen J., Corey-Bloom J., Bydder GM. Measurement of T1 of the ultrashort T2* components in white matter of the brain at 3T. PLoS One 2014;9:e103296.
5. Boucneau, T., Cao P, Tang, S., Han M., Xuan D., Henry RG., & Larson PEZ. (2018) In Vivo Characterization of Brain Ultrashort-T2 Components. Magn Reson Med, 80(2), 726-735.
6. Uecker, M., Lai, P., Murphy, M. J., Virtue, P., Elad, M., Pauly, J. M., Vasanawala, S. S., & Lustig, M. (2013) ESPIRiT-an eigenvalue approach to autocalibrating parallel MRI: Where SENSE meets GRAPPA. Magn Reson Med, 71(3), 990-1001.
Figures