3102
Preliminary Research of ischemic penumbra in human subacute stroke patients combinating use of amide proton transfer (APT) Chemical Exchange Saturation Transfer (CEST) and arterial spin-labeling (ASL) MRI1Department of Medical Imaging Center, Nanfang Hospital,Southern Medical University, Guangzhou, China, 2Philips Healthcare, Guangzhou, China
Synopsis
The purpose of this word was to explore the feasibility of amide proton transfer(APT) assisting arterial spin-labeling(ASL) and diffusion-weighted imaging(DWI) in identiflication and definition of ischemic penumbra in subacute stroke .Our results showed that APTWI deficits were always larger than or equal to DWI deficits and smaller than or equal to ASL-CBF deficits in subacute stroke. ATPWI deficits coincided with the resulting infarct area at follow-up endpoint. Final infarcts were smaller than CBF deficits and larger than or equal to subacute DWI deficits.APT can provide information complementary on cell metabolism to ASL and DWI in the definition of ischemic tissue.
Introduction
Currently, imaging methods that can detect the ischemic penumbra in late ischemic stroke (onset time>24h, subacute stroke) or reveal the onset time are desired by many clinicians(1-3). As a result of heterogeneity of ischemia tissue injury, the regions of ischemic penumbra in patients that may be outside the approved time window for the rt-PA intravenous thrombolysis treatment may still recover function(1-3). Perfusion-weighted imaging (PWI) and diffusion-weighted imaging (DWI) can identify regions of hypoperfusion and ischemia core, respectively(4). However it often remains unclear whether a PWI-DWI mismatch corresponds to benign oligemia or a true ischemic penumbra (IP)(5). The purpose of the preliminary research is to investigate the feasibility of APT-weighted MRI in the clinical identification and definition of IP in subacute stroke.Patients and Methods
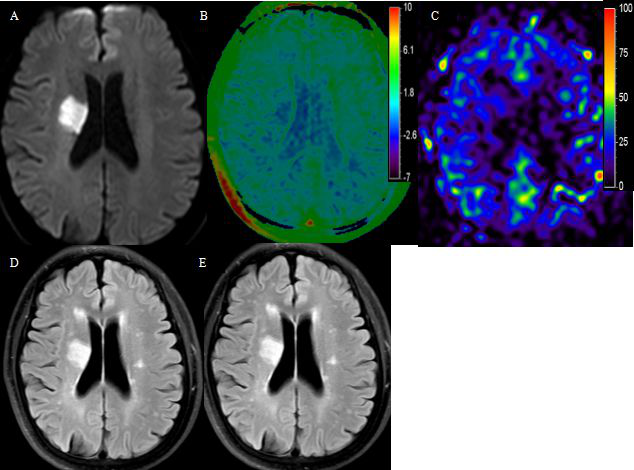
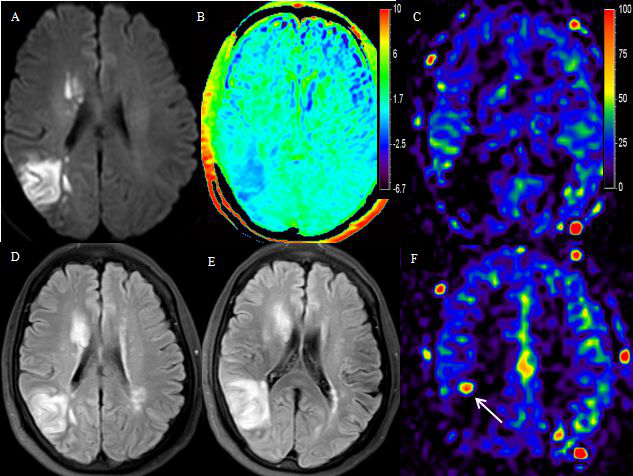
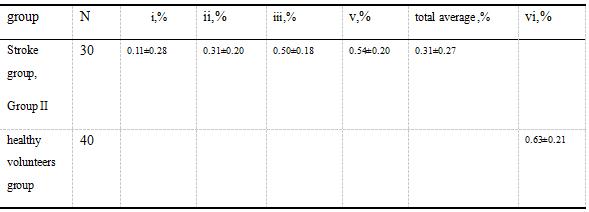
80 subjects were enrolled, including 40 patients of subacute (stroke onset time :1d-14d) ischemic stroke, and 40 age/gender-matched healthy volunteers. All participants were performed head MRI on a 3T Philips Achieva TX system. The imaging protocol included the following sequences: T2-weighted imaging (T2WI), T1-weighted imaging (T1WI), fluid-attenuated-inversion-recovery (FLAIR), arterial spin labeling (ASL) , amide proton transfer-weighted imaging (APTWI).The final infarct size was assessed by follow-up FLAIR on 25 subacute stroke patients after 10-14d. DWI, ASL-CBF, APTmapping, follow-up FLAIR were imported into the post-processing improved brain perfusion protocol to compare the largest area ratio between the lesion regions. The APT values of the lesion regions and the contralateral normal appearance white matter regions were measured on the APT mappings. In healthy volunteers, the slice of basal ganglia was selected to acquire the APT mappings and the APTW values of the bilateral temporal lobe were measured. 40 cases of subacute stroke group were assigned to two groups based on DWI/CBF mismatch(refer to the Result of GroupI, Group II below). The following tissue outcome definitions were used in the analysis: (i) ischaemic/infarcte core: tissue high signal in DWI or deficit in ADC; (ii) infarct growth: tissue APT deficit and ADC deficit/DWI high signal mismatch, follow-up FLAIR progressed to final infarct tissue; (iii) benign oligaemia: tissue APT deficit and perfusion deficit mismatch, but not the final FLAIR infarct; (iv) the final FLAIR infarct: tissue high signal in follow-up FLAIR; and (v) NAWM(nomal-appearing-white-matter):the contralateral nomal-appearing-white-matter of stroke tissue; (vi)HVNTWM: healthy volunteers nomal temporal lobe white matter. The differences of APT values between the contralateral normal regions(v) of the subacute stroke group and the temporal lobe white matter of healthy volunteers (vi)were compared by Independent-sample t test. The differences of APT values between all lesion regions(i-iii) and contralateral normal regions in the subacute stroke group were compared with the paired t test. ANOVA and repeated measures ANOVA were used for APTW values of multiple region (i-iii) of interest comparisons.
Result
Discussion
This study showed a biologically reliable intracellular signal (APT-MRI signal) associated with a decrease in chemical proton transfer rate (related to pH decline in cell acidosis) and tissue final outcome, which can evaluate the metabolic status and progress trend of brain in APT deficit areas.The results demonstrate the APT helps to subdivide the ASL-DWI mismatch area into regions with or without tissue acidosis,that is the boundary of the ischemic penumbra.
Conclusion
Acknowledgements
NoReferences
[1] Rimmele DL, Thomalla G. Wake-up stroke: clinical characteristics,imaging findings, and treatment option - an update[J]. Front Neurol,2014,5:35.
[2] Darby D,Barber P,Gerraty R,Desmond P,Yang Q,Parsons M,et al.Pathophysiological topography of acute ischemia by combined diffusion-weighted and perfusion MRI[J],Stroke,1999,30(10):2043-2052.[3] Nogueira RG, Jadhav AP, Haussen DC,et al. Thrombectomy 6 to 24 hours after stroke with a mismatch between deficit and infarct[J]. N Engl J Med 2018,378: 11-21.
[4] Lansberg MG, Lee J, Christensen S, Straka M, De Silva DA, Mlynash M, et al. Rapid automated patient selection for reperfusion therapy: A pooled analysis of the echoplanar imaging thrombolytic evaluation trial (EPITHET) and the diffusion and perfusion imaging evaluation for understanding stroke evolution (DEFUSE) study[J]. Stroke,2011, 42:1608–1614.
[5] Sun PZ,Wang E ,Cheung JS.Imaging acute ischemic tissue acidosis with pH-sensitive endogenous amide proton transfer(APT)MRI-correction of tissue relaxation and concomitant RF irradiation effects toward mapping quantitative cerebral tissue pH[J].Neuroimage,2012,60(1):1-6.
Figures