3100
3D-QALAS Sequence for Brain Volumetry and Cortical Thickness: Comparison with 3D MPRAGE and Scan-Rescan Repeatability1Department of Radiology, Juntendo University, Tokyo, Japan, 2Department of Radiology, The University of Tokyo, Tokyo, Japan
Synopsis
Previous quantitative synthetic MRI of the brain has been solely performed in 2D. Here, we evaluated the feasibility of the recently developed 3D-QALASsequence for brain cortical thickness and volumetric analysis in healthy volunteers. 3D-
Introduction
Quantitative synthetic MRI enables simultaneous quantification of T1 and T2 relaxation times and proton density with high reliability,1and has been proposed for whole brain coverage.2,3 The original sequence used for quantitative synthetic MRI was based on a multi-slice 2D acquisition, providing a relatively low resolution in the slice direction in comparison to conventional 3D T1-weighted acquisitions. Recently, however, 3D-QALAS (3D-quantification using an interleaved Look-Locker acquisition sequence with T2 preparation pulse) has been developed for simultaneous quantification of T1 and T2 in cardiac imaging.4,5 Here, we propose an application of the 3D-QALAS sequence for simultaneous acquisition of relaxometry parameters as well as for obtaining volumetric information in high-resolution 3D. Therefore, the purpose of this study was to show the validity of volumetric information acquired with 3D-QALAS.Methods
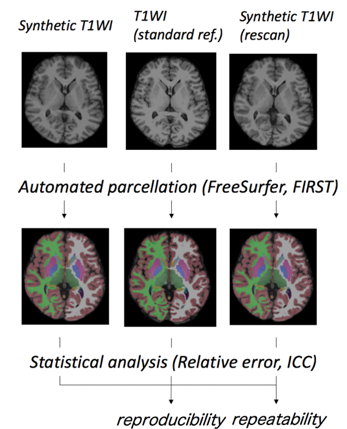
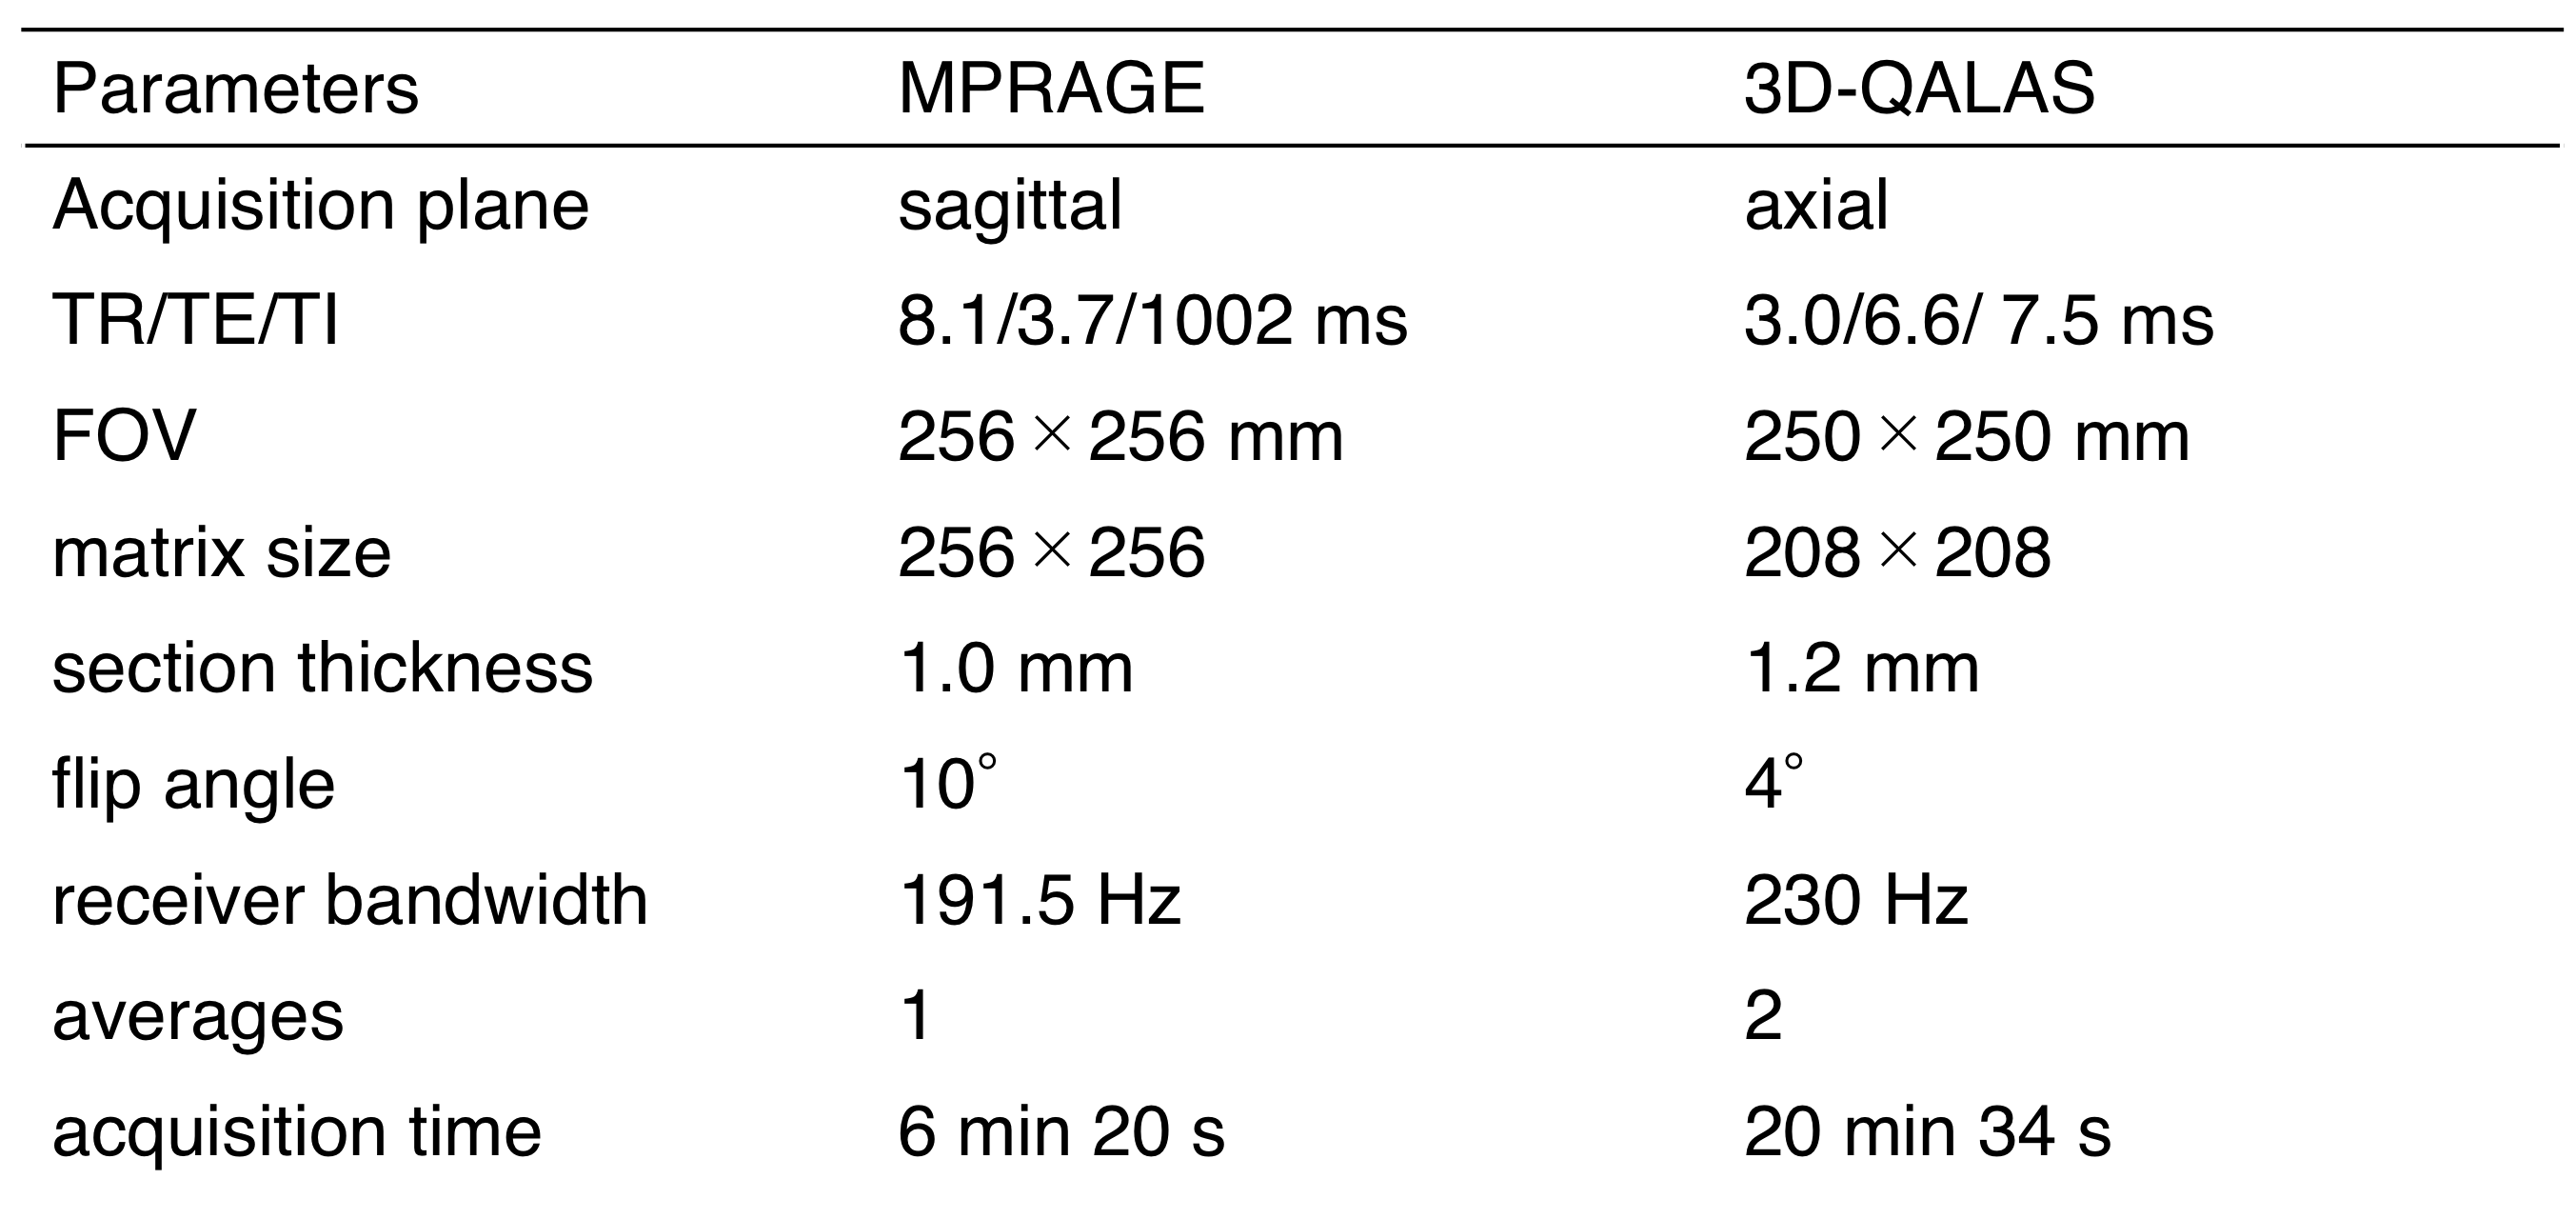
Ten healthy volunteers were included in this study (3 women and 7 men; mean age, 23.2 ± 3.6 [SD] years). All participants were scanned on a 1.5 T scanner (A patched R5.3.0 Ingenia, Philips Healthcare, Best, The Netherlands) with a 12-channel head coil. 3D T1-weighted MPRAGE sequence was performed once, and 3D-QALAS sequence was performed twice (to test scan-rescan) in the same session on all the participants (Fig. 1). All imaging parameters for MPRAGE and 3D-QALAS are listed in Table 1. Images obtained from 3D-QALAS sequence were processed on a prototype version 0.45.1 of the SyMRI software (SyntheticMR, Linköping, Sweden) to synthesize 3D synthetic T1-weighted images by virtually setting TR to 500 ms and TE to 10 ms. The pipeline of FreeSurfer (Version 5.3.0) was used to obtain average cortical thickness in Desikan-Killiany Atlas for each sequence.6-8 The volumes of subcortical structures were obtained using the pipeline of FMRIB Integrated Registration and Segmentation Tool (FIRST) implemented in the FMRIB Software Library version 5.0.9.9 Percent relative difference and intraclass correlation coefficient (ICC) were used to assess the reproducibility and repeatability of the 3D-QALAS sequence-derived measurements.Results
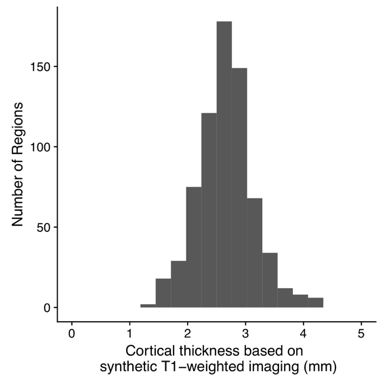
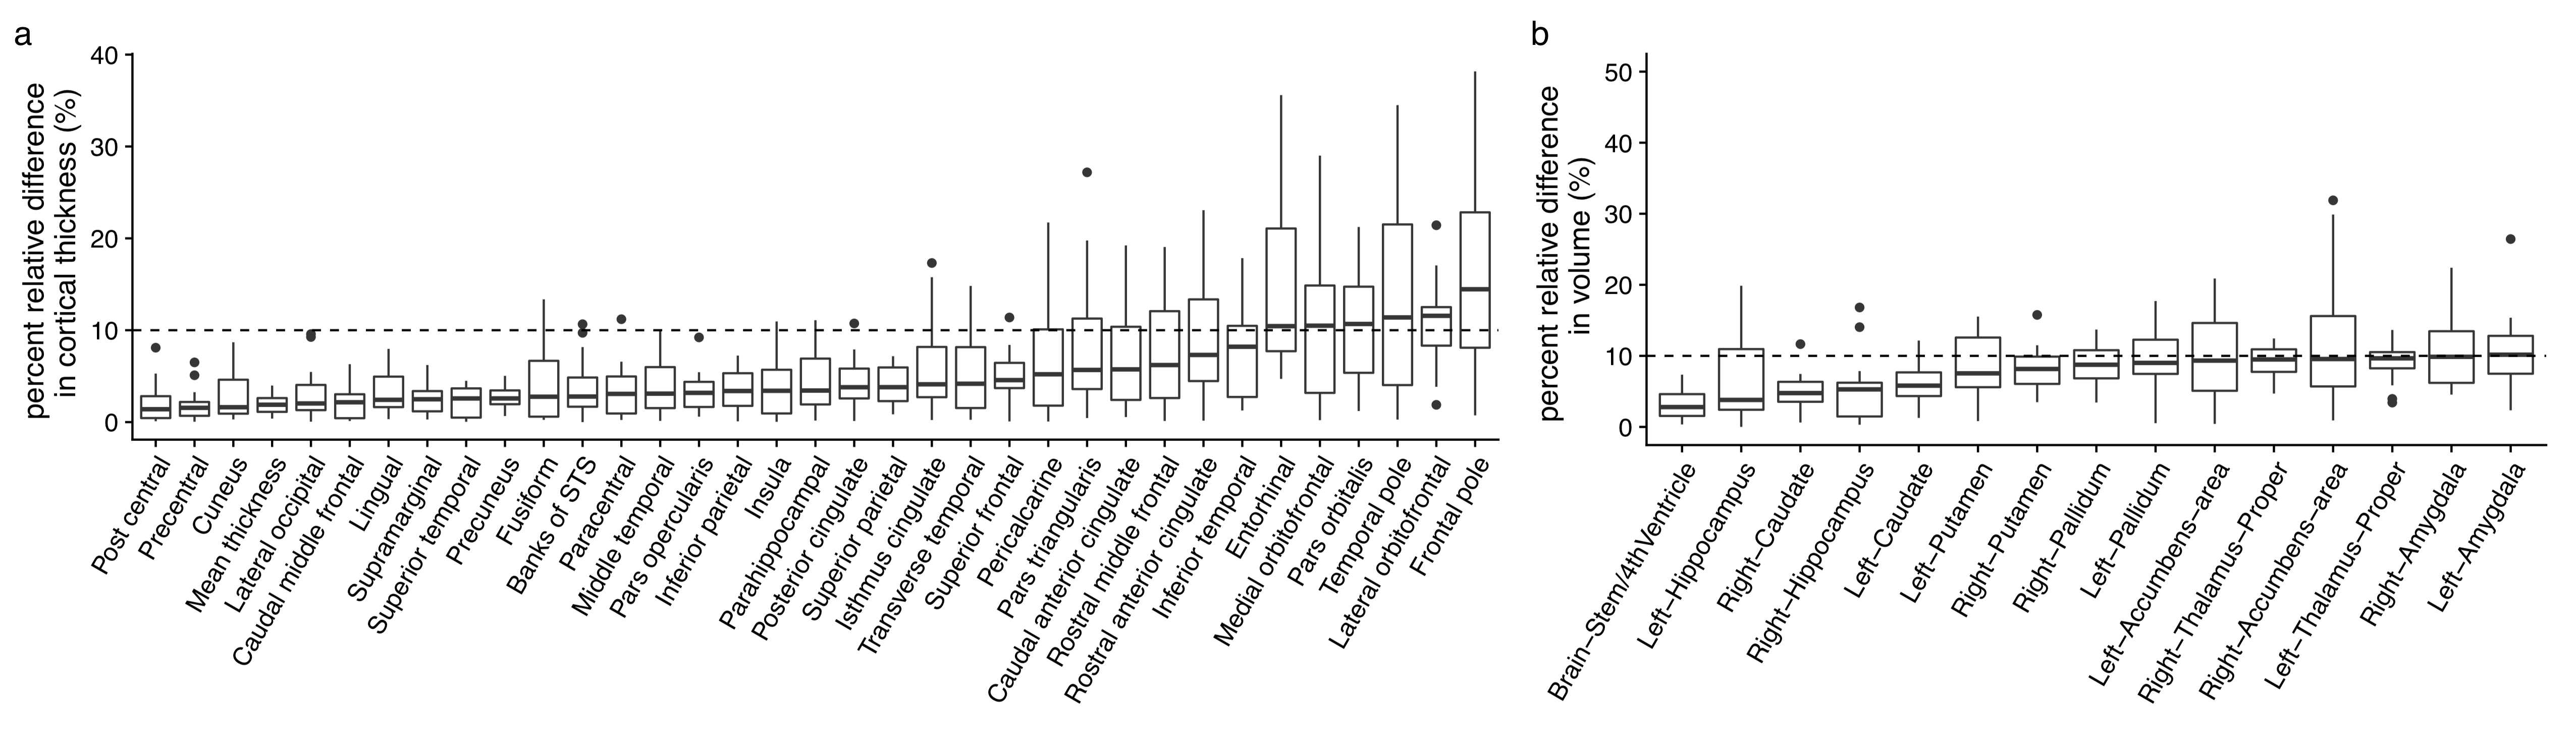
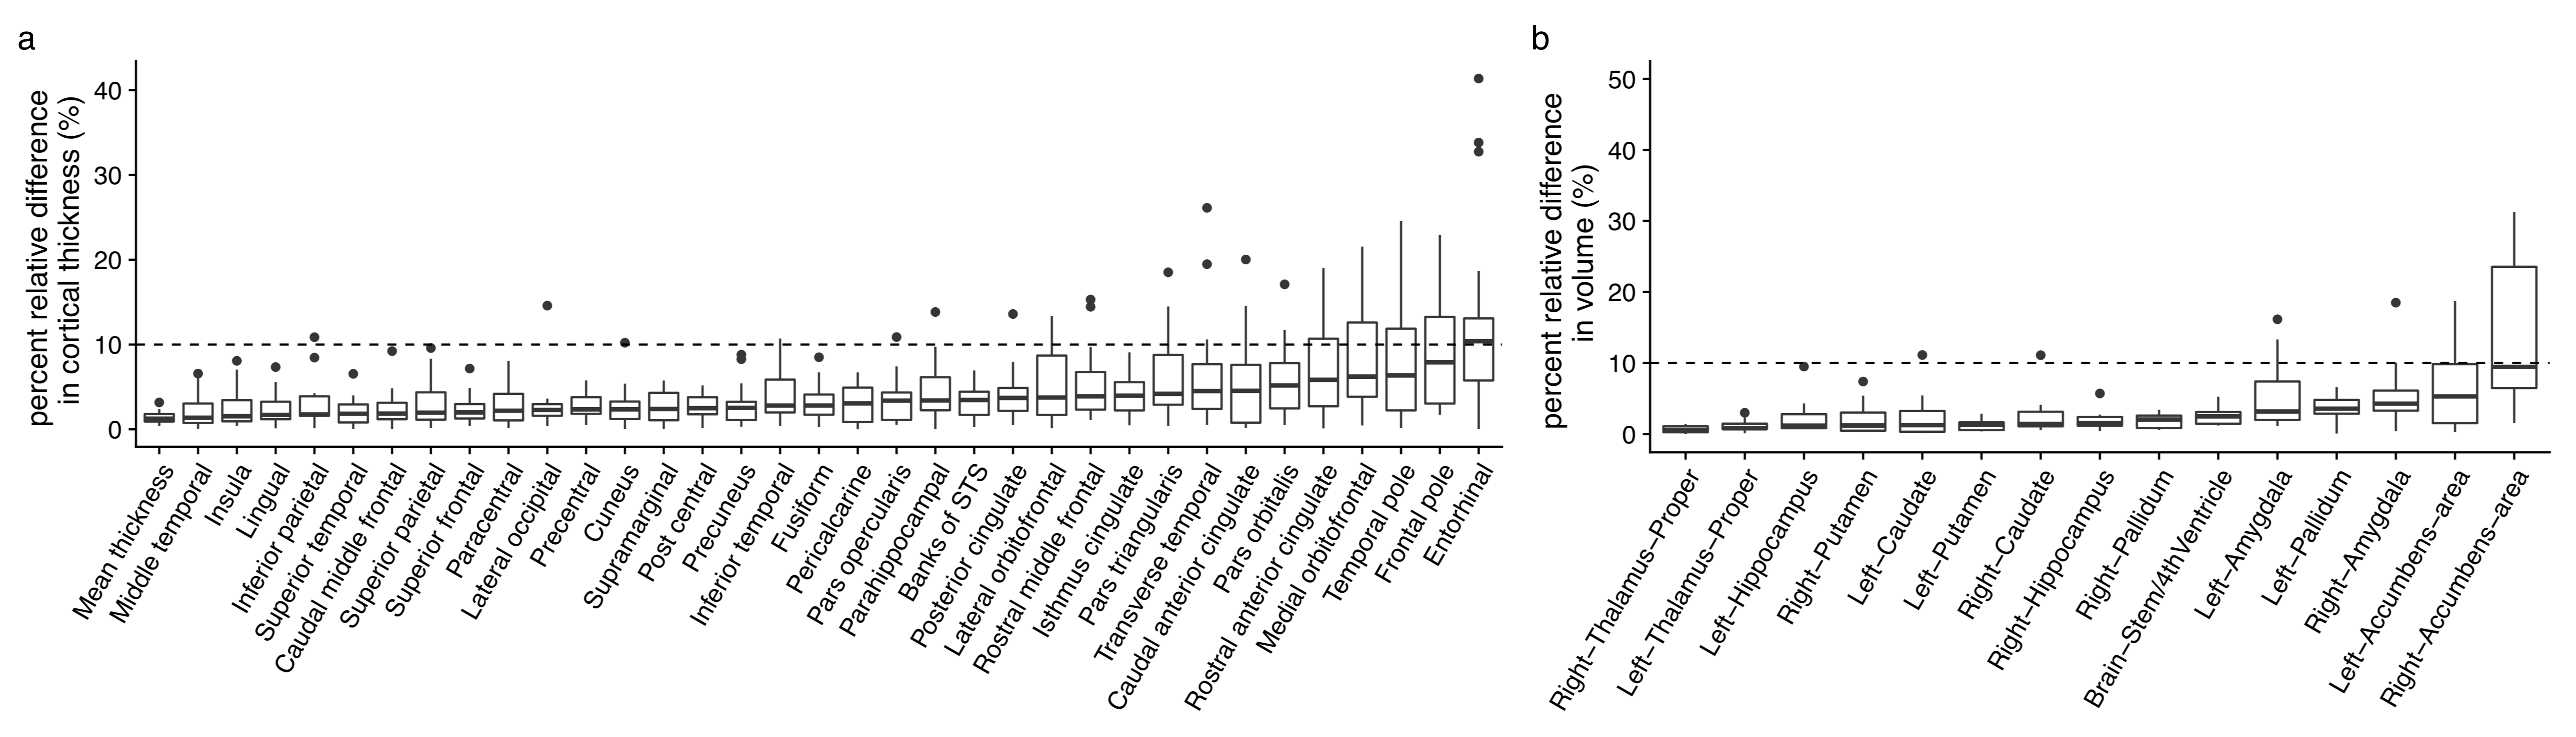
Figure 2 shows a histogram of 3D-QALAS sequence-derived cortical thickness estimated using FreeSurfer across all regions in the Desikan-Killiany Atlas in all subjects. Percent relative difference compared with MPRAGE in cortical thickness of the whole cortex was 1.8%, and 83% of the regional areas showed less than 10% relative difference (Fig. 3a). Cortical thickness of frontal pole, lateral orbitofrontal, temporal pole, pars orbitalis, the medial orbitofrontal and entorhinal cortex showed relatively low agreement. The mean ICC across all regions was 0.61, and 63% of the structures showed substantial(0.61–0.80)to almost perfect agreement (0.81–1.0). Percent relative differences were lower than 10% across all subcortical structures, except the amygdala (Fig. 3b), and all structures showed ICC of substantial to almost perfect agreement.
For the scan-rescan test, the relative difference in cortical thickness of the whole cortex was 1.3%, and all regions except the entorhinal cortex showed less than 10% relative difference (Fig. 4a). The mean ICC across all regions was 0.73, and 63% showed substantial to almost perfect agreement. For volumes of subcortical structures, relative differences were less than 10% across all subcortical structures (Fig. 4b), and all structures showed ICC of substantial or almost perfect agreement.
Discussion
3D synthetic T1-weighted images showed good agreement with the MPRAGE 1.0 mm isotropic images in measuring regional cortical thickness and subcortical volumes in most of the brain regions. High repeatability of the 3D synthetic MR imaging-derived brain measurements was demonstrated in the scan-rescan test.
Although high agreements were shown in the majority of the brain regions, low agreements were found in some areas. This observation is consistent with the previous study that reported relatively low reliability in cortical thickness of the entorhinal and orbital cortex in FreeSurfer using scan-rescan of a conventional 3D T1-weighted images.10Other previous studies using FreeSurfer have reported a negative relationship between cortical volume/surface area and relative error of measured cortical thickness,11,12 which can explain low agreement in the small structures in the current study.
One reason for the relatively low repeatability seen in 3D synthetic T1-weighted image compared with MPRAGE-derived cortical thickness may be partly attributed to differences in voxel size (1.20 mm iso-voxel in 3D-QALAS vs 1.00 mm iso-voxel in MPRAGE). Previous studies have shown that in general, higher resolution imaging results in higher repeatability.10 Segmentation of the accumbens and amygdala showed relatively low agreement both in scan-rescan and comparison with MPRAGE in this study, which is consistent with previous studies reporting that segmentation of these areas were generally unreliable compared with other subcortical regions.13,14
Conclusion
3D-QALAS could be reliably used for measuring cortical thickness and subcortical volumes in most brain regions.Acknowledgements
This work was supported by the program for Brain Mapping by Integrated Neurotechnologies for Disease Studies (Brain/MINDS) from Japan Agency for Medical Research and development, AMED; ImPACT Program of Council for Science, Technology and Innovation (Cabinet Office, Government of Japan); JSPS KAKENHI grant number 16K19852; JSPS KAKENHI Grant Number JP16H06280, Grant-in-Aid for Scientific Research on Innovative Areas- Resource and technical support platforms for promoting research ’Advanced Bioimaging Support’.References
1. Hagiwara A, Hori M, Cohen-Adad J, et al. Linearity, Bias, Intra-Scanner Repeatability, and Inter-Scanner Reproducibility of Quantitative Multi-Dynamic Multi-Echo Sequence for Rapid Simultaneous Relaxometry at 3T: A Validation Study with a Standardized Phantom and Healthy Controls. Invest Radiol 2018 [in press].
2. Warntjes JB, Leinhard OD, West J, Lundberg P. Rapid magnetic resonance quantification on the brain: Optimization for clinical usage. Magn Reson Med 2008;60(2):320-329.
3. Hagiwara A, Warntjes M, Hori M, et al. SyMRI of the Brain: Rapid Quantification of Relaxation Rates and Proton Density, With Synthetic MRI, Automatic Brain Segmentation, and Myelin Measurement. Invest Radiol 2017;52(10):647-657.
4. Kvernby S, Warntjes MJ, Haraldsson H, Carlhall CJ, Engvall J, Ebbers T. Simultaneous three-dimensional myocardial T1 and T2 mapping in one breath hold with 3D-QALAS. J Cardiovasc Magn Reson 2014;16:102.
5. Kvernby S, Warntjes M, Engvall J, Carlhall CJ, Ebbers T. Clinical feasibility of 3D-QALAS - Single breath-hold 3D myocardial T1- and T2-mapping. Magn Reson Imaging 2017;38:13-20.
6. Desikan RS, Segonne F, Fischl B, et al. An automated labeling system for subdividing the human cerebral cortex on MRI scans into gyral based regions of interest. Neuroimage 2006;31(3):968-980.
7. Dale AM, Fischl B, Sereno MI. Cortical surface-based analysis. I. Segmentation and surface reconstruction. Neuroimage 1999;9(2):179-194.
8. Fischl B. FreeSurfer. Neuroimage 2012;62(2):774-781.
9. Patenaude B, Smith SM, Kennedy DN, Jenkinson M. A Bayesian model of shape and appearance for subcortical brain segmentation. Neuroimage 2011;56(3):907-922.
10. Wonderlick JS, Ziegler DA, Hosseini-Varnamkhasti P, et al. Reliability of MRI-derived cortical and subcortical morphometric measures: effects of pulse sequence, voxel geometry, and parallel imaging. Neuroimage 2009;44(4):1324-1333.
11. Iscan Z, Jin TB, Kendrick A, et al. Test-retest reliability of freesurfer measurements within and between sites: Effects of visual approval process. Hum Brain Mapp 2015;36(9):3472-3485.
12. Tustison NJ, Cook PA, Klein A, et al. Large-scale evaluation of ANTs and FreeSurfer cortical thickness measurements. Neuroimage 2014;99:166-179.
13. Nugent AC, Luckenbaugh DA, Wood SE, Bogers W, Zarate CA, Jr., Drevets WC. Automated subcortical segmentation using FIRST: test-retest reliability, interscanner reliability, and comparison to manual segmentation. Hum Brain Mapp 2013;34(9):2313-2329.
14. Morey RA, Selgrade ES, Wagner HR, 2nd, Huettel SA, Wang L, McCarthy G. Scan-rescan reliability of subcortical brain volumes derived from automated segmentation. Hum Brain Mapp 2010;31(11):1751-1762.
Figures