3098
How does functional brain activity depend on the underlying structural connectome? A graph signal processing perspective1EPFL / University of Geneva, Geneva, Switzerland
Synopsis
How to integrate the information of structural connectivity and brain activity measured with magnetic resonance imaging (MRI) represents still an open question. Here, we addressed this problem by applying graph signal processing (GSP) to human brain data, aiming at exploring significant excursions of functional activity and its degree of alignment to the underlying structural connectivity. Two contrasting functional networks were highlighted: a primary sensory one, more aligned to the structure and characterized by less excursions, and a high-level cognitive one, more liberal and showing more fluctuations. This advanced framework opens new perspectives in the interpretation of the brain structure/function interplay.
Introduction
Diffusion-weighted magnetic resonance imaging (MRI) is sensitive to microstructural organization in brain white matter and allows virtual reconstruction of neural fibers structurally connecting different brain regions. In turn, brain activity can be measured by functional MRI (fMRI) through the blood-oxygenation-level-dependent (BOLD) signal. Several attempts to integrate these two pieces of information have been explored in literature, from correlational evidence 1,2 to simulation approaches, 3 but the complexity of the mechanisms regulating the brain structure/function relationship make it today still an open challenge. Graph signal processing (GSP) translates conventional signal processing operations to the graph domain 4 and offers a novel integrated framework to explore brain connectivity.5 In recent applications, this allowed to analyze functional activity in terms of its alignment to the structural connectome 6 and constrain it into known functional subgraphs.7,8 Here, we applied GSP to human brain data aiming at uncovering significant excursions of the functional signal and its degree of alignment to the underlying structural connectivity. Reproducibility across datasets was also assessed.Methods
The diffusion-weighted and resting-state functional MRI minimally preprocessed 9 scans of 42 healthy individuals from the Human Connectome Project were considered. These were split into two groups (of 21 subjects each) analyzed separately to test for reproducibility. A structural connectome was obtained for every individual by probabilistic tractography and the use of Glasser’s parcellation 10 (360 regions). Connectivity measures were the number of reconstructed tracks connecting two regions, normalized by the region volumes. All subjects’ connectomes were then averaged together. The same parcellation was used to compute regional average fMRI timecourses.
In the GSP framework, a signal - here brain activity patterns- is defined on top of a graph – for us the structural connectome - so that its properties can be investigated in terms of graph spectral analysis. First, the symmetrically normalized graph Laplacian was computed from the average structural connectome and the graph Fourier transform was defined by projection of the signal into Laplacian eigenvectors. Each eigenvector is characterized by a specific spatial frequency, represented by its corresponding eigenvalue. To assess significant excursions of brain activity, spectral randomization was applied to generate surrogate graph signals, 11 compared against the empirical ones. Then, to investigate the alignment of functional signals to brain structure, graph signal filtering was implemented to decompose fMRI signals into two portions, one more aligned with the underlying structural graph (corresponding to low-frequency Laplacian eigenmodes), the other more liberal (related to high frequencies).6 Instead of arbitrarily choosing the filter cutoff, we used the median-split criterion to have equal energy spectral density in the two portions. Region-wise alignment/liberality was assessed by computing the norms of the aligned/liberal signal portions across time (then average across subjects).
Results
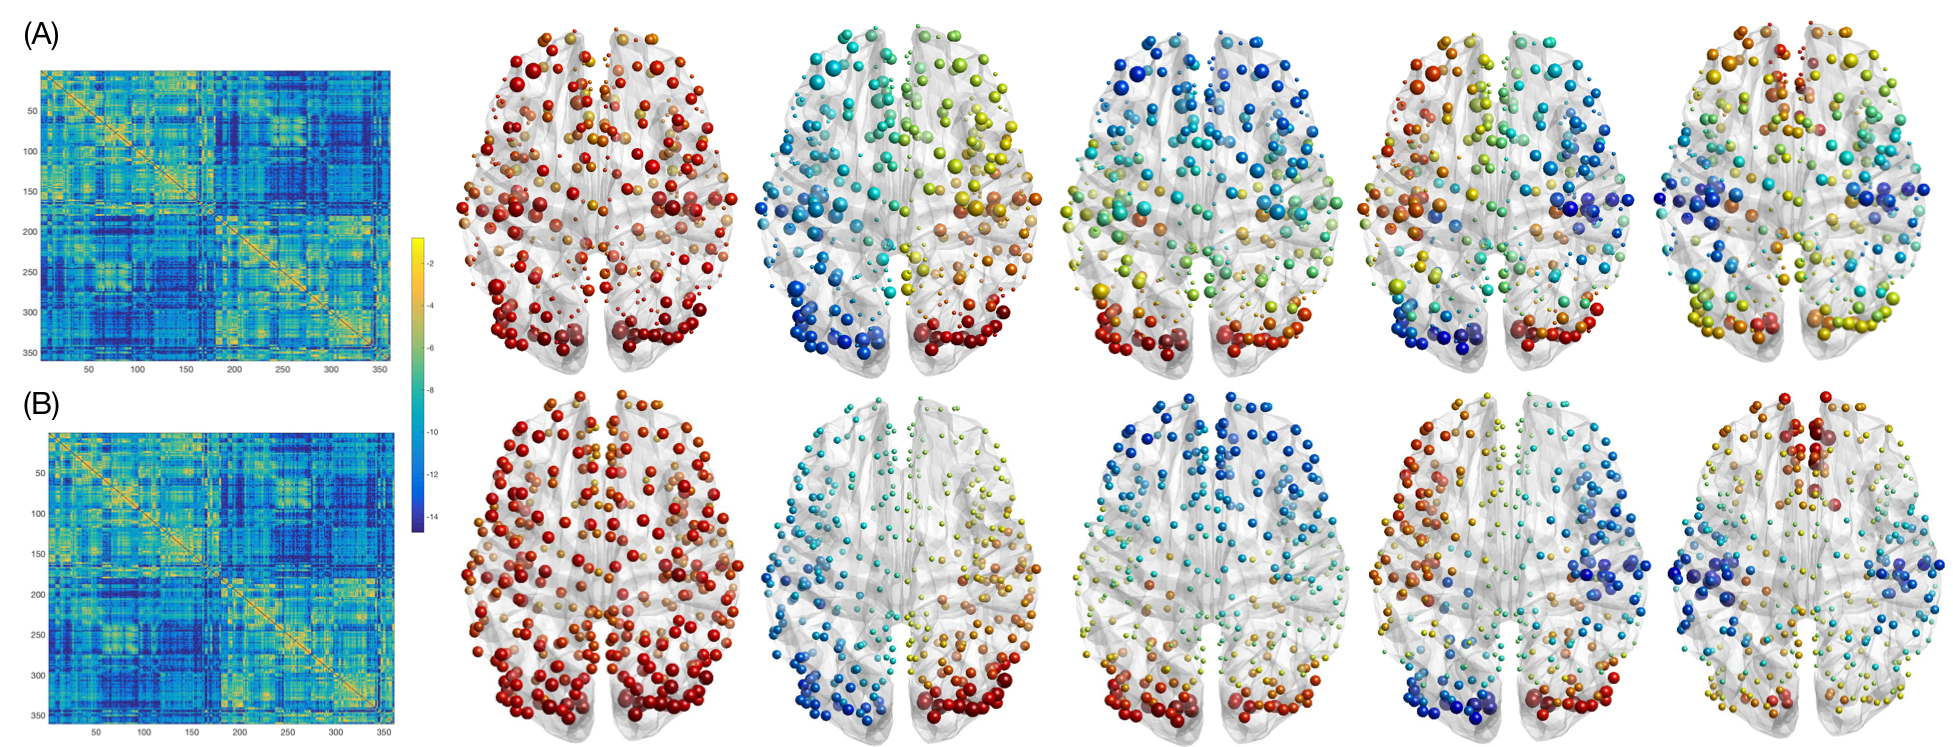
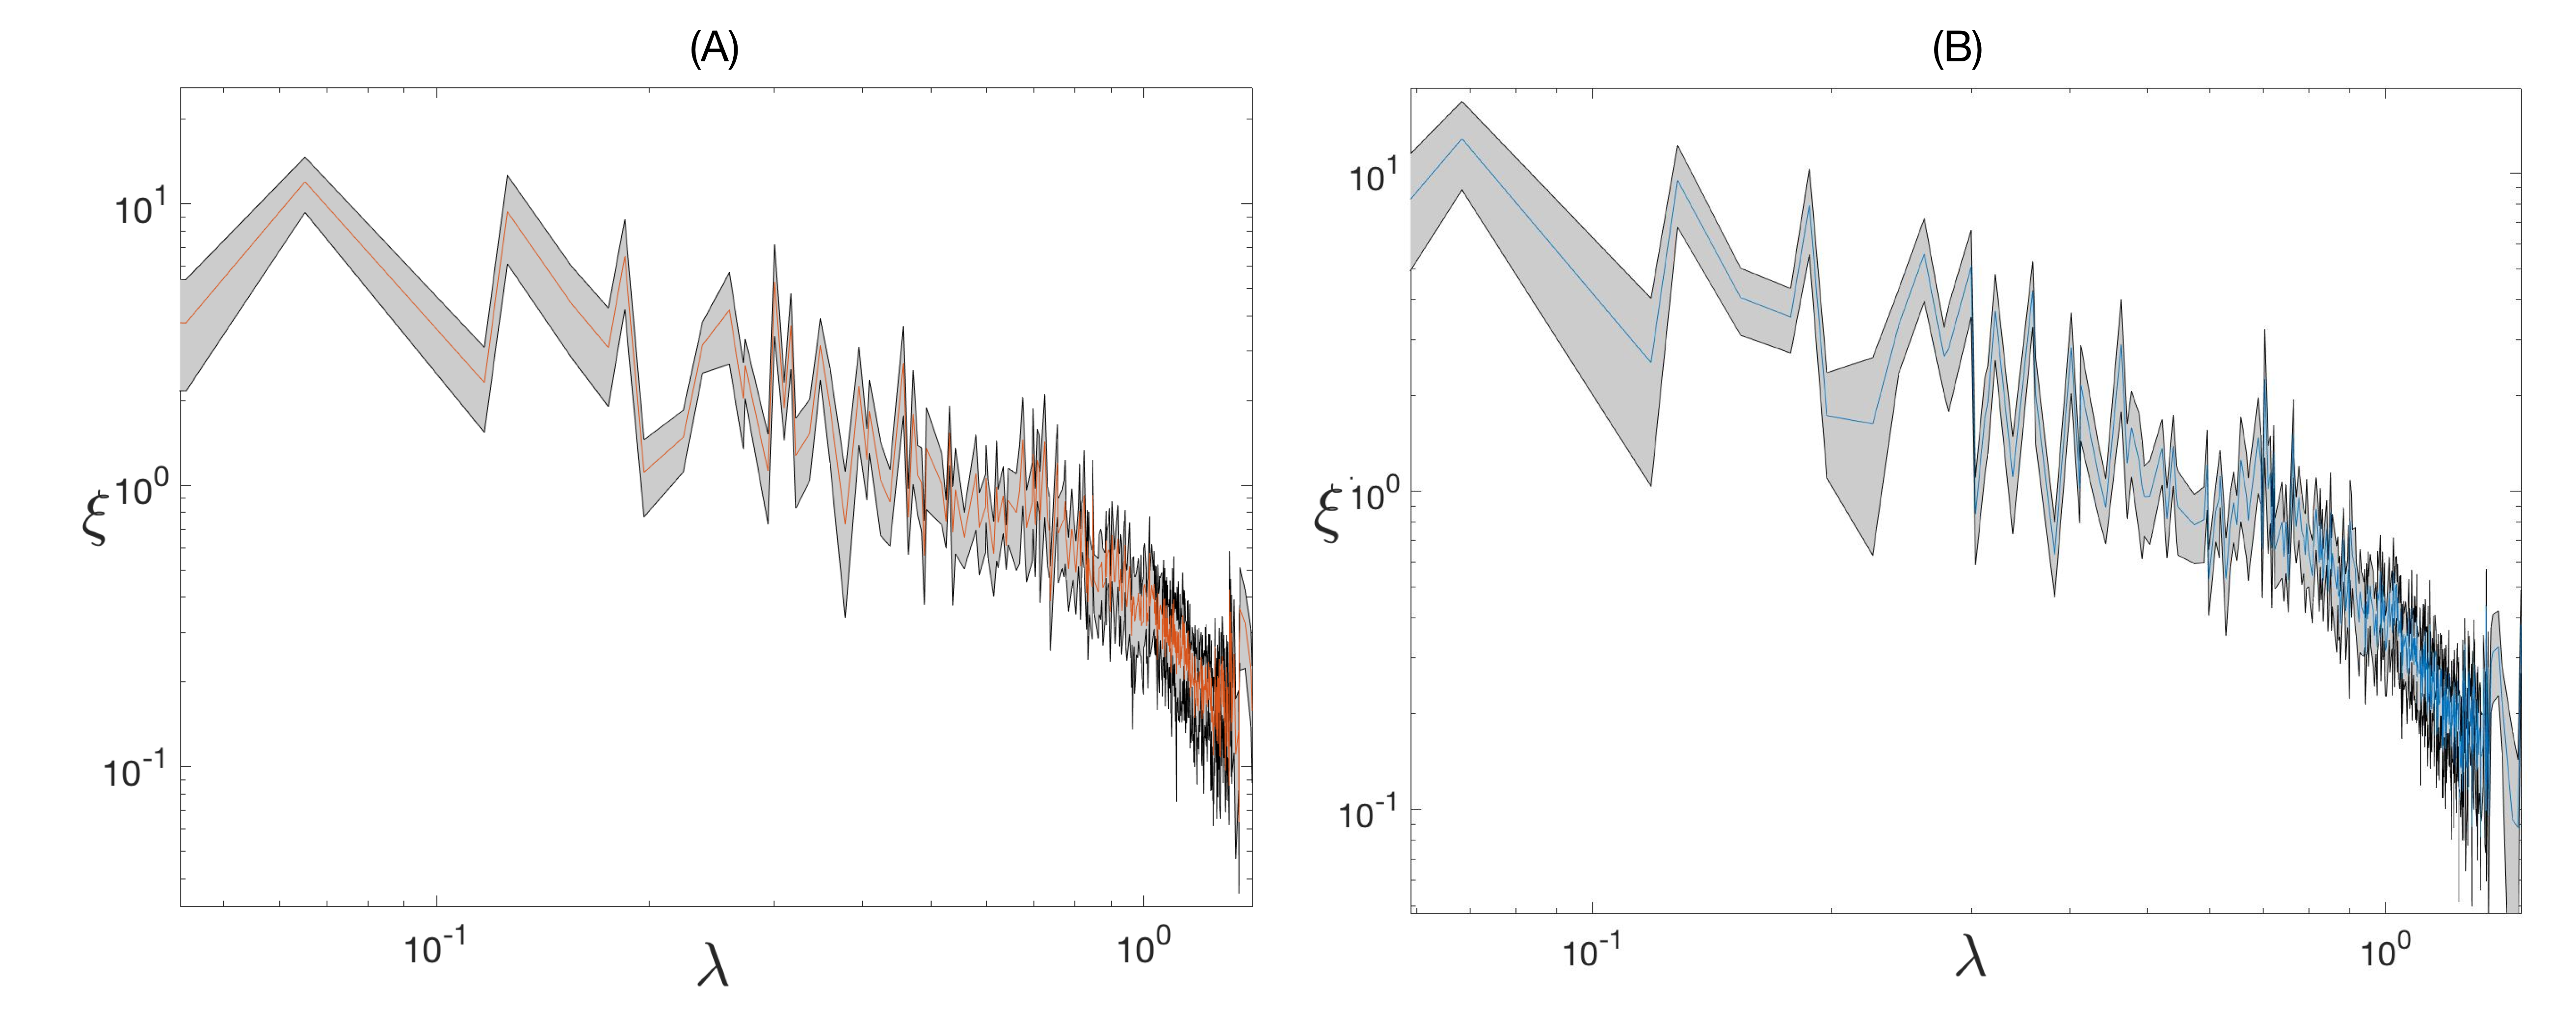
The structural connectomes from the two analyzed datasets showed high similarity (spatial correlation=0.99), as well as the derived structural backbones represented by the main low-frequency eigenmodes (Fig. 1). The filter cutoff defined on the graph energy spectral density (Fig. 2) resulted at 19 eigenmodes (λ=0.32) for one dataset and 22 (λ=0.36) for the other one.
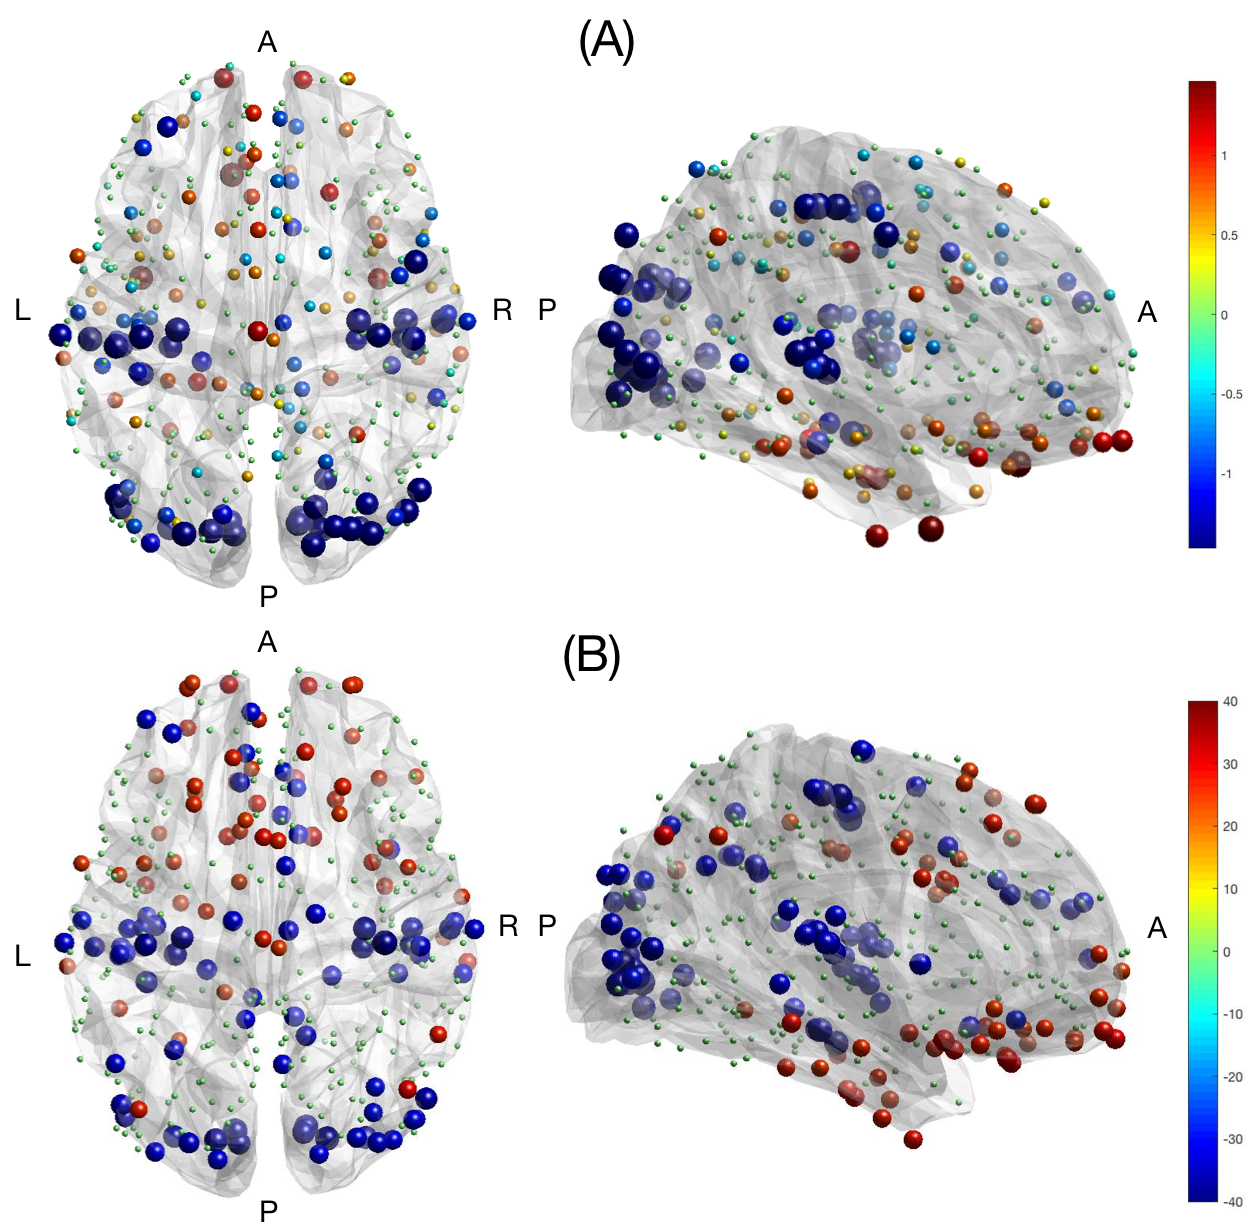
Two contrasting networks were highlighted when analyzing significant excursions of brain activity: a sensory one (auditory, visual, somatomotor regions), showing less fluctuations than expected, and a high-level cognitive one (orbitofrontal, temporal, parietal regions), characterized by more fluctuations (Fig. 3A). Interestingly, a very similar network subdivision resulted from the aligned vs. liberal analysis, with the primary sensory network being more aligned and the high-level cognitive network more liberal with respect to brain structure (Fig. 3B). These results were reproducible across datasets (spatial correlation between brain patterns > 0.91).
Discussion
The low-frequency eigenmodes provide a structural backbone of the connectivity and nicely capture patterns of slow variations in the graph. Our findings suggest, on one hand, that the activity related to sensory and motor stimuli follows the underlying structural connections and is, as we might expect, characterized by less excursions. This could be explained by the need of these regions for fast and reliable responses to external (and internal) stimuli. On the other hand, high-level cognitive regions exhibit more excursions and appear to be more detached from brain structure, in line with the fact that they cover less predictable functions and generally need less time-sensitive reactions. This is also supported by genetic studies, showing that low- versus high-level regions express different types of genes, either favoring temporal precision of the response, or slower, sustained activation. 12Conclusion
GSP is a promising new and advanced framework to explore the relationship between functional brain activity and the underlying brain structure. GSP operations open new perspectives in the interpretation of this complex interplay.Acknowledgements
No acknowledgement found.References
1. Honey CJ, Sporns O, Cammoun L, et al. Predicting human resting-state functional connectivity from structural connectivity. PNAS. 2009;106(6):2035-2040.
2. Hagmann P. Cammoun L. Gigandet X. et al. Mapping the structural core of human cerebral cortex. PLoS Biology. 2008;6(7):1479–1493.
3. Ritter P, Schirner M, McIntosh AR, Jirsa VK. The virtual brain integrates computational modeling and multimodal neuroimaging. Brain Connect. 2013,3(2):121-145.
4. Shuman DI, Narang SK, Frossard P et al. The emerging field of signal processing on graphs: Extending high-dimensional data analysis to networks and other irregular domains. IEEE Signal Processing Magazine. 2013;30(3):83–98.
5. Huang W, Bolton TAW, Medaglia JD, et al. A Graph Signal Processing View on Functional Brain Imaging. Proceedings of the IEEE. 2017;106(5):868-8985.
6. Medaglia JD, HuangW, Karuza EA, et al. Functional alignment with anatomical networks is associated with cognitive flexibility. Nature Human Behaviour. 2018;2(2):156–164.
7. Preti MG and Van De Ville D. Graph slepians to probe into large-scale network organization of resting-state functional connectivity. 2017 51st Asilomar Conference on Signals, Systems and Computers. 2017:1539–1543.
8. Bolton TAW, Farouj Y, Obertino S, Van De Ville D. Graph slepians to strike a balance between local and global network interactions: Application to functional brain imaging. 2018 IEEE 15th International Symposium on Biomedical Imaging (ISBI 2018). 2018:1239–1243
9. Glasser MF, Sotiropoulos SN, Wilson JA et al. The minimal processing pipelines for the human connectome project. NeuroImage. 2013;80:105-124.
10. Glasser MF, Coalson TS, Robinson EC, et al. A multi-modal parcellation of human cerebral cortex. Nature. 2016;536(7615):171–178.
11. Pirondini E, Vybornova A, Coscia M, Van De Ville D. A Spectral Method for Generating Surrogate Graph Signals. IEEE Signal Processing Letters. 2016;23(9):1275–1278.
12. Cioli C, Abdi H, Beaton D, et al. Differences in human cortical gene expression match the temporal properties of large-scale functional networks. PLoS ONE. 2014;9(12): e115913.
Figures