3095
Investigating gas-exchange and tissue perfusion in the human brain using a combination of proton and hyperpolarized xenon-129 MRI1University Of Sheffield, Sheffield, United Kingdom
Synopsis
This study establishes a correlation between cerebral
perfusion and gas uptake using 1H arterial spin labeling and T2
weighted imaging for cerebral blood perfusion, and inhaled hyperpolarized 129Xe
brain MR imaging for cerebral uptake of a free-diffusible noble gas. Using arterial
transit time and cerebral blood volume maps, along with xenon images, correlation
coefficients between 0.34 and 0.63 was observed for healthy subjects between
the ages 26 and 36 years. The distinct properties of water and noble gas opens
up the opportunity to use them in conjunction to understand aspects of brain
physiology.
Introduction
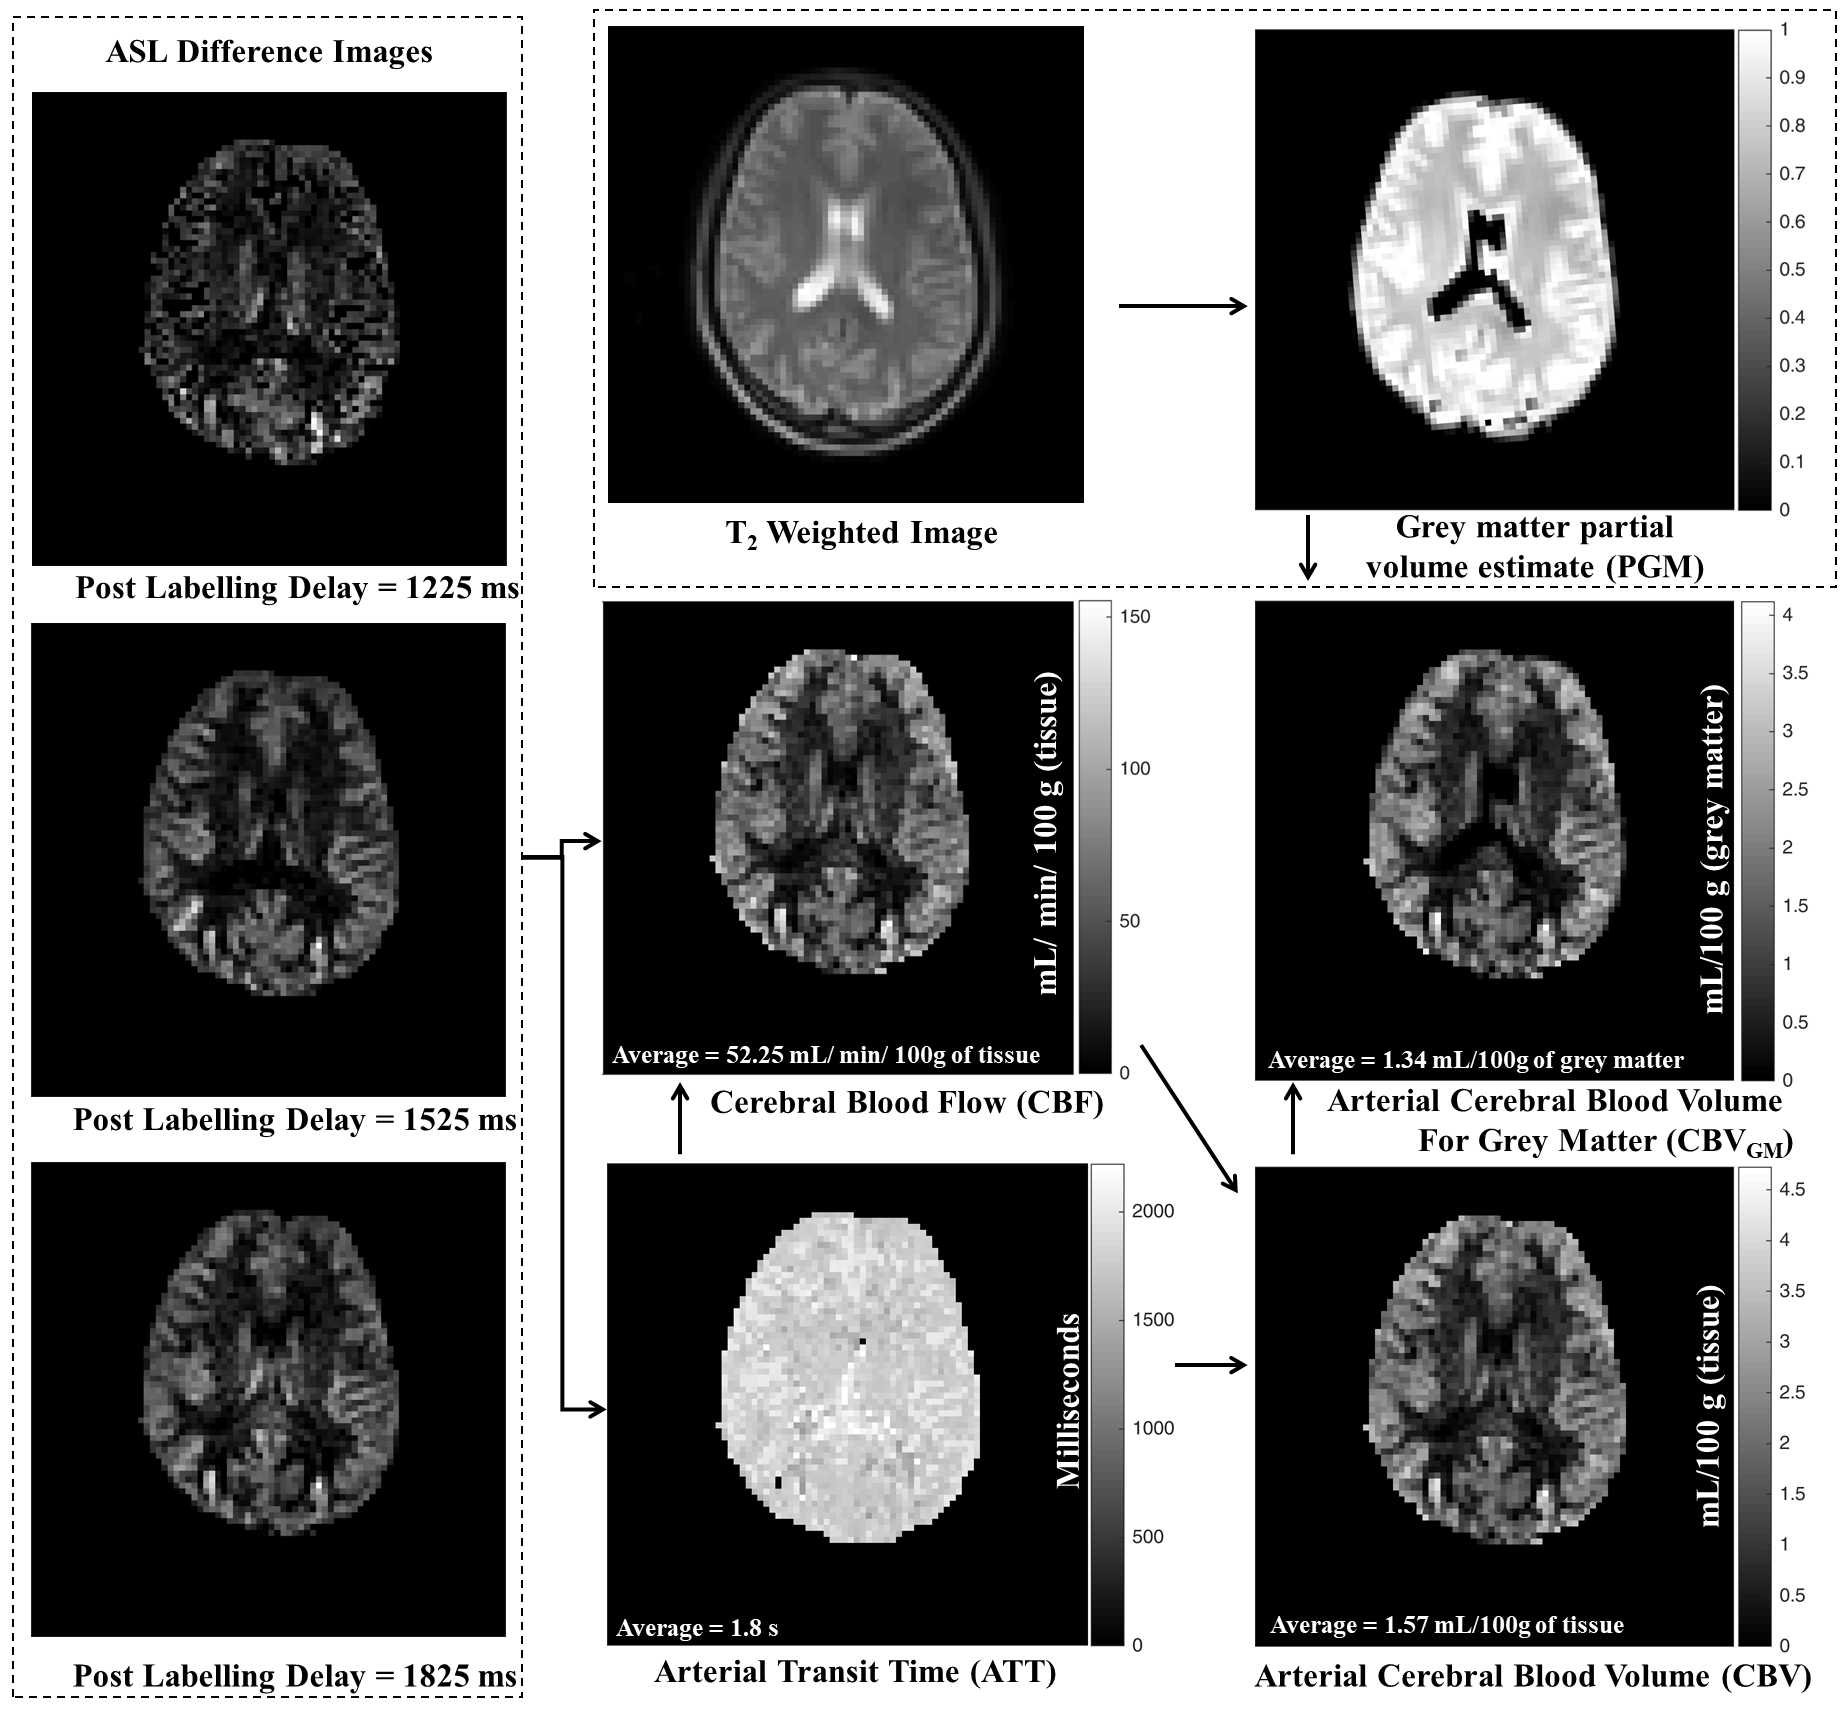
Human brain perfusion can be quantified in terms of arterial transit time (ATT), cerebral blood flow (CBF) and arterial cerebral blood volume (CBV) using a set of 1H arterial spin labelling (ASL) difference images acquired at various post labelling delay (PLD) times, representing the underlying dynamics of water molecules within the blood vessels1-6. Recent studies have demonstrated hyperpolarized (HP) 129Xe MRI in the human brain using inhaled gas7,8. Due to its passive nature8, xenon gas uptake in cerebral tissue is by diffusive gas-exchange from the capillaries to brain tissue; in addition, the MR signal is sensitive to residency time and oxygenation of arterial blood9-11. Using images obtained with 1H ASL and T2 weighted (T2W) MRI, this work establishes correlations between cerebral perfusion and gas-exchange/uptake observed with hyperpolarized 129Xe brain MRI in the human brain.Methods
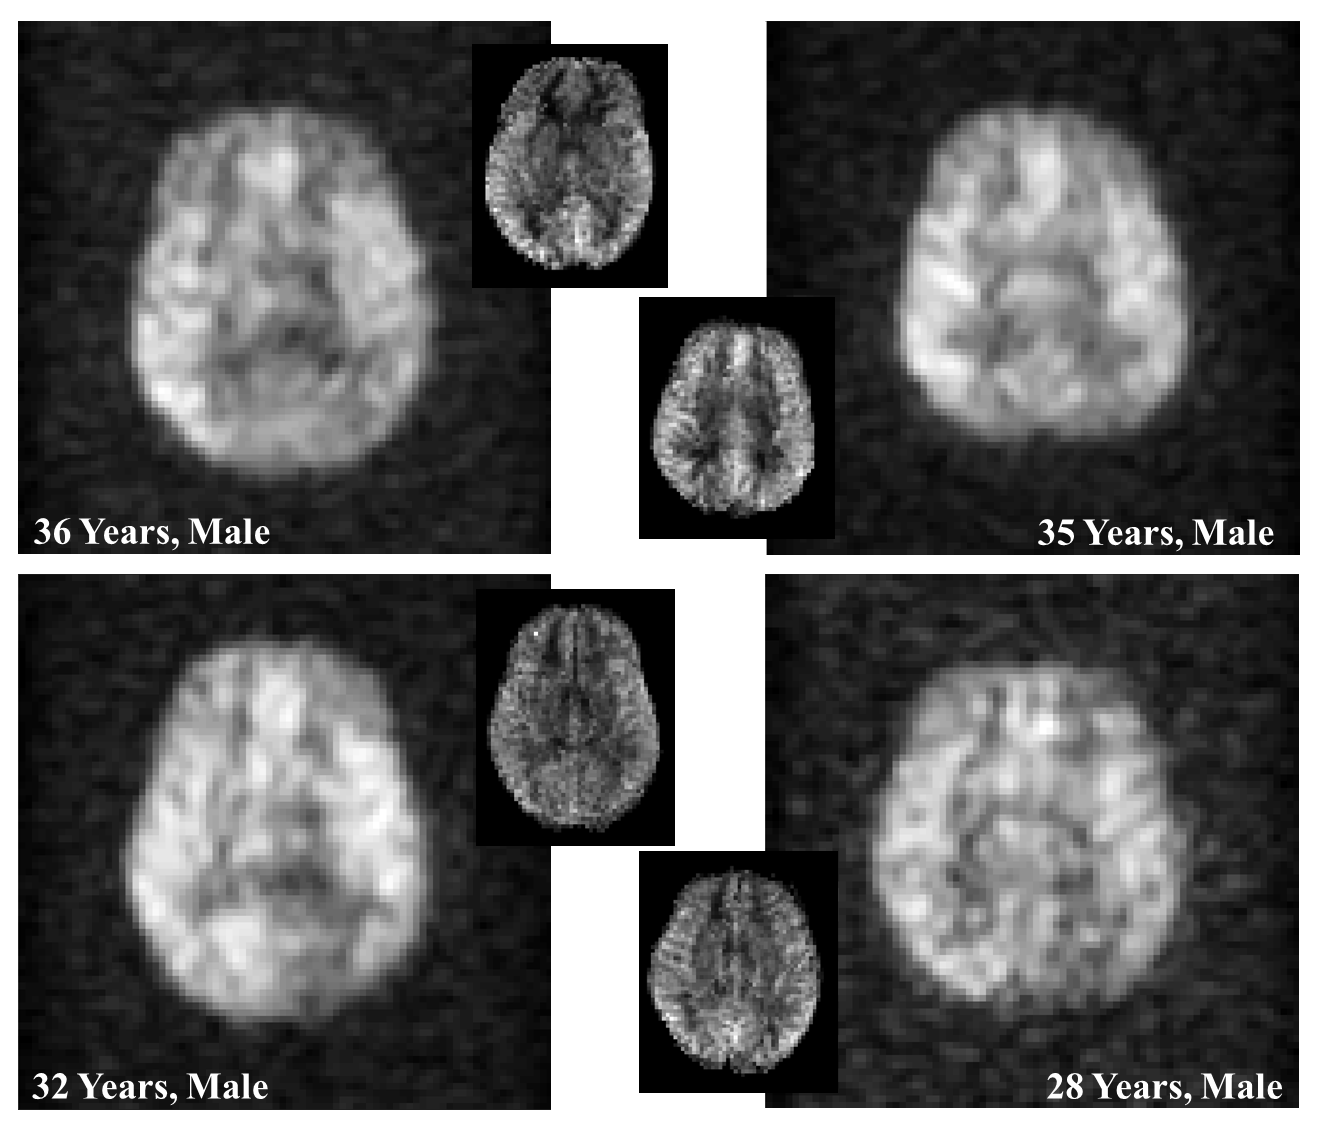
Five healthy male volunteers (age 26, 28, 32, 35 and 36 years) were imaged on a 3.0 T Philips Ingenia scanner for 1H ASL and T2W MRI and then on a 1.5 T GE HDx scanner for HP 129Xe brain MRI, after obtaining informed written consent. 1 L of xenon gas dose was polarized to 30% polarization using a high-yield spin exchange optical pumping polarizer12.
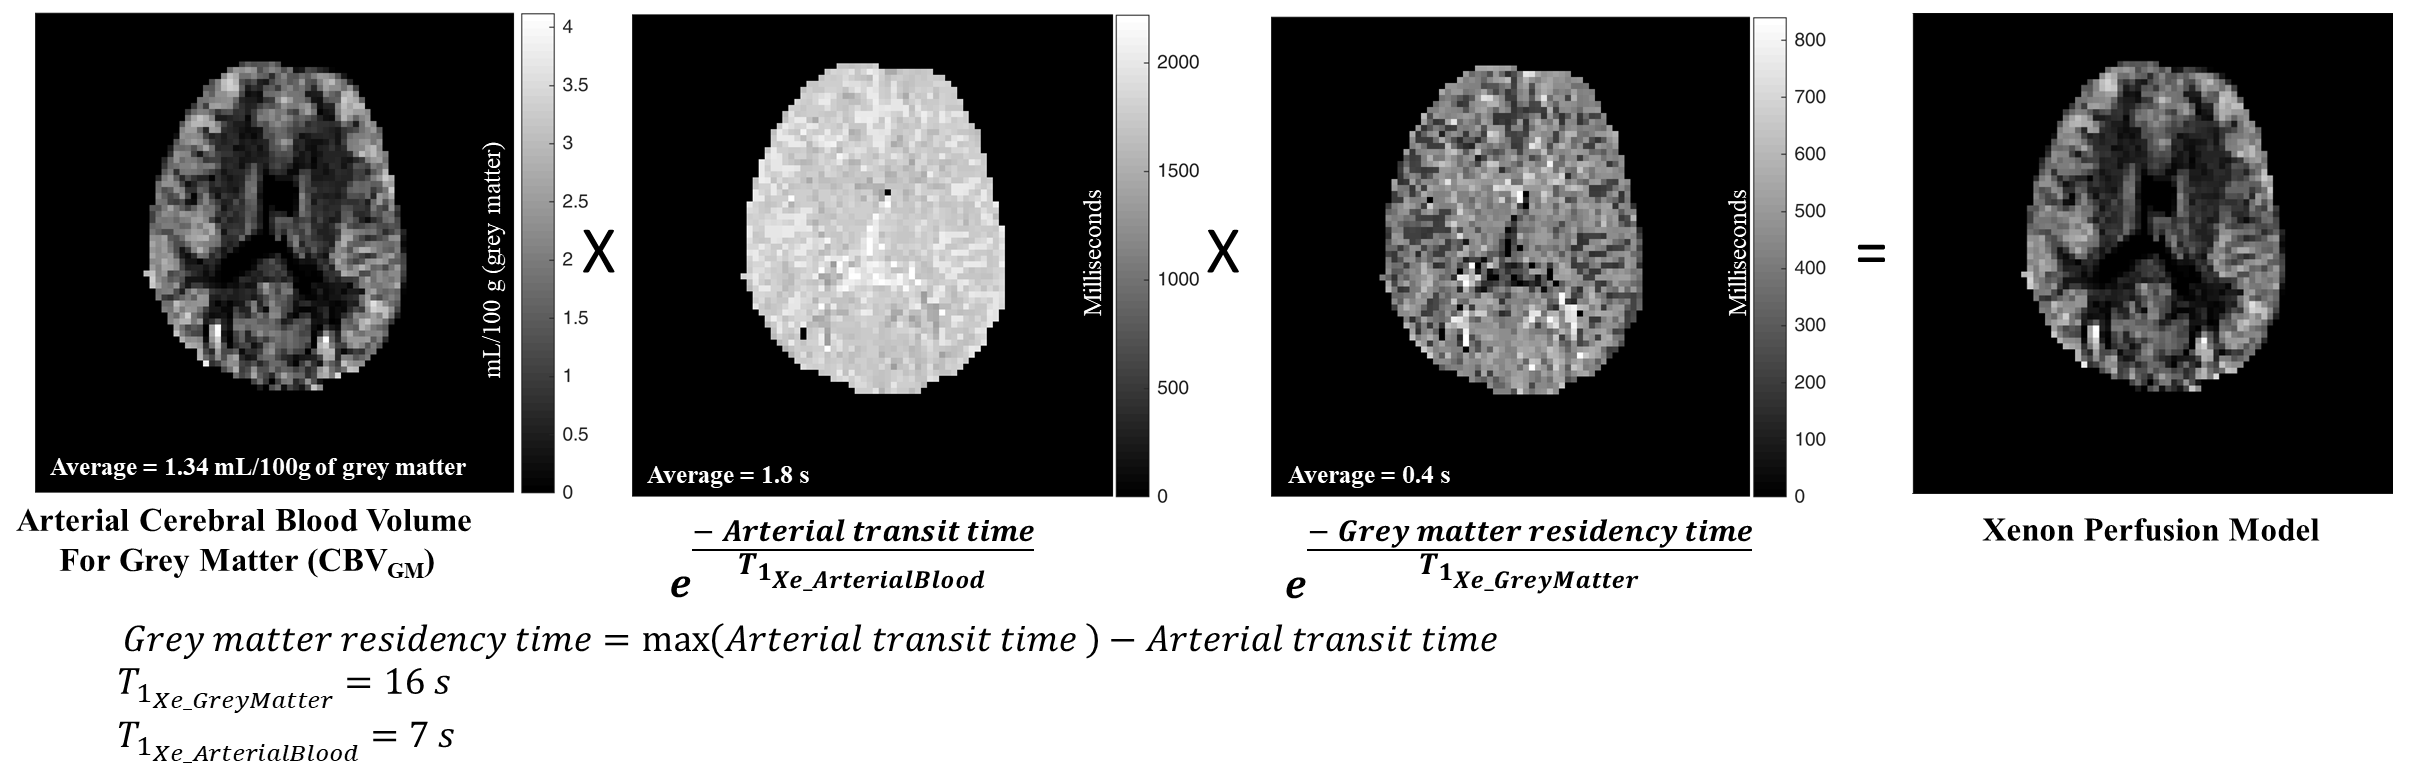
HP 129Xe brain images were acquired with the imaging parameters as described in8, with field of view 24 cm and slice thickness 50 mm. Three sets of pulsed continuous ASL difference images were acquired with PLD times of 1225, 1525 and 1825 ms. Other imaging parameters were identical; Gradient echo EPI, field of view 24 cm, slice thickness 7 mm, flip angle 40°, TE=14 ms, TR=4.25 s and labeling duration 1650 ms. ATT (ms), CBF (mL per minute per 100 g of tissue) and CBV (mL per 100 g of tissue) maps were generated as descried in literature1-6. T2W images were acquired with spin echo, TE=80 ms, TR=3 s, flip angle 90° and with same voxel grid as the ASL. Partial volume of gray matter (PGM) was estimated using T2W images13,14. Arterial cerebral blood volume for gray matter (CBVGM, mL per 100 g of gray matter) was estimated using CBV and PGM. In order to spatially correlate 1H MRI based model of cerebral xenon perfusion (xenon perfusion model) with the acquired HP 129Xe brain MRI, CBVGM map was weighted for regional depolarization that HP 129Xe would experience during its transit in the blood using ATT map and T1 relaxation of HP 129Xe in arterial blood (7 s9,11) and gray matter (GM) (16 s15). 7 continuous slices of the same anatomical location as 129Xe MRI were summed for effective thickness of 49 mm. The intensity of pixels in the xenon perfusion model was spatially correlated with that of 129Xe MRI.
Results
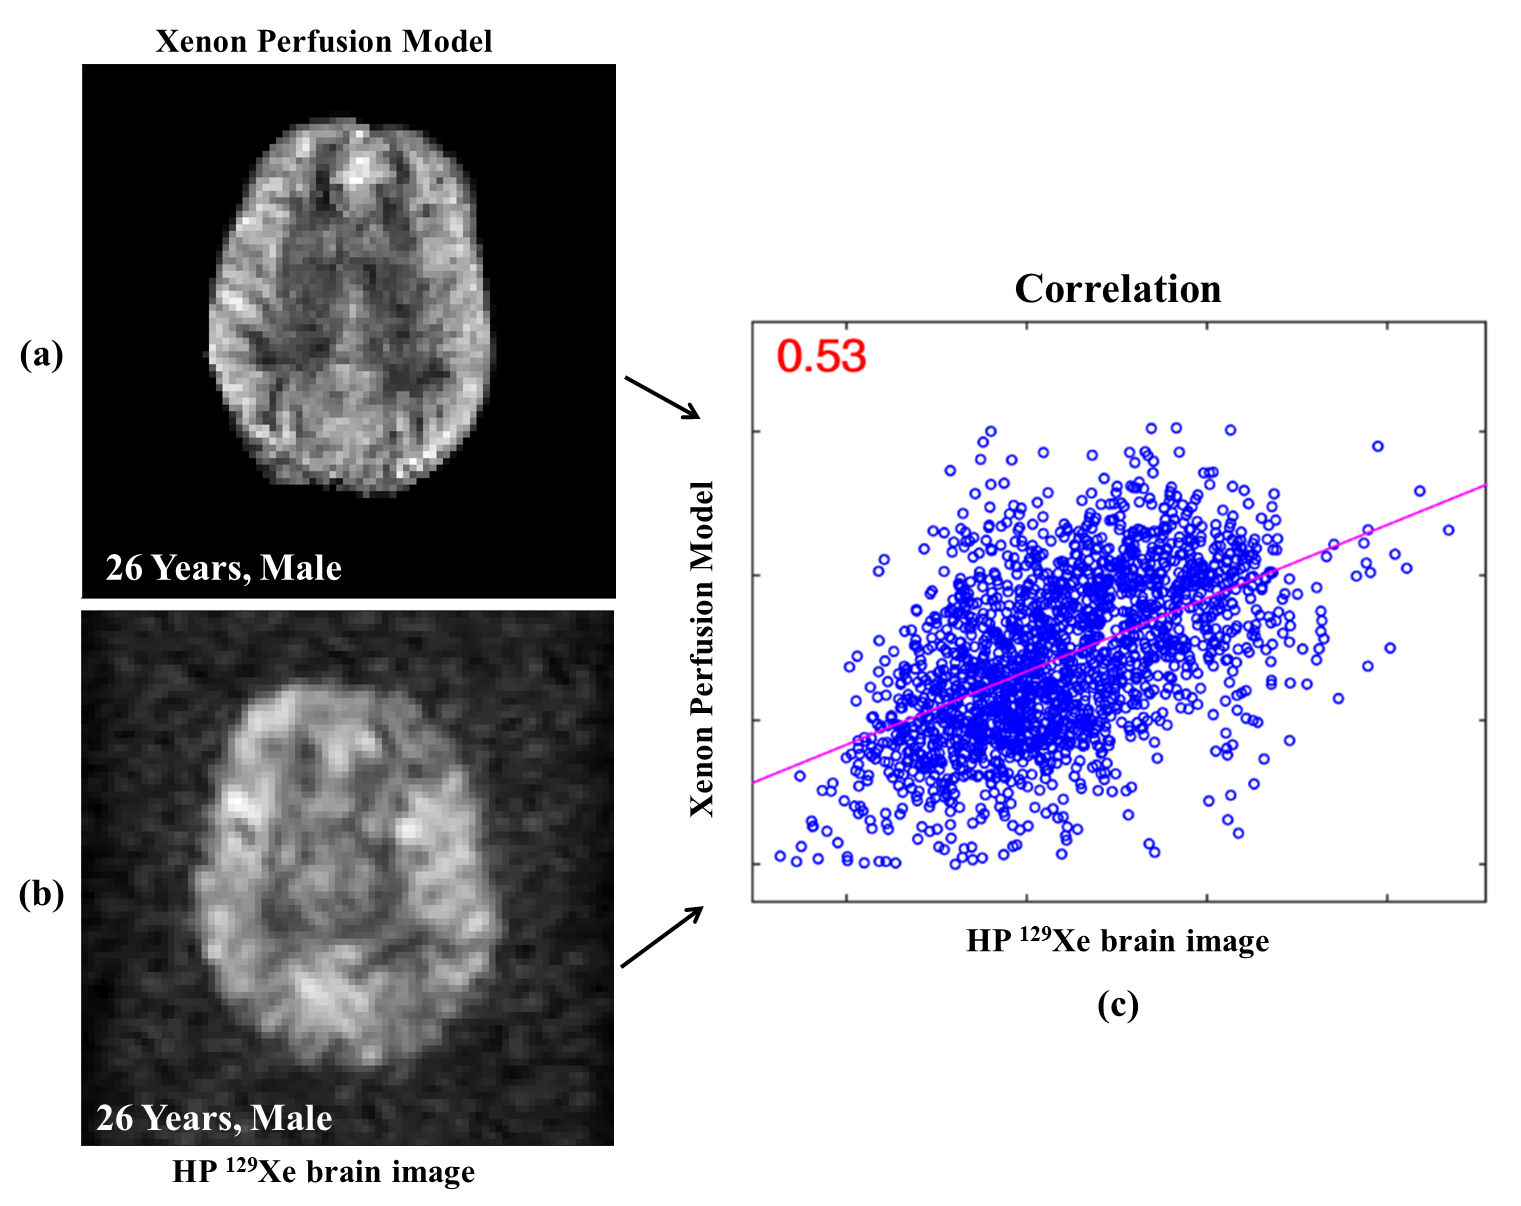
Images obtained from 1H ASL and T2W MRI, and the derived maps of ATT, CBF, CBV, PGM and CBVGM for 26 year old volunteer for a representative slice is shown in Figure 1. A schematic of the steps involved in deriving a xenon perfusion model is shown in Figure 2. The 129Xe brain MRI from all volunteers are shown in Figure 3 and 4. Correlation between 129Xe MRI and the xenon perfusion model for the 26 year old volunteer is shown in Figure 4, and indicates a voxel-wise correlation coefficient of 0.53. The correlation coefficients for volunteers 36, 35, 32 and 28 years old were 0.44, 0.63, 0.43 and 0.34 respectively.Discussion
The correlation obtained is moderate with the correlation coefficient between 0.34 and 0.63, and can be attributed to:
- Xenon perfusion model based on 1H images is a manifestation of blood perfusion and uptake of water in the GM, whereas a 129Xe brain MR image is a manifestation of delivery and uptake of a free-diffusible noble gas which passively crosses the blood-brain barrier.
- Xenon perfusion model inherits uncertainty from ASL1-6, image segmentation13,14, image registration, signal-to-noise ratio and assumptions such as blood-brain water partition coefficient (0.9)16, T1 relaxation of 1H in blood at 3.0 T (1650 ms)17, T1 relaxation of 1H in GM at 3.0 T (1550 ms)18, T1 relaxation of 129Xe in arterial blood9,11, T1 relaxation of 129Xe in GM15, labelling efficiency (0.85)19 and weighted delay4.
- Although 129Xe image is heavily weighted towards well-perfused GM8, there is appreciable uptake in the white matter as well7, which is neglected in the xenon perfusion model.
Conclusion
This work establishes spatial correlations between ASL maps of water-uptake and maps of 129Xe gas-uptake in the human brain, and opens up the opportunity to use them together to understand aspects of brain physiology such as blood-brain barrier gas-exchange.Acknowledgements
This work was funded by the Engineering and Physical Sciences Research Council (EPSRC - EP/D070252/1), National Institute for Health Research (NIHR - RP-R3-12-027) and Medical Research Council (MRC - MR/M008894/1).References
- Alsop DC, Detre JA. Reduced transit-time sensitivity in noninvasive magnetic resonance imaging of human cerebral blood flow. Journal of cerebral blood flow and metabolism : official journal of the International Society of Cerebral Blood Flow and Metabolism 1996;16(6):1236-1249.
- Buxton RB, Frank LR, Wong EC, Siewert B, Warach S, Edelman RR. A general kinetic model for quantitative perfusion imaging with arterial spin labeling. Magn Reson Med 1998;40(3):383-396.
- Wang J, Alsop DC, Li L, Listerud J, Gonzalez-At JB, Schnall MD, Detre JA. Comparison of quantitative perfusion imaging using arterial spin labeling at 1.5 and 4.0 Tesla. Magn Reson Med 2002;48(2):242-254.
- Dai W, Robson PM, Shankaranarayanan A, Alsop DC. Reduced resolution transit delay prescan for quantitative continuous arterial spin labeling perfusion imaging. Magnetic resonance in medicine 2012;67(5):1252-1265.
- Wang DJJ, Alger JR, Qiao JX, Gunther M, Pope WB, Saver JL, Salamon N, Liebeskind DS, Investigators US. Multi-delay multi-parametric arterial spin-labeled perfusion MRI in acute ischemic stroke - Comparison with dynamic susceptibility contrast enhanced perfusion imaging. NeuroImage Clinical 2013;3:1-7.
- Alsop DC, Detre JA, Golay X, Günther M, Hendrikse J, Hernandez-Garcia L, Lu H, MacIntosh BJ, Parkes LM, Smits M, van Osch MJP, Wang DJJ, Wong EC, Zaharchuk G. Recommended implementation of arterial spin-labeled perfusion MRI for clinical applications: A consensus of the ISMRM perfusion study group and the European consortium for ASL in dementia. Magnetic Resonance in Medicine 2015;73(1):102-116.
- Rao M, Stewart NJ, Norquay G, Griffiths PD, Wild JM. High resolution spectroscopy and chemical shift imaging of hyperpolarized 129Xe dissolved in the human brain in vivo at 1.5 tesla. Magn Reson Med 2016;75(6):2227-2234.
- Rao MR, Stewart NJ, Griffiths PD, Norquay G, Wild JM. Imaging Human Brain Perfusion with Inhaled Hyperpolarized 129Xe MR Imaging. Radiology 2018;286(2):659-665.
- Norquay G, Leung G, Stewart NJ, Tozer GM, Wolber J, Wild JM. Relaxation and exchange dynamics of hyperpolarized 129Xe in human blood. Magn Reson Med 2015;74(2):303-311.
- Rao M, Norquay G, Stewart NJ, Hoggard N, Griffiths PD, Wild JM. Assessment of cerebral infarction due to intracranial arterial stenosis in the human brain using hyperpolarized xenon-129 MRI. Proc Intl Soc Mag Reson Med 26 P 3163 2018.
- Albert MS, Balamore D, Kacher DF, Venkatesh AK, Jolesz FA. Hyperpolarized 129Xe T1 in oxygenated and deoxygenated blood. NMR in Biomedicine 2000;13(7):407-414.
- Norquay G, Collier GJ, Rao M, Stewart NJ, Wild JM. 129Xe-Rb Spin-Exchange Optical Pumping with High Photon Efficiency. Physical Review Letters 2018;121(15):153201.
- Choi HS, Haynor DR, Kim Y. Partial volume tissue classification of multichannel magnetic resonance images-a mixel model. IEEE transactions on medical imaging 1991;10(3):395-407.
- Tohka J. Partial volume effect modeling for segmentation and tissue classification of brain magnetic resonance images: A review. World journal of radiology 2014;6(11):855-864.
- Kilian W, Seifert F, Rinneberg H. Dynamic NMR Spectroscopy of Hyperpolarized 129Xe in Human Brain Analyzed by an Uptake Model. Magnetic Resonance in Medicine 2004;51(4):843-847.
- Herscovitch P, Raichle ME. What is the correct value for the brain--blood partition coefficient for water? Journal of cerebral blood flow and metabolism : official journal of the International Society of Cerebral Blood Flow and Metabolism 1985;5(1):65-69.
- Lu H, Clingman C, Golay X, van Zijl PC. Determining the longitudinal relaxation time (T1) of blood at 3.0 Tesla. Magn Reson Med 2004;52(3):679-682.
- Ethofer T, Mader I, Seeger U, Helms G, Erb M, Grodd W, Ludolph A, Klose U. Comparison of longitudinal metabolite relaxation times in different regions of the human brain at 1.5 and 3 Tesla. Magn Reson Med 2003;50(6):1296-1301.
- Dai W, Garcia D, de Bazelaire C, Alsop DC. Continuous flow-driven inversion for arterial spin labeling using pulsed radio frequency and gradient fields. Magn Reson Med 2008;60(6):1488-1497.
Figures