3094
Using Glutamate-Weighted Imaging (GluCEST) to Detect Effects of Transcranial Magnetic Stimulation to the Motor Cortex1Center for Magnetic Resonance and Optical Imaging, University of Pennsylvania, Philadelphia, PA, United States, 2Department of Psychology, Drexel University, Philadelphia, PA, United States, 3Laboratory for Cognition and Neural Stimulation, University of Pennsylvania, Philadelphia, PA, United States
Synopsis
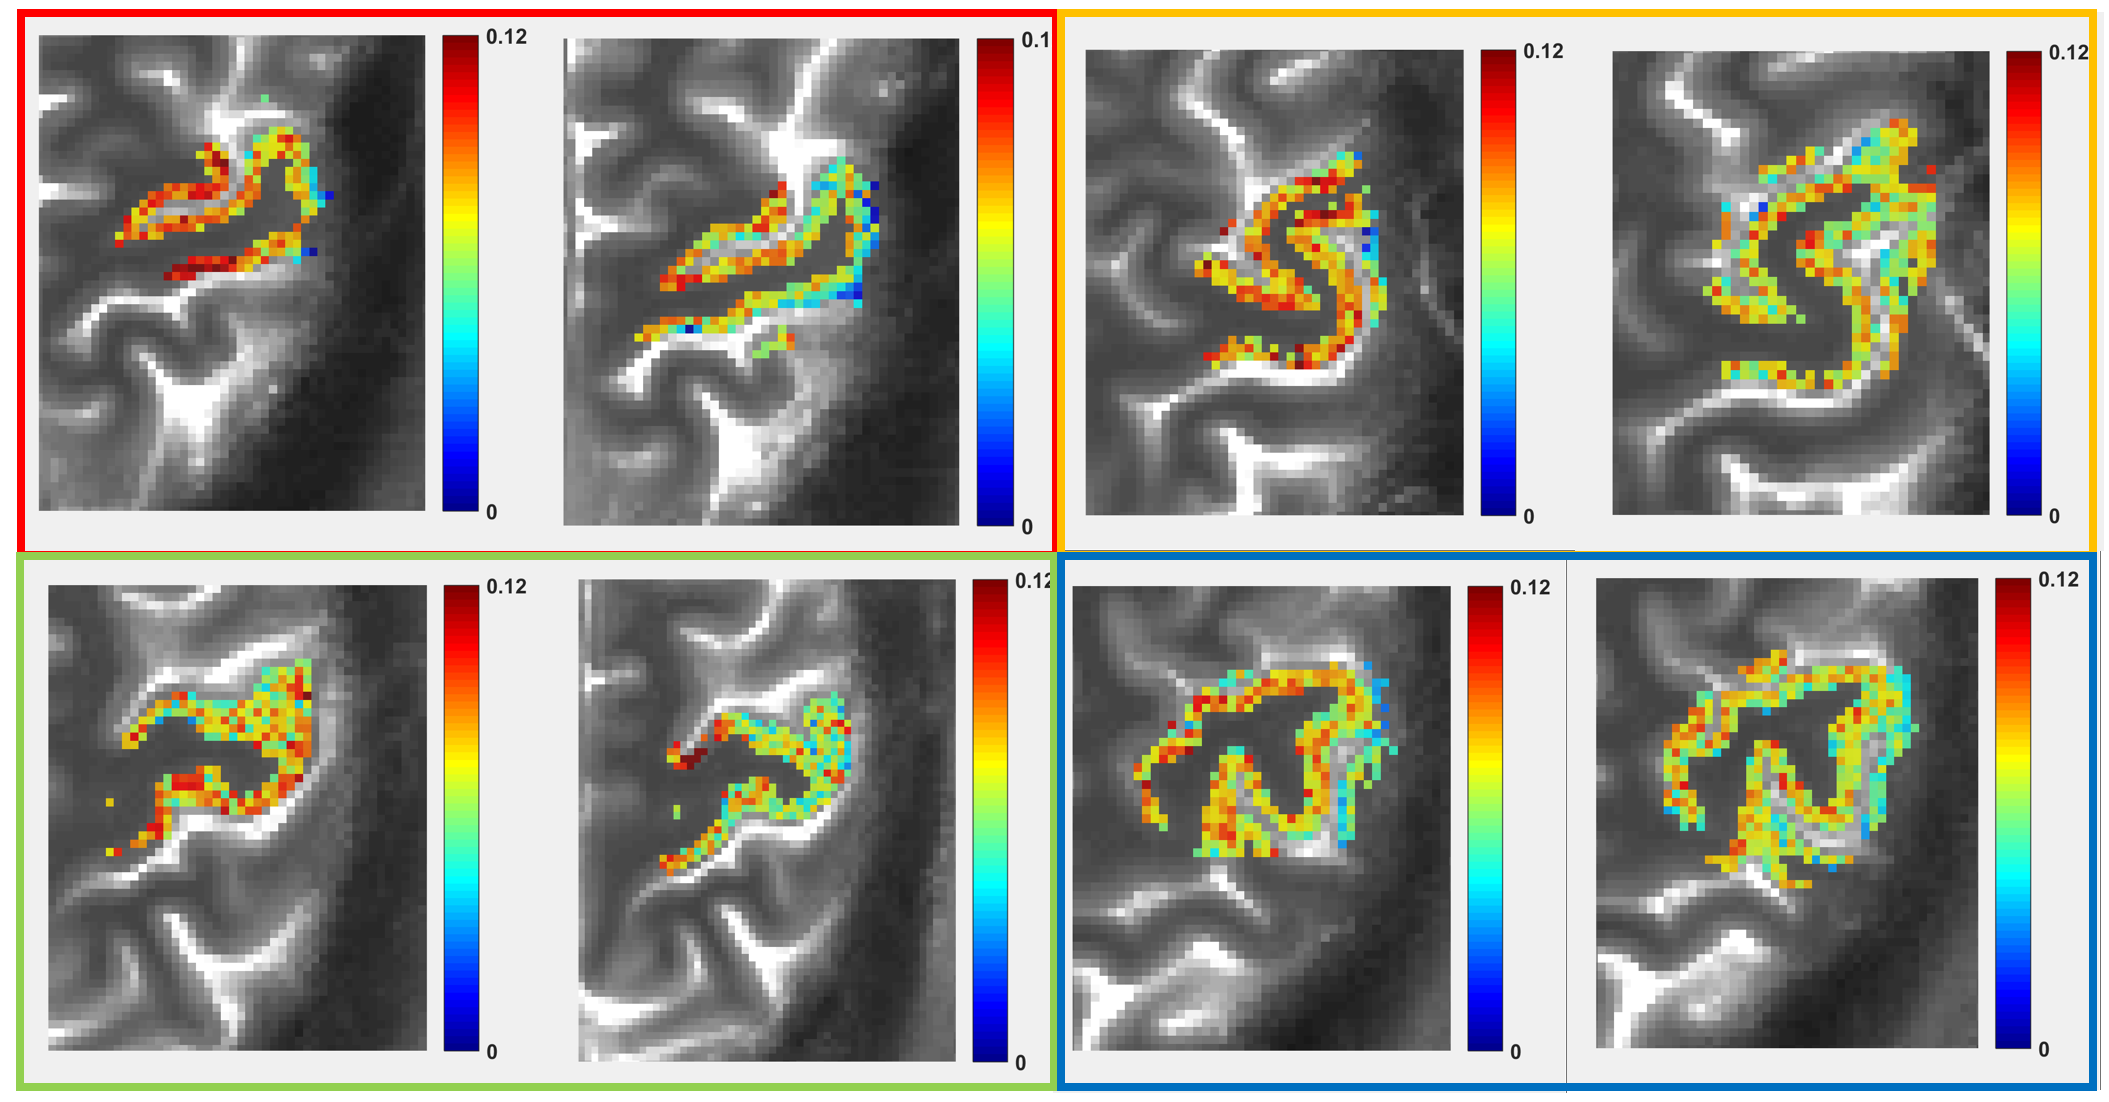
We used glutamate weighted Chemical Exchange Saturation Transfer (GluCEST) imaging to investigate changes in glutamate contrast in the brains of young, healthy adults undergoing transcranial magnetic stimulation (TMS) to the motor cortex. Subjects were scanned to acquire a 2D GluCEST map of a slice which includes the motor cortex, then removed from the scanner and given continuous theta burst stimulation (cTBS). Subjects were scanned again post-stimulation. The resulting images show a trend of decreasing GluCEST contrast in the gray matter of the motor cortex where stimulation was administered. Interestingly, initial GluCEST values appear to predict response to TMS.
Introduction
Since the Tofts work in 1990, transcranial magnetic stimulation (TMS) technology has undergone many iterations and improvements and is currently emerging as one of the crucial methods to probe brain function in humans (1,2,3). In current TMS practice, a figure eight coil is used to generate magnetic field that induces current in the brain tissue under the plane of coil, which induces excitability changes in the brain cortex. Different types of TMS paradigms-- including repetitive TMS (rTMS) and theta burst stimulation (TBS) -- appear to produce different effects, generally described as long-term potentiation (LTP) or long-term depression (LTD). Various forms of TMS are currently being used as a therapy for different neurological and psychiatric conditions. However, its physiological mechanisms are not yet clearly identified. Knowledge of underlying neurochemical and metabolic mechanisms of TMS would tremendously improve our ability to harness the power of TMS in the emerging era of precision medicine. Here, we used GluCEST MRI (4) to image the brains of subjects before and after undergoing continuous theta burst stimulation, a form of TMS.Methods
TMS and MEP measurements
cTBS as described in (5) was administered at 80% active motor threshold to a motor
cortex (M1) site that induced motor evoked potentials (MEPs)
measured using electromyography with electrodes on the skin over the right
first dorsal interosseus muscle in 5 subjects between repeated sessions of
GluCEST on a Siemens 7T TERRA MRI scanner using a 32-channel receive RF coil.
During a separate session, MEP changes in the subjects were measured
immediately after and 30 minutes after administration of cTBS.
Image Acquisition and Post-Processing
In routine experimental acquisition of GluCEST
data, we acquire: the CEST images at positive offset, the CEST images at
negative offset, a water saturation shift reference (WASSR) scan for B0
mapping, a flip/crush GRE sequence for B1 mapping, a T1
map (MP2RAGE) and a reference scan with only the acquisition module of the CEST
experiment (no saturation). The method for correcting the CEST data for B0
inhomogeneity has been described in (4). The method used in this study for
correcting the data for B1 inhomogeneity is newly developed, and
particularly improves results in slices with a high degree of B1
drop-off and a diversity of anatomical structures (6). In this technique, the B1
map is used to determine the local B1 amplitude of any given pixel,
and the T1 map is used as an ‘index scan’ to select the proper
calibration function for that pixel from the family of curves. For each offset
(positive and negative), the position on the calibration curve is converted
into a multiplicative correction factor for the signal attained in that
offset’s image. B1-corrected negative and positive images are
subtracted and normalized by the negative offset image to give the B1-corrected
CEST contrast. CEST-related images are collected only for single slice. Full-brain
T1 weighted images are also collected.
Results
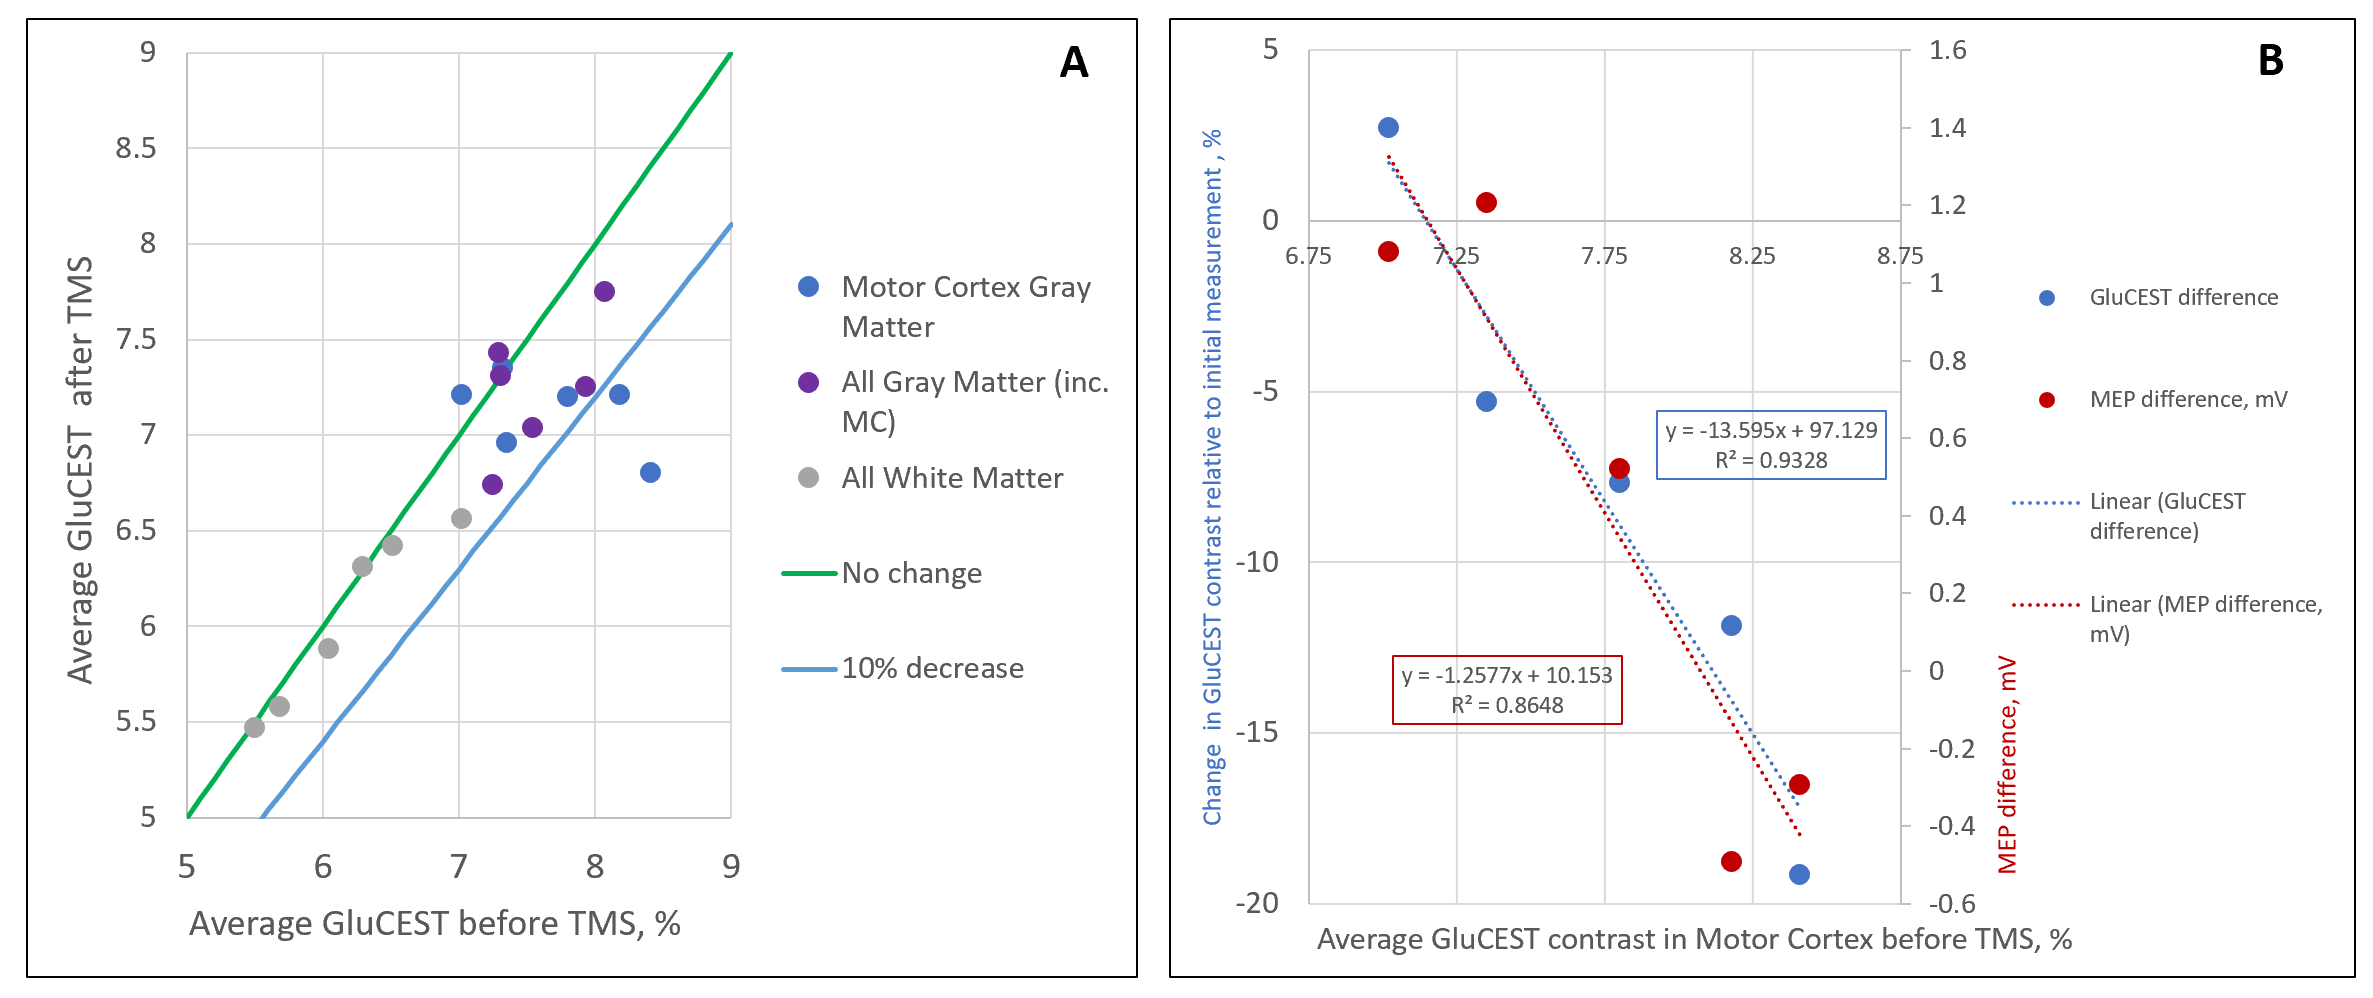
Overall, subjects tended to show a decrease in GluCEST contrast in the gray matter of the motor cortex after receiving TMS targeted at that region (Plot A). In our pilot cohort, the magnitude of this change varied from +2% to -19% of the baseline value, with a mean of -7%. Previous studies in our lab have shown the coefficient of variation in the GluCEST measurement to be ~5-7% (7) . Baseline GluCEST contrast in the motor cortex was strongly negatively correlated (R = -0.91) with changes in motor evoked potential (MEP), a standard measurement of the effects of TMS at the site of stimulation in terms of its excitatory or inhibitory effect on measurable motor activity in an individual subject (Plot B). In addition, changes in GluCEST contrast were strongly positively correlated (R = 0.84) with changes in MEP following TMS.Conclusions
Using GluCEST imaging, we were able to detect changes which appeared after transcranial magnetic stimulation. To the best of our knowledge, this is the first study that has used GluCEST from the motor cortex, rather than fMRI or spectroscopy, to investigate the TMS mechanism. Our preliminary results suggest that it may be possible to determine a threshold of GluCEST contrast at baseline (e.g. ~8%) which indicates that subjects are more likely to have an inhibitory response to the cTBS TMS paradigm. Given this trend, we envision that GluCEST MRI may be able to serve as a biomarker for predicting individual responses to TMS, the variability of which currently poses a challenge to clinicians administering TMS as a therapy.Acknowledgements
Research reported in this publication was supported by the National Institute of Biomedical Imaging and Bioengineering of the National Institutes of Health under award Number P41EB015893. A.T.J.C. would like to thank the subjects for their enthusiasm and perseverance during these experiments.References
1. Chervyakov AV, Chernyavsky AY, Sinitsyn DO, Piradov MA. 2015. Possible mechanisms underlying the therapeutic effects of transcranial magnetic stimulation. Front. Hum. Neurosci. 9:303. 2. Klomjai W, Katz R, Lackmy-Vallee A. 2015. Basic principles of transcranial magnetic stimulation (TMS) and repetitive TMS (rTMS). Annals of Phys. Rehab. Med. 58 (208-213). 3. Lefaucher JP et al. 2014. Evidence-based guidelines on the therapeutic use of repetitive transcranial magnetic stimulation (rTMS). Clinical Neurophysiology, 125 (2150-2206). 4. Cai K, Haris M, Singh A, Kogan F, Greenburg JH, Hariharan H, Detre JA, Reddy R. 2012. Magnetic Resonance Imaging of Glutamate. Nature Medicine, 18:22 (302). 5. Huang YZ, Edwards MJ, Rounis E, Bhatia KP, Rothwell JC. 2005. Theta Burst Stimulation of the Human Motor Cortex. Neuron, 45 (201-206). 6. Cember et al, in preparation 7. Nanga RPR, DeBrosse C, Kumar D, Roalf D, McGeehan B, D’Aquilla K, Borthakur A, Hariharan H, Reddy D, Elliot M, Detre JA, Epperson CN, Reddy R. 2018. Reproducibility of 2D GluCEST in healthy human volunteers at 7T. Magnetic Resonance in Medicine, 80:5 (2033-2039).Figures