3076
A cluster-based diffusion spectrum analysis of diffusion-attenuated signal in glioma1Institute of Science and Technology for Brain-inspired Intelligence, Fudan University, Shanghai, China, 2Department of Radiology, Huashan Hospital, Fudan University, Shanghai, China
Synopsis
We used a cluster-based method to investigate the diffusion-attenuated signal of glioma patients with different grades. The clustering results were analyzed by diffusion spectrum, which returns a continuous distribution of diffusion coefficient for a given attenuated signal. CSF, gray matter and white matter were clearly separated by Fuzzy C-means clustering. And some clusters showed sensitivity to interface between glioma-related tissues and normal tissues, which can be used for tumor delineation. High grade glioma tended to have clusters with smaller diffusivity and contained more types of clusters than low grade glioma.
Introduction
Quantitative analysis of the diffusion-attenuated signal is often sensitive to noise during curve fitting. Fuzzy C-means1 (FCM) clustering can sort the attenuated signals into several clusters, and analysis on these clusters will be more robust and efficient. Here, we used a FCM-based method to investigate the diffusion-attenuated signal of glioma patients with different grades. And the clustering results were assessed using diffusion spectrum, which returns a continuous distributed diffusion spectrum from a given attenuated signal.Materials and methods
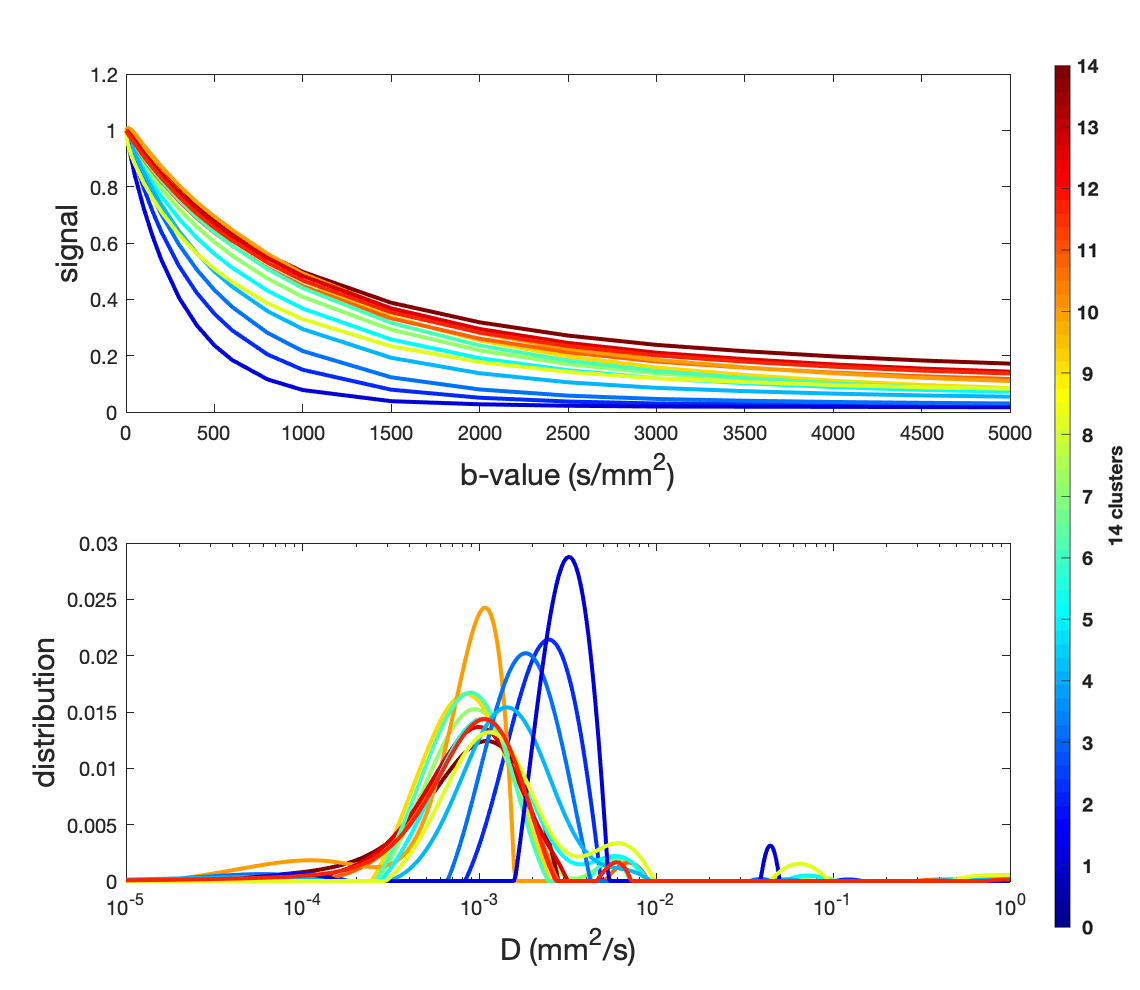
DWIs of 71 glioma patients (grade 2: N=37, grade 3: N=13, grade 4: N=21; age=44.8±14.8 years; 47 males and 24 females) were acquired at 22 b-values up to 5000 s/mm2. The diffusion-attenuated curves of all voxels were normalized (by dividing signal intensity of b0 image) and clustered into 20 clusters using FCM. Diffusion spectrum was calculated for each cluster, where the signal intensity $$$S$$$ is the integration of continuously distributed diffusion terms $$$S=\int c_ie^{-bD_i}dD$$$. The distribution coefficient $$$c_i$$$ was obtained using the regularized Non-Negative Least Squares2 (NNLS) fitting algorithm.
Results
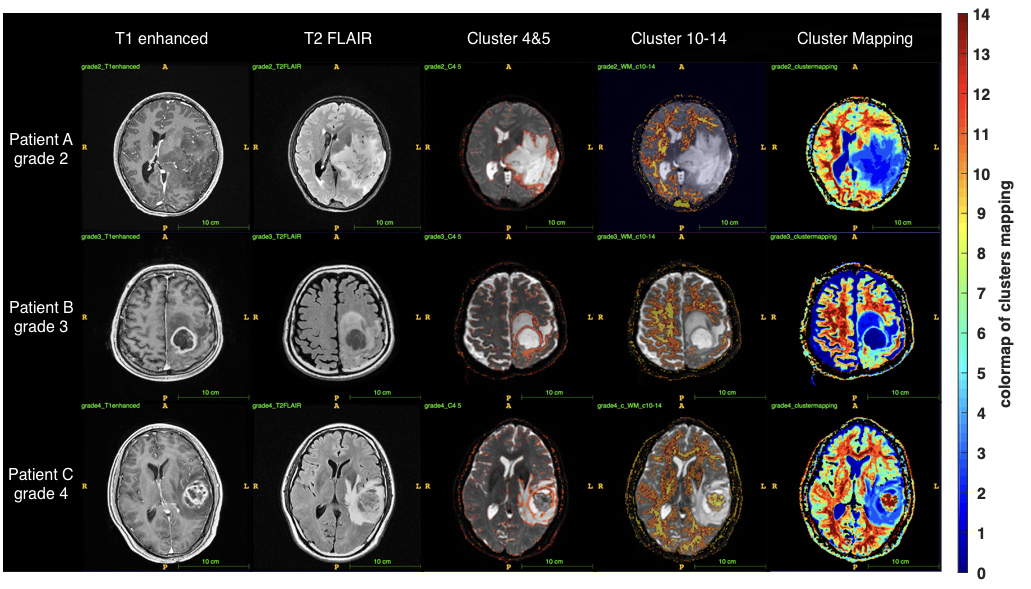
Images of 3 representative patients were displayed in Fig.1. Clustering results were first examined by cluster-mapping, where 14 out of 20 clusters were related to brain tissues. As shown in the last column in Fig.1 and Fig.2, water content (corresponding to cluster #1-3), gray matter (#6-9) and white matter (#10-14) were distinguished clearly. The other 6 clusters (#15-20) related to noise near the skull and were excluded in further analysis. Interestingly, glioma-related tissues were delineated by cluster 4 and 5, as shown in the third column in Fig.1. Signals of red-side clusters attenuated slower than blue-side, and the corresponding diffusion spectrums were slightly wider and had smaller diffusion coefficients. Tumor-related tissues in patient A (grade 2) were mainly occupied by blue clusters, while the glioma in patient C (grade 4) contained more kinds of clusters.Discussion
It’s not surprising that different brain tissues were successfully separated by FCM, because rich diffusion information underlying the attenuated signals were considered during clustering. The delineation of glioma by class 4 and 5 indicates that these two clusters are sensitive to interface between tissues. A rough delineation of gray and white matter can also be seen in patient B (grade 3). Because in the interface, different types of tissues may be contained in one voxel, and the mixed attenuated signal was sorted as a distinct cluster. The light blue cluster appeared in glioma-related regions of all three patients can be explained as edema, while the dark blue cluster seen in patient B represents necrosis. The red cluster in the center of glioma in patient C reflects the tumor substance with a more restricted diffusivity. Next, statistical features of cluster distributions of glioma with different grades will be further analyzed, to offer more details about the complex diffusion components contained in glioma.Conclusion
This combination of FCM clustering and diffusion spectrum analysis provides a robust way to quantify the diffusion-attenuated signal, and shows potential in tumor delineation and glioma grading.Acknowledgements
No acknowledgement found.References
1. J.C. Bezdek, R. Ehrlich, W. Full. FCM: The fuzzy c-means clustering algorithm. Computers & Geosciences. 10 (1984), 191-203.
2. Lawson, C. L. and R. J. Hanson. Solving Least-Squares Problems. Upper Saddle River, NJ: Prentice Hall. 1974. Chapter 23, p. 161.
Figures