3071
Grading of glioma using a machine learning framework based on optimized features obtained from quantitative DCE-MRI and SWI1Center for Biomedical Engineering, Indian Institute of Technology, Delhi, NEW DELHI, India, 2Philips Health Systems, Philips India Limited, Gurugram, India, 3Department of Radiology, Fortis Memorial Research Institute, Gurugram, India, 4Department of Biomedical Engineering, All India Institute of Medical Science, New Delhi, India, New Delhi, India
Synopsis
Potential of quantitative dynamic-contrast-enhanced(DCE) MRI parameters in glioma is well reported. However, in some glioma cases, biological
Introduction
Previous studies have reported the potential of quantitative dynamic-contrast-enhanced(DCE) MRI parameters in tumor grading1. Parameters such as CBV, CBF, Ve, Vp etc. are widely used but sometimes these parameters do not correlate with histopathological grade2-3. Angiogenesis acts as an important factor in evaluating malignancy of glioma4. It is widely believed that angiogenesis leads to progression of tumor from lower to higher grade4. Susceptibility-weighted-imaging(SWI) is useful in detecting micro-vasculature(i.e. indirect measure of angiogenesis). The existing methods of SWI analysis are semi-quantitative2, which counts Tumoral-Susceptibility-Signal(ITSS) (which is inclusive of hemorrhage and vasculature). Grading of glioma based on this manual count, can result in erroneous grading2,5,6. A Recent study5 has reported a quantitative approach that calculates the R2* relaxivity maps of ITSS, remove hemorrhages, hence calculating IVV(ITSS-vasculature-volume), within the glioma. The purpose of our study is to develop an approach for grading of glioma(grade-II vs. III and grade-III vs. IV) using quantitative DCE-MRI parameters or T1-perfusion combined with quantitative IVV obtained from SWI-MRI. We hypothesized that combining IVV with T1-perfusion MRI parameters using a supervised machine learning approach can improve glioma grading specifically for grade-II vs. III where perfusion parameters has been reported to underperform.Methods
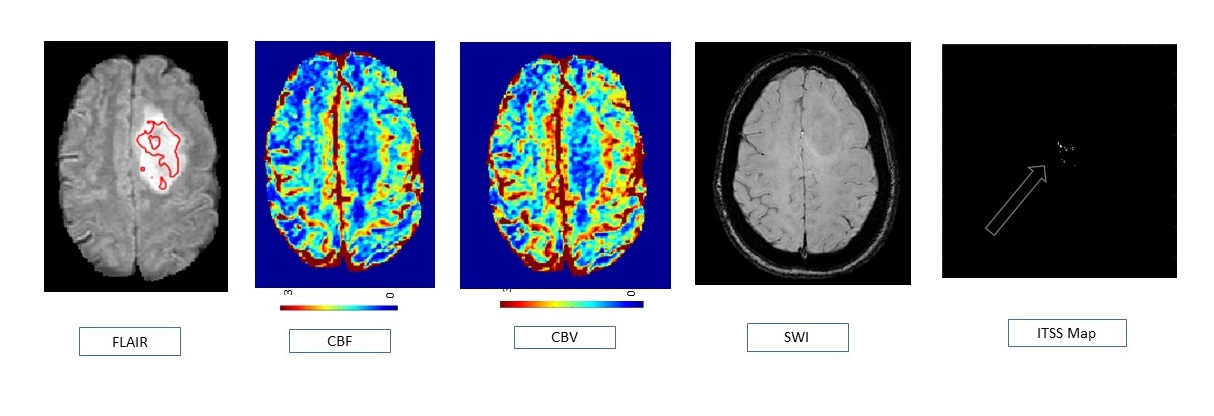
In this IRB-approved-retrospective study we have acquired MRI data of 30 glioma patients (pre-surgery: 8 of grade -II, 9 of grade-III, 13 of grade-IV) at a local hospital on a 3T whole-body MRI (Ingenia, Philips Healthcare, The Netherlands). The MRI protocol for this study included structural(T1, T2, PD-weighted), FLAIR, SWI, DCE-MRI data. DCE-MRI data was processed1 using generalized-tracer-kinetic-model(GTKM), first-pass-analysis and piecewise-linear model to obtain tracer kinetic parameters(Ktrans, Ve, Vp), hemodynamic parameters(CBFNWM and CBVcorrNWM) and shape-based parameter(slope-1,slope-2,BAT,Beta). The lesion region was segmented out into its subparts(enhancing, non-enhancing, necrotic and edema) using region growing based semi-automated technique7. The region-of-interest(ROI) for glioma grading was taken to be the combined enhancing and non-enhancing region as suggested by RANO criterion8. The mean of the top 90th percentile of T1 perfusion MRI parameters from the selected ROI was used as equivalent of ‘hot-spot’ value in this study. R2* maps were calculated from SWI data set and ITSS mask was generated5. IVV was obtained from the selected ROI and combined with T1 perfusion MRI parameters to form the feature set for this study. Statistical analysis on all the features was performed for each of the grades. Next, a Support-Vector-Machine(SVM) classifier was optimized for differentiating between intermediate glioma grades as well as multiple grades using individual features, combination of all features and optimal features obtained from combined feature set using Sequential-Backward-Selection(SBS).Results
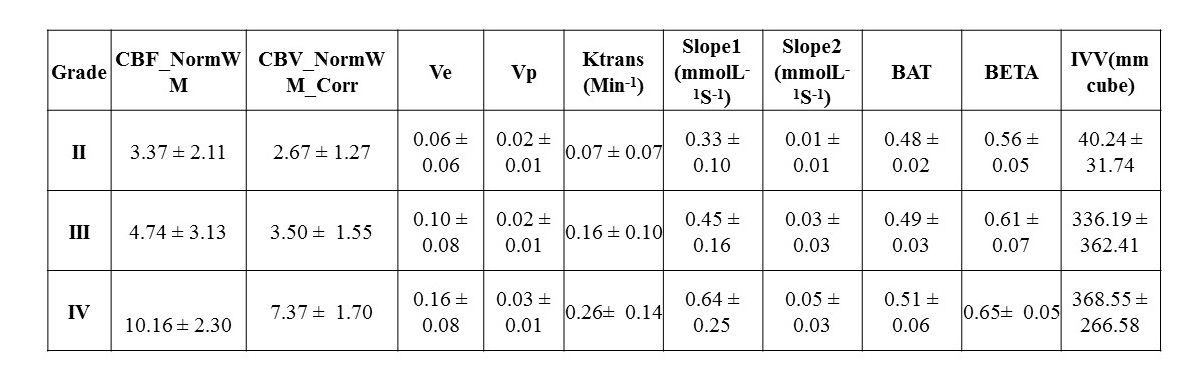
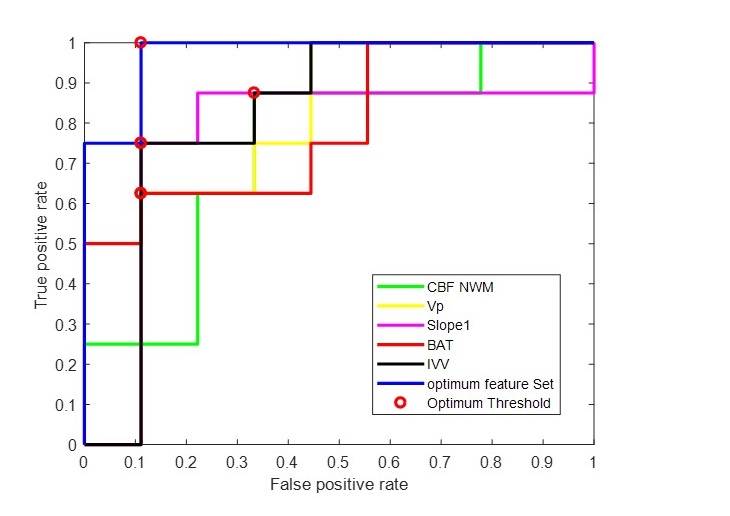
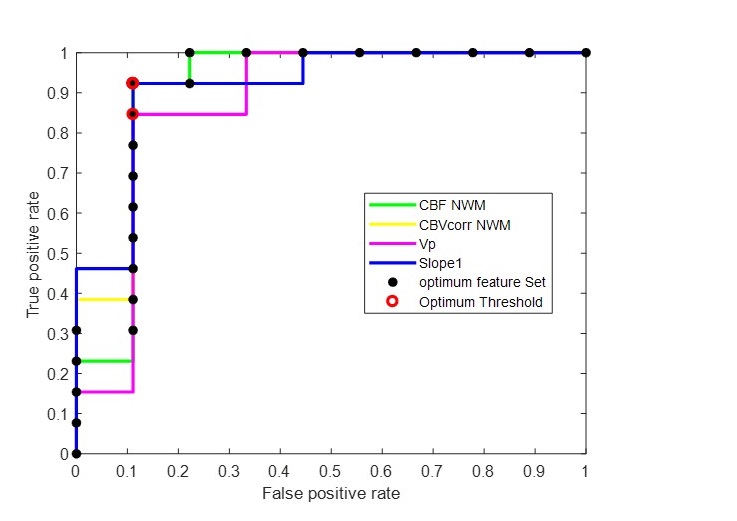
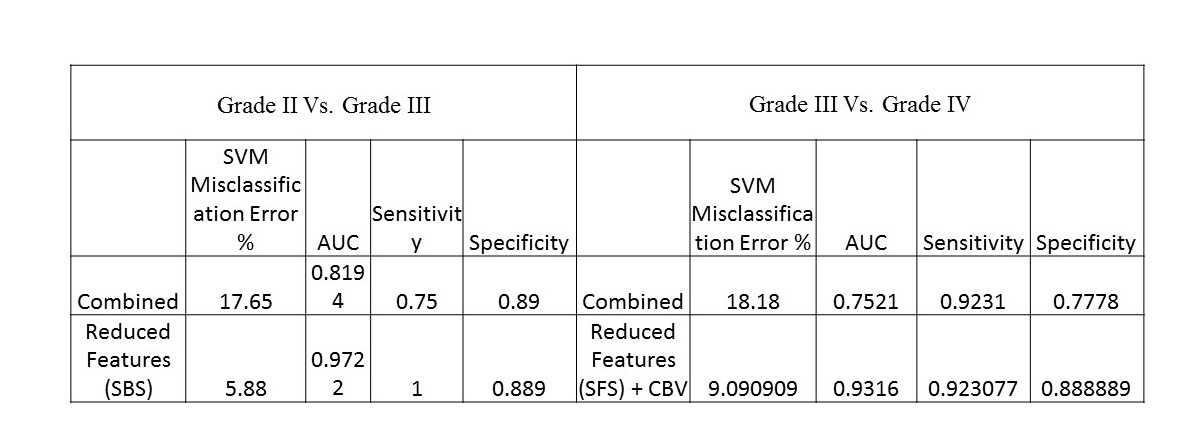
It was found that mean values of different features increased with increase in grade(Table1). However, there was considerable overlap between intermediate grades as evident from the high S.D. in each grade. Figure-1 shows the case of a representative glioma patient belonging to grade II, which would be wrongly classified into grade-III based on haemodynamic parameters CBFNWM and CBVcorrNWM as well as tracer-kinetic-parameter Ktrans. However, based on IVV obtained from SWI image, it was classified into grade II by the developed classifier. ROC analysis results for grade II vs. III (Figure2) show that the AUC obtained using optimal feature set was considerably higher than all features which had individual AUC>0.7. However, ROC analysis for grade-III vs. IV(Figure-3) shows that optimal feature set performs same as using the best performing features CBVcorrNWM and Slope1. Table-2 shows that optimal feature set reduces misclassification error(5.88%) and increases Sensitivity, Specificity and AUC obtained from ROC analysis for both grade-II vs. III and III vs. IV.Discussion
The results show that combining IVV with T1-perfusion parameters improve grading in case of grade-II vs. III. It has been reported previously that there is overlap of perfusion characteristics between grade-II and III9. The proposed methodology of combining IVV with T1-perfusion parameters using a machine learning classifier can be useful in such cases. This may be due to the fact than SWI represents overall vasculature; however, CBV can be high even if less vasculature is present. This study also highlighted the benefit of using feature selection for reducing misclassification by removing redundant features from the combined feature set. However, for grade-III vs. IV the parameters specifically CBVcorrNWM and Slope1 are superior to IVV individually and combining them does not improve differentiation between them. In grade-III and IV vasculature is high and due to this CBVcorr might be providing similar information.Conclusion
The proposed study highlights the importance of combining IVV along with quantitative DCE-MRI parameters, particularly in differentiating between grade-II vs. III.Acknowledgements
No acknowledgement found.References
1. Singh, Anup, et al. "Quantification of physiological and hemodynamic indices using T1 dynamic contrast‐enhanced MRI in intracranial mass lesions." Journal of Magnetic Resonance Imaging: An Official Journal of the International Society for Magnetic Resonance in Medicine 26.4 (2007): 871-880.
2. Park, M. J., et al. "Semiquantitative assessment of intratumoral susceptibility signals using non-contrast-enhanced high-field high-resolution susceptibility-weighted imaging in patients with gliomas: comparison with MR perfusion imaging." American Journal of Neuroradiology 30.7 (2009): 1402-1408. 3. Li, Xiaoguang, et al. "Glioma grading by microvascular permeability parameters derived from dynamic contrast-enhanced MRI and intratumoral susceptibility signal on susceptibility weighted imaging." Cancer Imaging 15.1 (2015): 4.
4. Onishi, Manabu, et al. "Angiogenesis and invasion in glioma." Brain tumor pathology 28.1 (2011): 13-24.
5. Bhattacharjee R, et al. Quantitative Micro-Vasculature Volume Assessment of Intra Tumoral Susceptibility Signal (ITSS) in differentiating Grade-III from IV glioma. ISMRM-ESMRMB 2018, Paris, France (Proc.Intl.Soc.Mag.Reson.Med. 26(2018), Page Nu-3420).
6. Saini, Jitender, et al. "Differentiation of grade II/III and grade IV glioma by combining “T1 contrast-enhanced brain perfusion imaging” and susceptibility-weighted quantitative imaging." Neuroradiology 60.1 (2018): 43-50.
7. Sengupta, Anirban, et al. "On differentiation between vasogenic edema and non-enhancing tumor in high-grade glioma patients using a support vector machine classifier based upon pre and post-surgery MRI images." European journal of radiology 106 (2018): 199-208.
8. Pope, W. B., and C. Hessel. "Response assessment in neuro-oncology criteria: implementation challenges in multicenter neuro-oncology trials." (2011): 794-797.
9. Wiestler, Benedikt et al. “Multiparametric MRI-based differentiation of WHO grade II/III glioma and WHO grade IV glioblastoma” Scientific reports vol. 6 35142. 14 Oct. 2016, doi:10.1038/srep35142
Figures