3070
Differentiation of Non-enhancing tumor region from Vasogenic edema in high-grade glioma using a machine learning framework based upon conventional MRI feature1Centre for Biomedical Engineering, IIT Delhi, New Delhi, India, 2NIT kurukshetra, Kurukshetra, India, 3Electrical Engineering, IIT Delhi, Hauz Khas, New Delhi, India, 4Fortis Memorial Research Institute, New Delhi, India, 5IIT Delhi, New Delhi, India, 6University of Pennysylvania, Philadelphia, PA, United States
Synopsis
Differentiation between non-enhancing tumor (NET) from vasogenic edema (VE) in glioma patients is difficult using conventional MRI parameters (CMP) such as FLAIR, T2-W, T1-W and PD-W as they appear similar in intensity in both the regions. T1 perfusion MRI parameters (T1-PMP) have been found useful in differentiating between NET and VE previously. The work in this study shows that combining different CMP using a machine learning algorithm improves differentiation between NET and VE substantially over using any individual CMP. However, combination of T1-PMP still performs slightly better than combination of CMP in differentiating NET from VE.
INTRODUCTION
The Response-Assessment-in-Neuro-Oncology or RANO1 criterion has recommended combining non-enhancing tumor (NET) along with enhancing tumor for treatment of high-grade glioma (HGG) patients. Differentiation of NET from vasogenic edema (VE) using conventional MRI parameters is difficult because both appear hyperintense in T2-W/FLAIR images2,3. In previous studies, it has been shown that T1 perfusion MRI parameters (T1-PMP) are good differentiators between NET and VE2–4. The goal of this study is to estimate the efficacy of conventional MRI parameters (CMP) such as FLAIR, T1-W, T2-W, and PD-W images in differentiating between NET and VE using a supervised machine learning classifier and compare them with results obtained using T1-PMP. It is hypothesized that combining different CMP may improve the accuracy over using any individual CMP by using complimentary information from different images.METHODS
Conventional MRI images of the brain acquired in the study included 2D-dual PD-T2, 2D- T1-W Turbo-spin-echo, 3D FLAIR and post-contrast T1-W image. Dynamic contrast-enhanced (DCE)-MRI data was acquired for the study and was analyzed using generalized tracer-kinetic model5 and first-pass analysis6 to obtain T1-PMP. The ground truth for NET was obtained from pre and post-surgery MRI images of 9 glioma patients and that for vasogenic edema was obtained from 9 metastasis patients using a previously published method which is devoid of radiologist subjectivity7. Histopathological analysis of surgeried tissue of glioma patients was done to validate the proposed ground truth of NET region. Conventional MRI images were normalized between 0-255. CMP values were computed from NET and VE region and was used as features for this study. Statistical analysis was done using the CMP for differentiating between NET and VE. A Support-Vector-Machine (SVM) classifier was trained and optimized with respect to its hyperparameters (C and γ) based upon 9 Fold cross-validation error, for differentiating between NET and VE using CMP individually and also in combination. Optimized smoothing was performed on the results of the SVM classifier to incorporate neighborhood information for further improving accuracy. Receiver-operating characteristics (ROC) analysis was done based on the results of SVM classifier. The results were compared with previously published results obtained using T1-PMP on the same cohort8.RESULTS
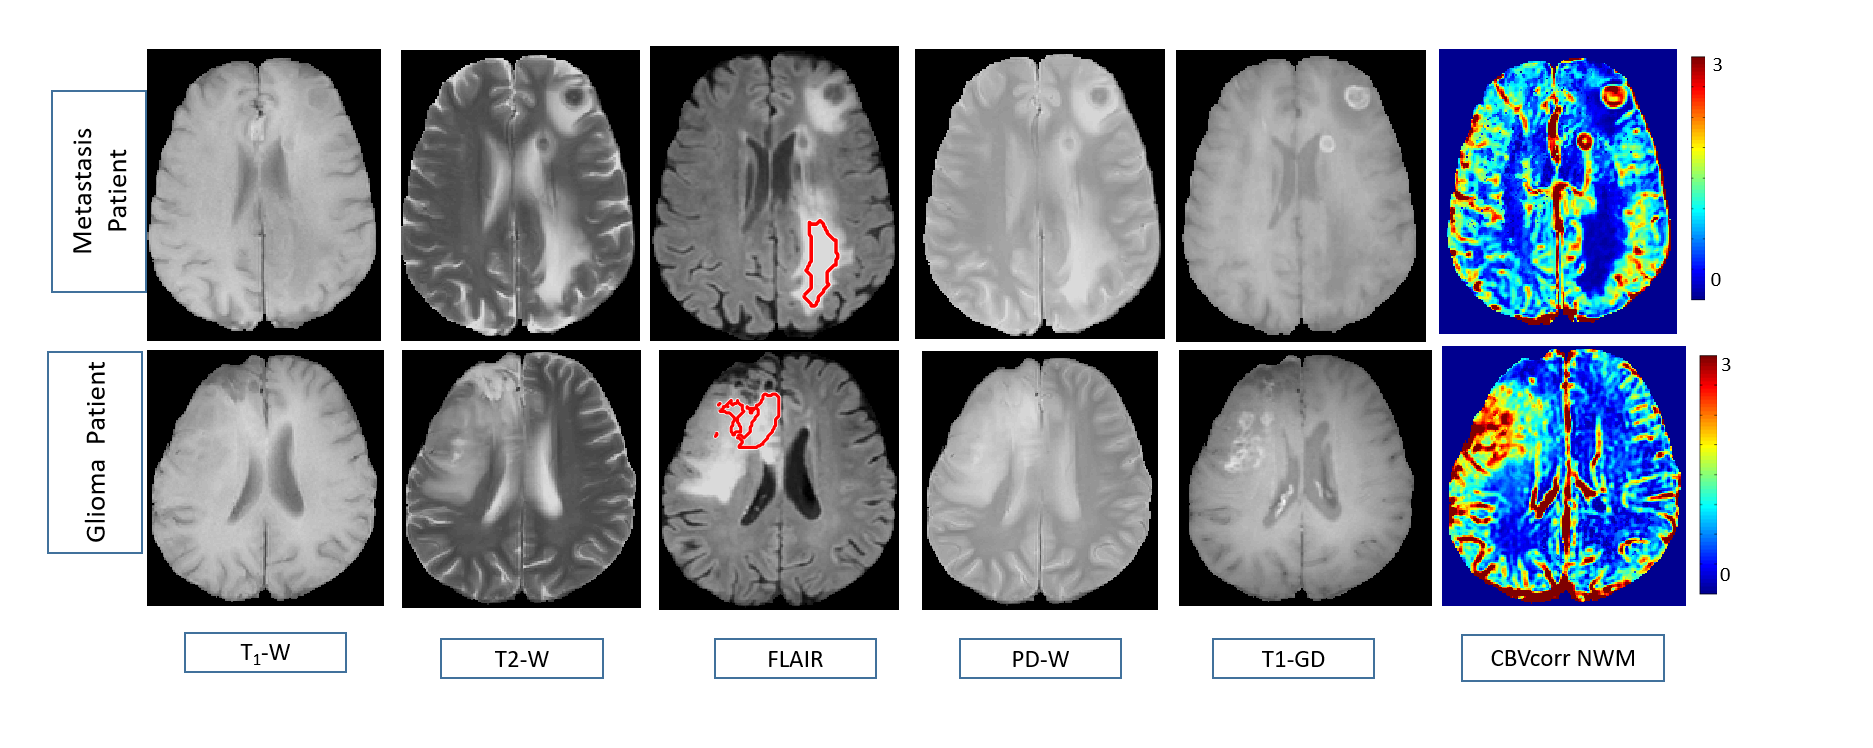
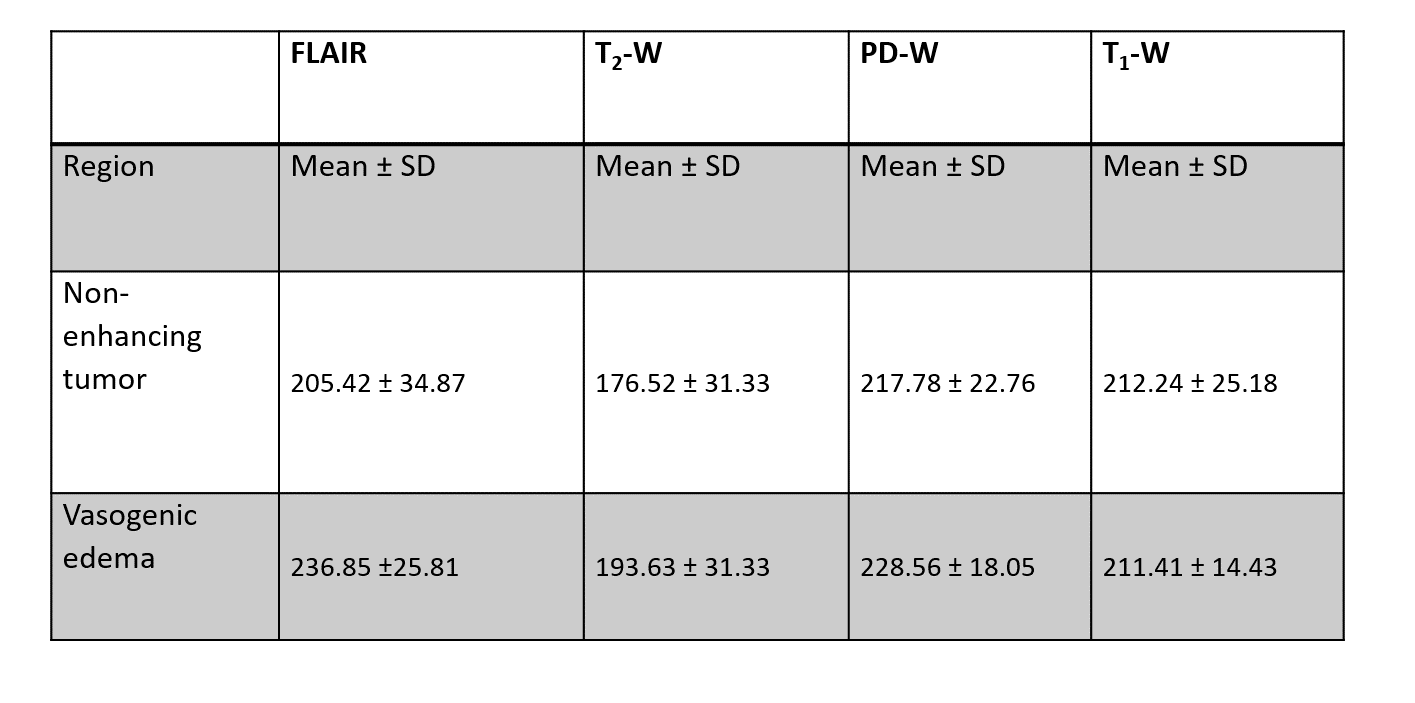
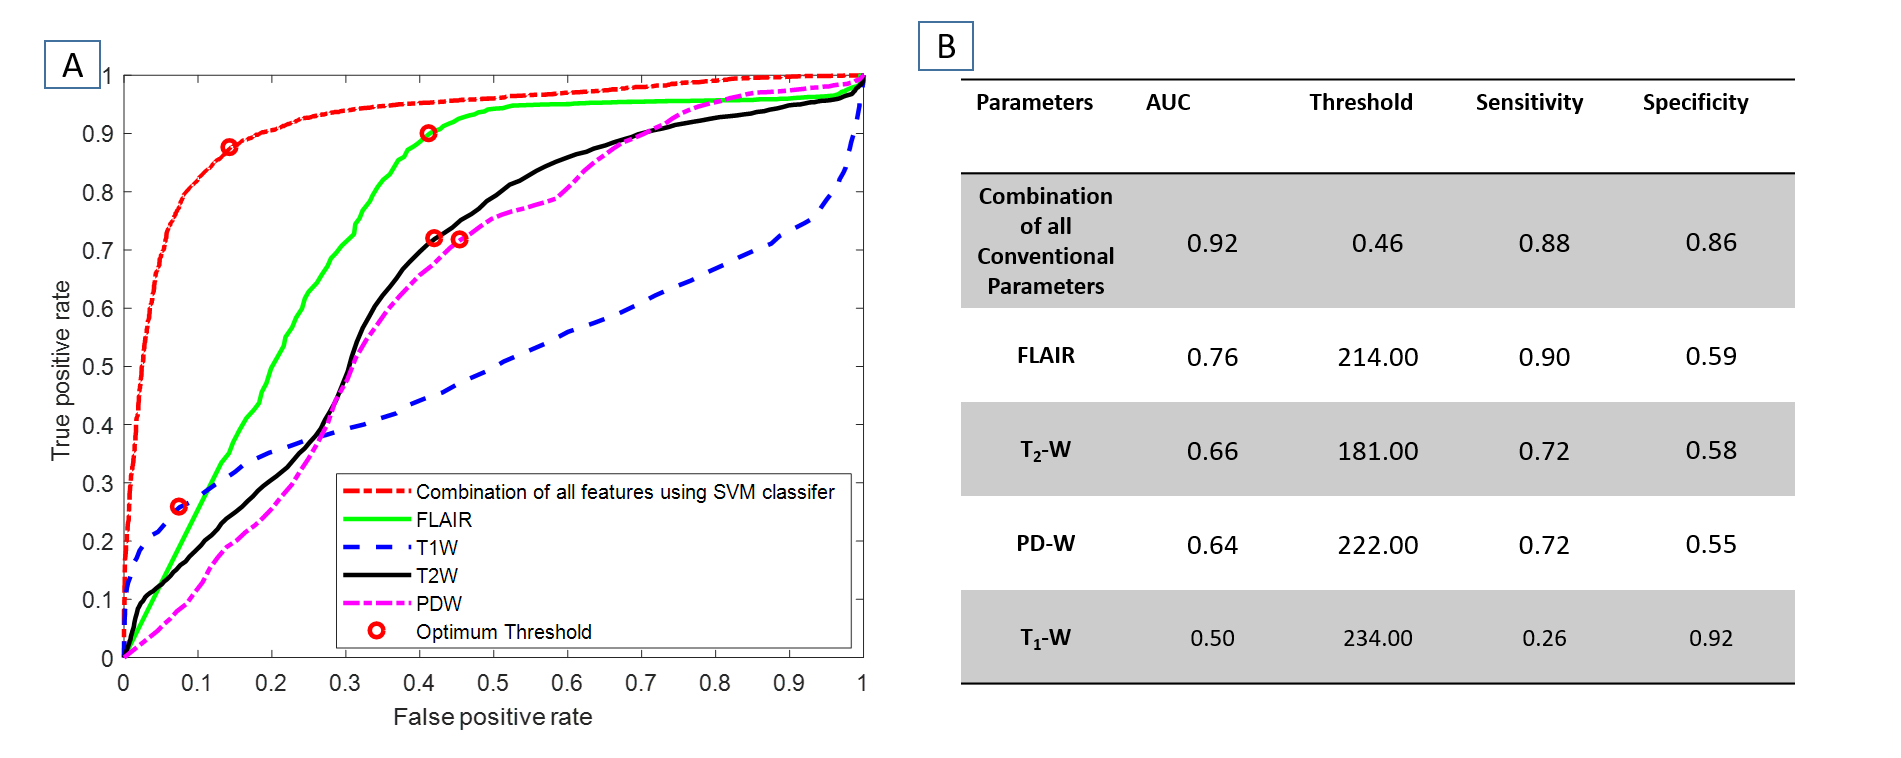
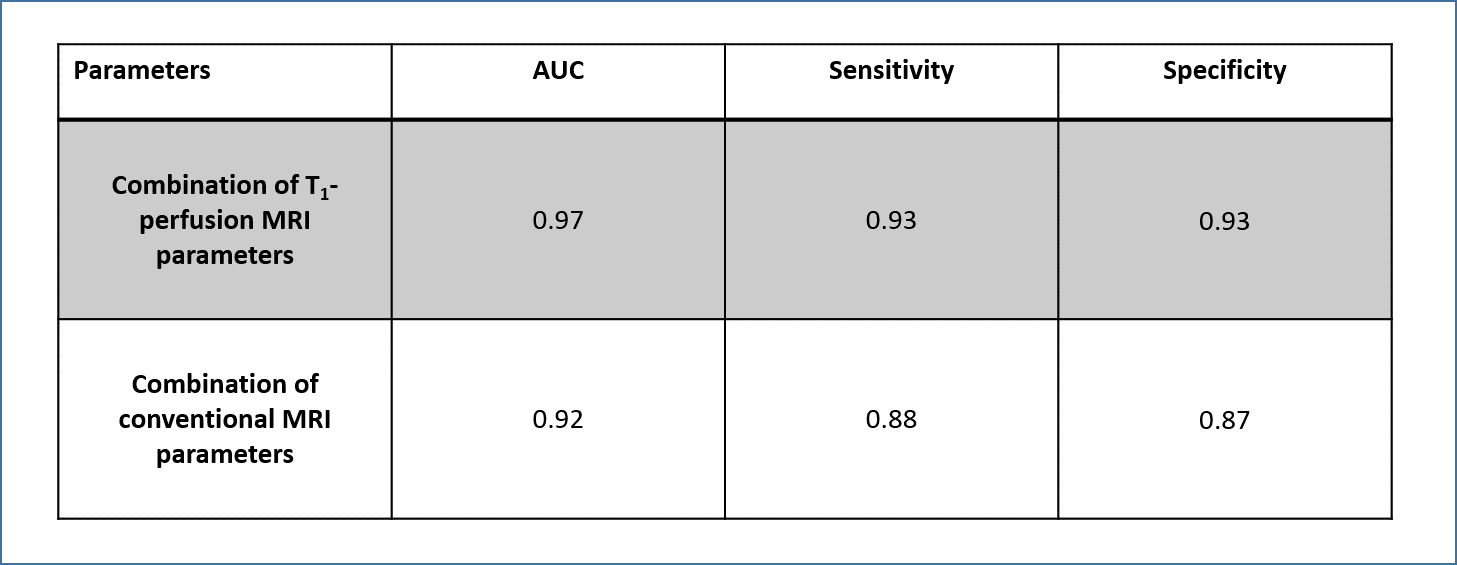
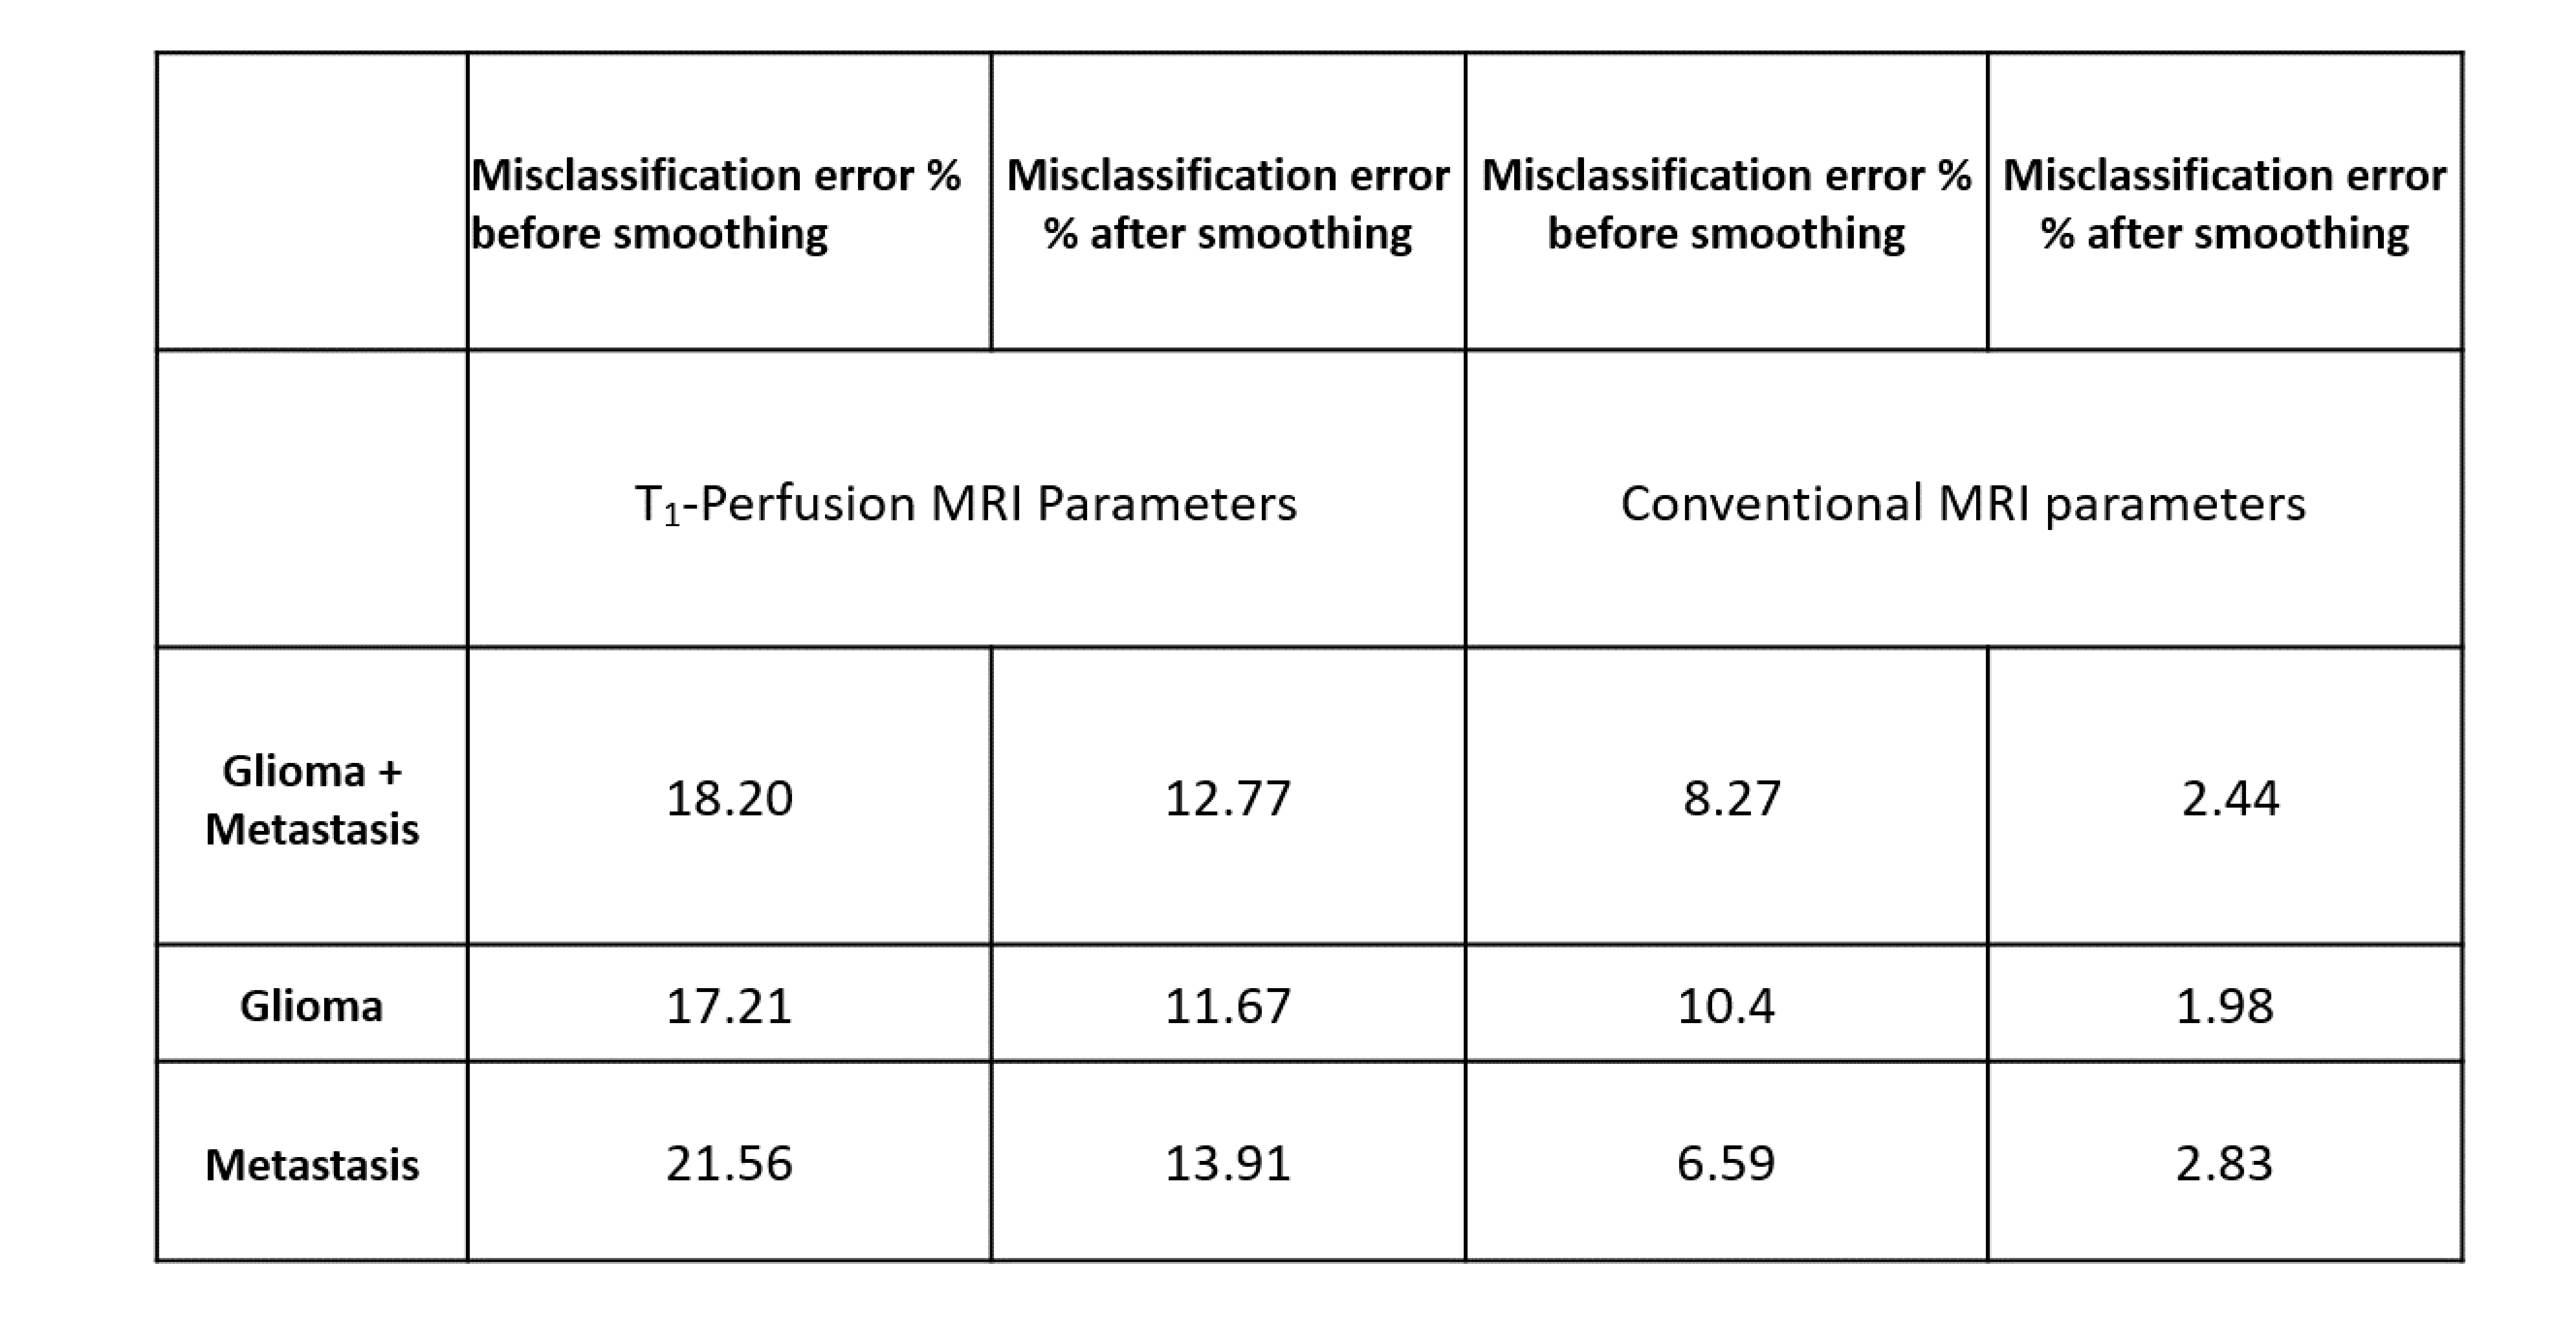
Histopathological results show that majority of the surgeried tissue (93 %) comprises of tumorous tissue thus validating the authenticity of the used ground truth for NET. Figure1 shows that FLAIR, T2-W and PD-W image appear hyperintense both in NET and VE region. Statistical analysis in Table1 showed that among CMP, FLAIR had the highest difference in mean value between NET and VE followed by T2-W, PD-W and T1-W parameters. The high S.D. of different CMP signified there is considerable overlap between the two regions as also evident from box plot analysis (results not shown). ROC analysis results in Figure2 show that combination of CMP yields an AUC of 0.925 which is considerably higher than the individual highest AUC of 0.76 by FLAIR parameter. The comparative analysis results as obtained from Table2 and Table3 show that T1-PMP parameters are better differentiators between NET and VE than conventional MRI parameters in terms of higher AUC (0.97 vs. 0.92) and lower misclassification error. (2.4 % vs. 12.77 %). Results also show that smoothing over SVM obtained results improves differentiation between the two regions substantially as misclassification error % drops to 12.77 % from 18.20 % in case of CMP.DISCUSSION
The results showed that although different CMP appear similar in NET and VE region, still there is substantial difference in values between two regions for FLAIR, T2-W and PD-W as evident by the difference in their means. This is further evident by the moderate AUC values obtained from those CMPs in ROC analysis for differentiating between NET and VE. Combining the different CMP leads to substantial improvement in differentiation as evident by the high AUC and low misclassification error. This signifies that using complimentary information from the different CMP can result in improved differentiation between NET and VE. However, T1-PMPs are still better differentiators between NET and VE compared to combination of CMP. Feature selection may further improve differentiation between NET and VE using CMP by removing redundant features.CONCLUSION
The results show that it is feasible to differentiate NET from VE in high-grade glioma patients using combination of conventional MRI images, although results are slightly inferior compared to those obtained using T1-PMP. This technique can be useful in hospitals where quantitative DCE-MRI analysis is not feasible.Acknowledgements
The Authors acknowledge technical support of Philips India Limited in MRI data acquisition. This work was supported by Science and Engineering ResearchBoard (IN) (YSS/2014/000092).References
1.Wen PY, Macdonald DR, Reardon DA, et al. Updated response assessment criteria for high-grade gliomas: Response assessment in neuro-oncology working group. J Clin Oncol. 2010;28(11):1963-1972. doi:10.1200/JCO.2009.26.3541
2.Blumenthal DT, Artzi M, Liberman G, Bokstein F, Aizenstein O, Ben Bashat D. Classification of High-Grade Glioma into Tumor and Nontumor Components Using Support Vector Machine. Am J Neuroradiol. 2017;38(5):908-914. doi:10.3174/ajnr.A5127
3.Liberman G, Louzoun Y, Aizenstein O, et al. Automatic multi-modal MR tissue classification for the assessment of response to bevacizumab in patients with glioblastoma. Eur J Radiol. 2013;82(2):e87-e94. doi:10.1016/j.ejrad.2012.09.001
4.Artzi M, Blumenthal DT, Bokstein F, et al. Classification of tumor area using combined DCE and DSC MRI in patients with glioblastoma. J Neurooncol. 2015;121(2):349-357. doi:10.1007/s11060-014-1639-3
5.Tofts PS, Kermode AG. Measurement of the blood-brain barrier permeability and leakage space using dynamic MR imaging. 1. Fundamental concepts. Magn Reson Med. 1991;17(2):357-367. http://www.ncbi.nlm.nih.gov/entrez/query.fcgi?cmd=Retrieve&db=PubMed&dopt=Citation&list_uids=2062210. Accessed June 3, 2016.
6.Singh A, Haris M, Rathore D, et al. Quantification of physiological and hemodynamic indices using T1 dynamic contrast-enhanced MRI in intracranial mass lesions. J Magn Reson Imaging. 2007;26(4):871-880.
7.Falkner JC, Al-Somali AM, Jamison JA, et al. Generation of size-controlled, submicrometer protein crystals. Chem Mater. 2005;17(10):2679-2686. doi:10.1016/j.ejrad.2018.07.018
8.Sengupta A, Agarwal S, Gupta PK, et al. On Differentiation between Vasogenic Edema and Non-Enhancing Tumor in High-Grade Glioma Patients using Support Vector Machine Classifier based upon Pre and Post Surgery MRI Images. Eur J Radiol. 2018;106:199-208. doi:10.1016/J.EJRAD.2018.07.018
Figures