3069
Grading of glioma using a machine learning framework based on optimized features obtained from T1 perfusion MRI and volumes of tumor components1Centre for Biomedical Engineering, IIT Delhi, New Delhi, India, 2Electrical Engineering, IIT Delhi, Hauz Khas, New Delhi, India, 3Fortis Memorial Research Institute, New Delhi, India, 4IIT Delhi, New Delhi, India, 5University of Pennysylvania, Philadelphia, PA, United States
Synopsis
Grading of glioma based on T1 perfusion MRI parameters is well reported but it has certain challenges specially in differentiating intermediate glioma grades (Grade II vs. III and Grade III vs. IV). In this study, we have differentiated intermediate as well as multiclass glioma grades (Grade II vs. III vs. IV) using an optimized machine learning framework which uses quantitative T1 perfusion MRI parameters in combination with volume of different components of tumor as a feature set. The results show that it is feasible to obtain low error in glioma grading using the proposed methodology. The results also emphasizes the utility of using volume of tumor subparts in conjunction with T1 perfusion MRI parameters for glioma grading.
INTRODUCTION
Grading of glioma helps in diagnosis and treatment planning of the patient. Glioma grading using T1 perfusion MRI parameters (T1–PMP) has been reported previously1–3. However, low-grade (LG) oligodendrogliomas has been found to be more vascular than LG astrocytoma and hence differentiating them based on perfusion parameters is difficult4,5. Region-of-Interest (ROI) selection for glioma grading based on traditional ‘hot-spot’ method is subjective in nature which can result in erroneous results6. Inclusion of prominent vessels within selected ROI can result in erroneous estimation of T1–PMP and hence can result in erroneous grading7. The purpose of this study is to devise a method for differentiating between intermediate glioma grades (Grade II vs. III and Grade III vs. IV) as well as multiple glioma grades (Grade II vs. III vs. IV) addressing the challenges mentioned above, using a supervised machine learning classifier. We hypothesize that using volume percentage of different tumor components in conjunction with T1–PMP may improve glioma grading.METHODS
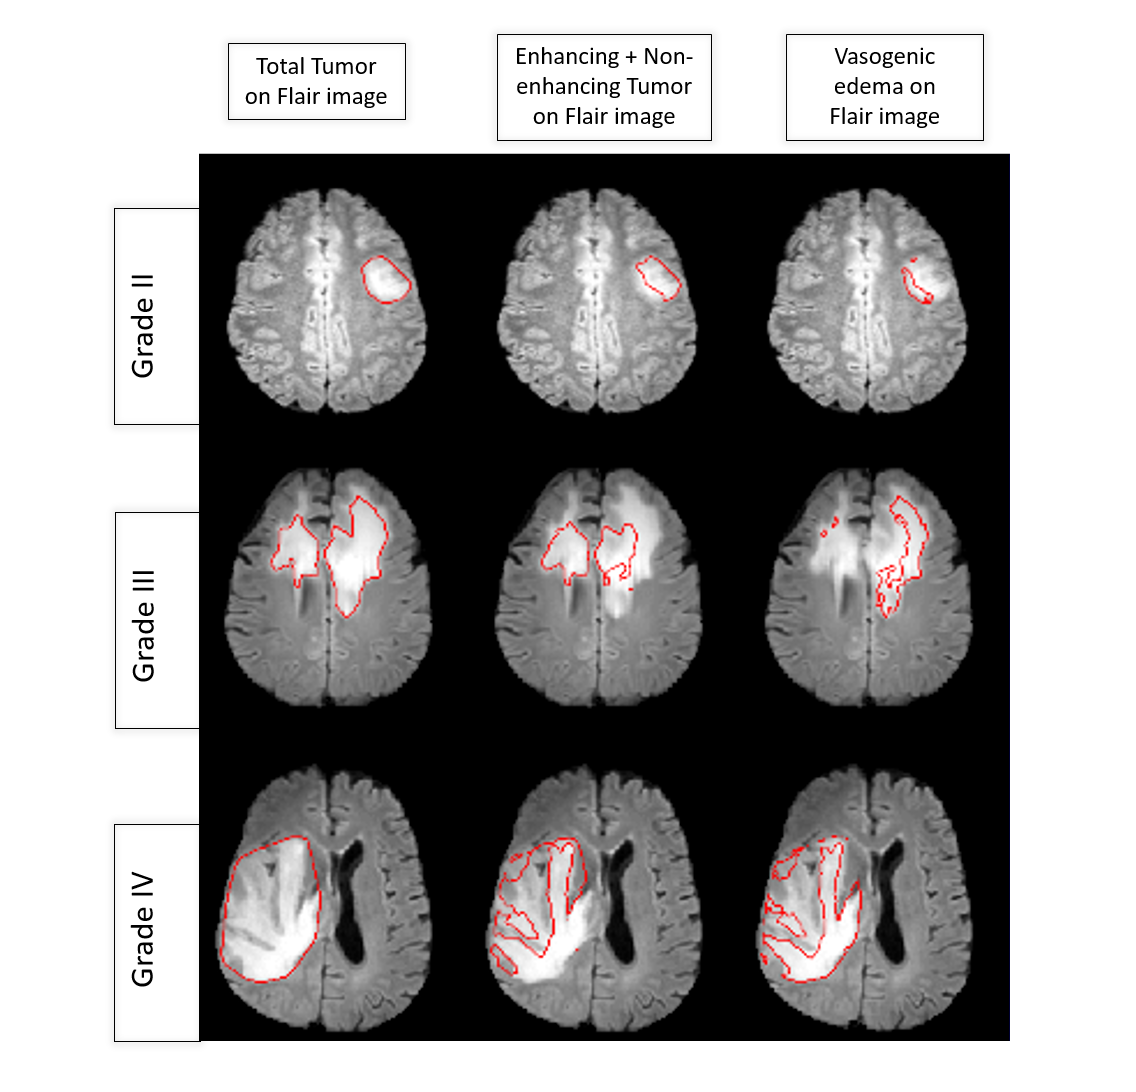
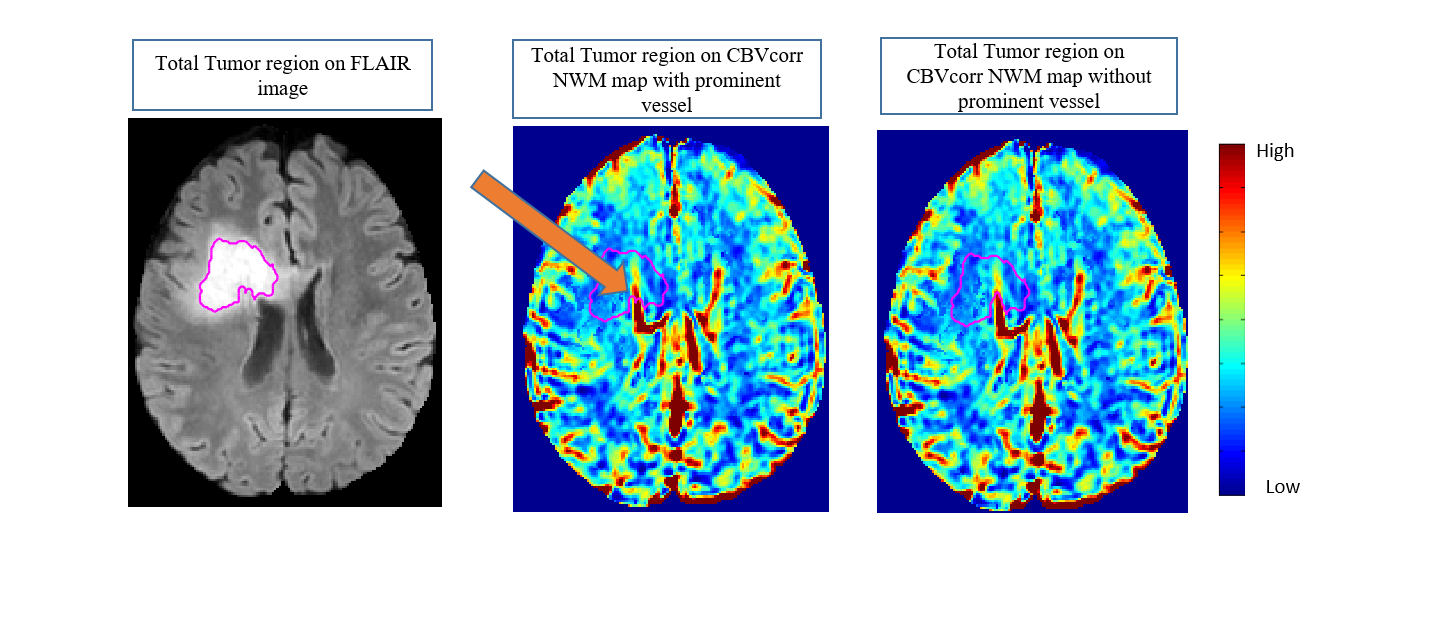
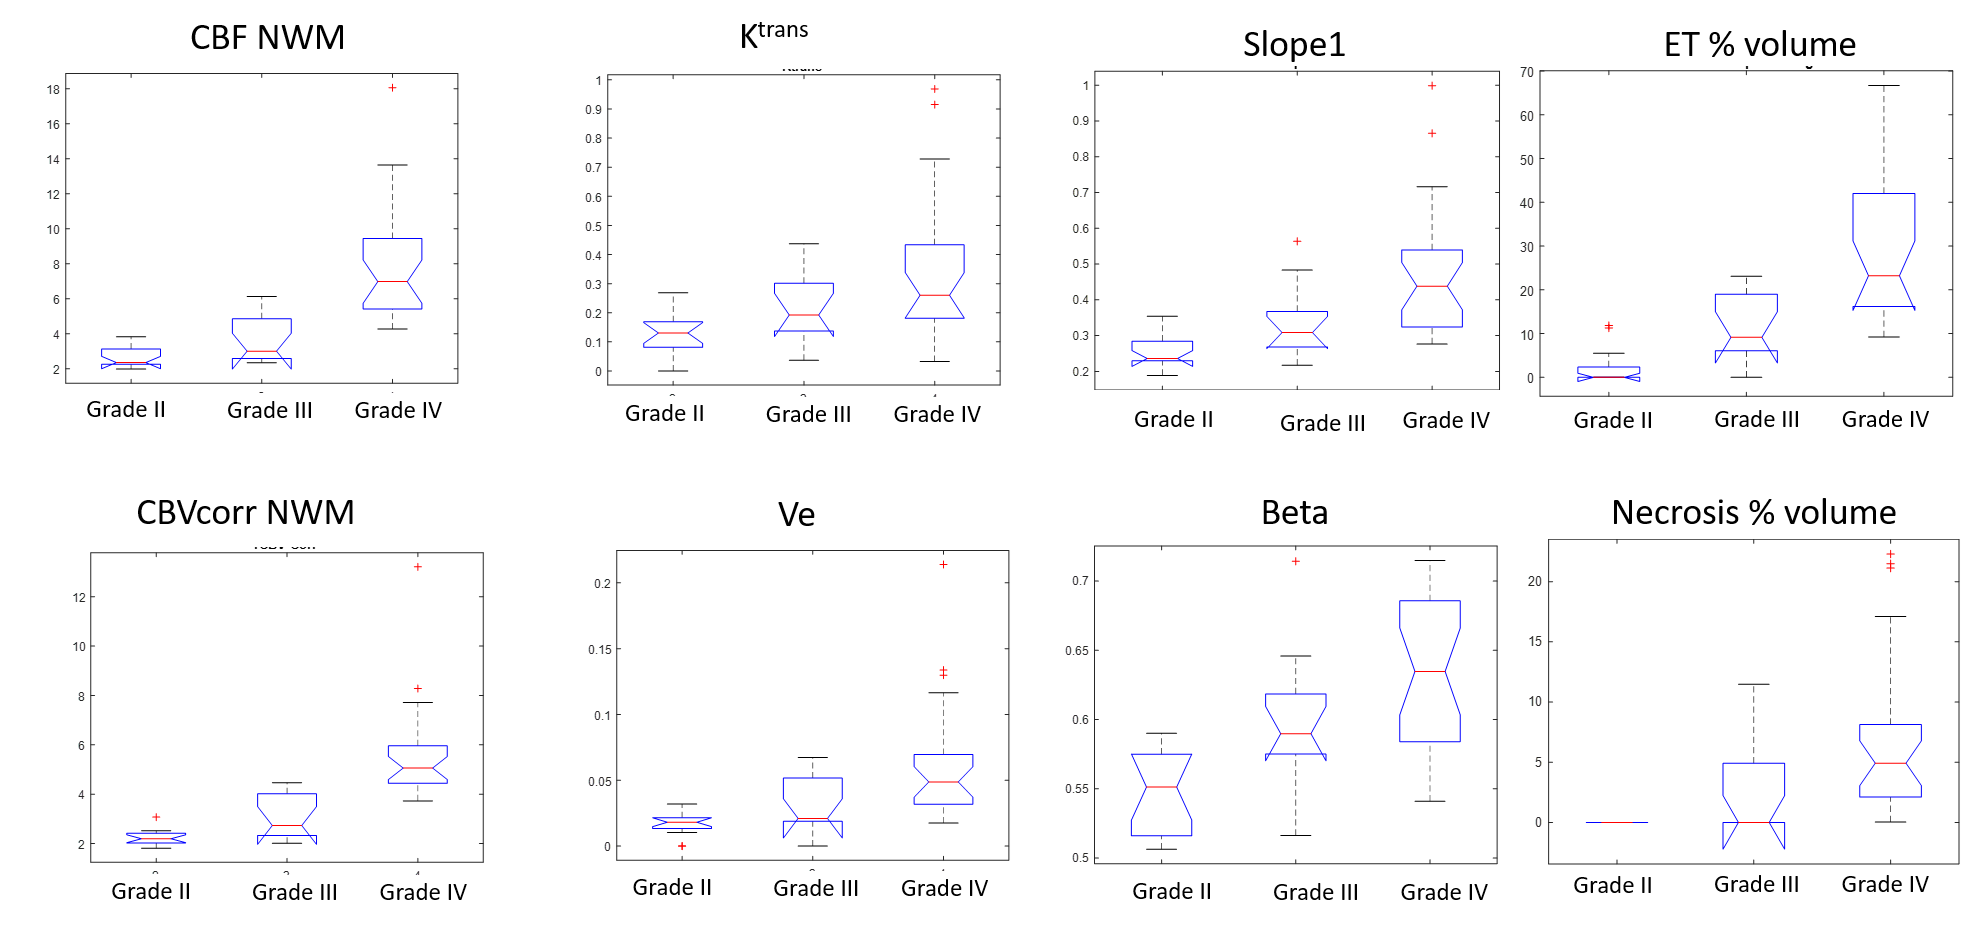
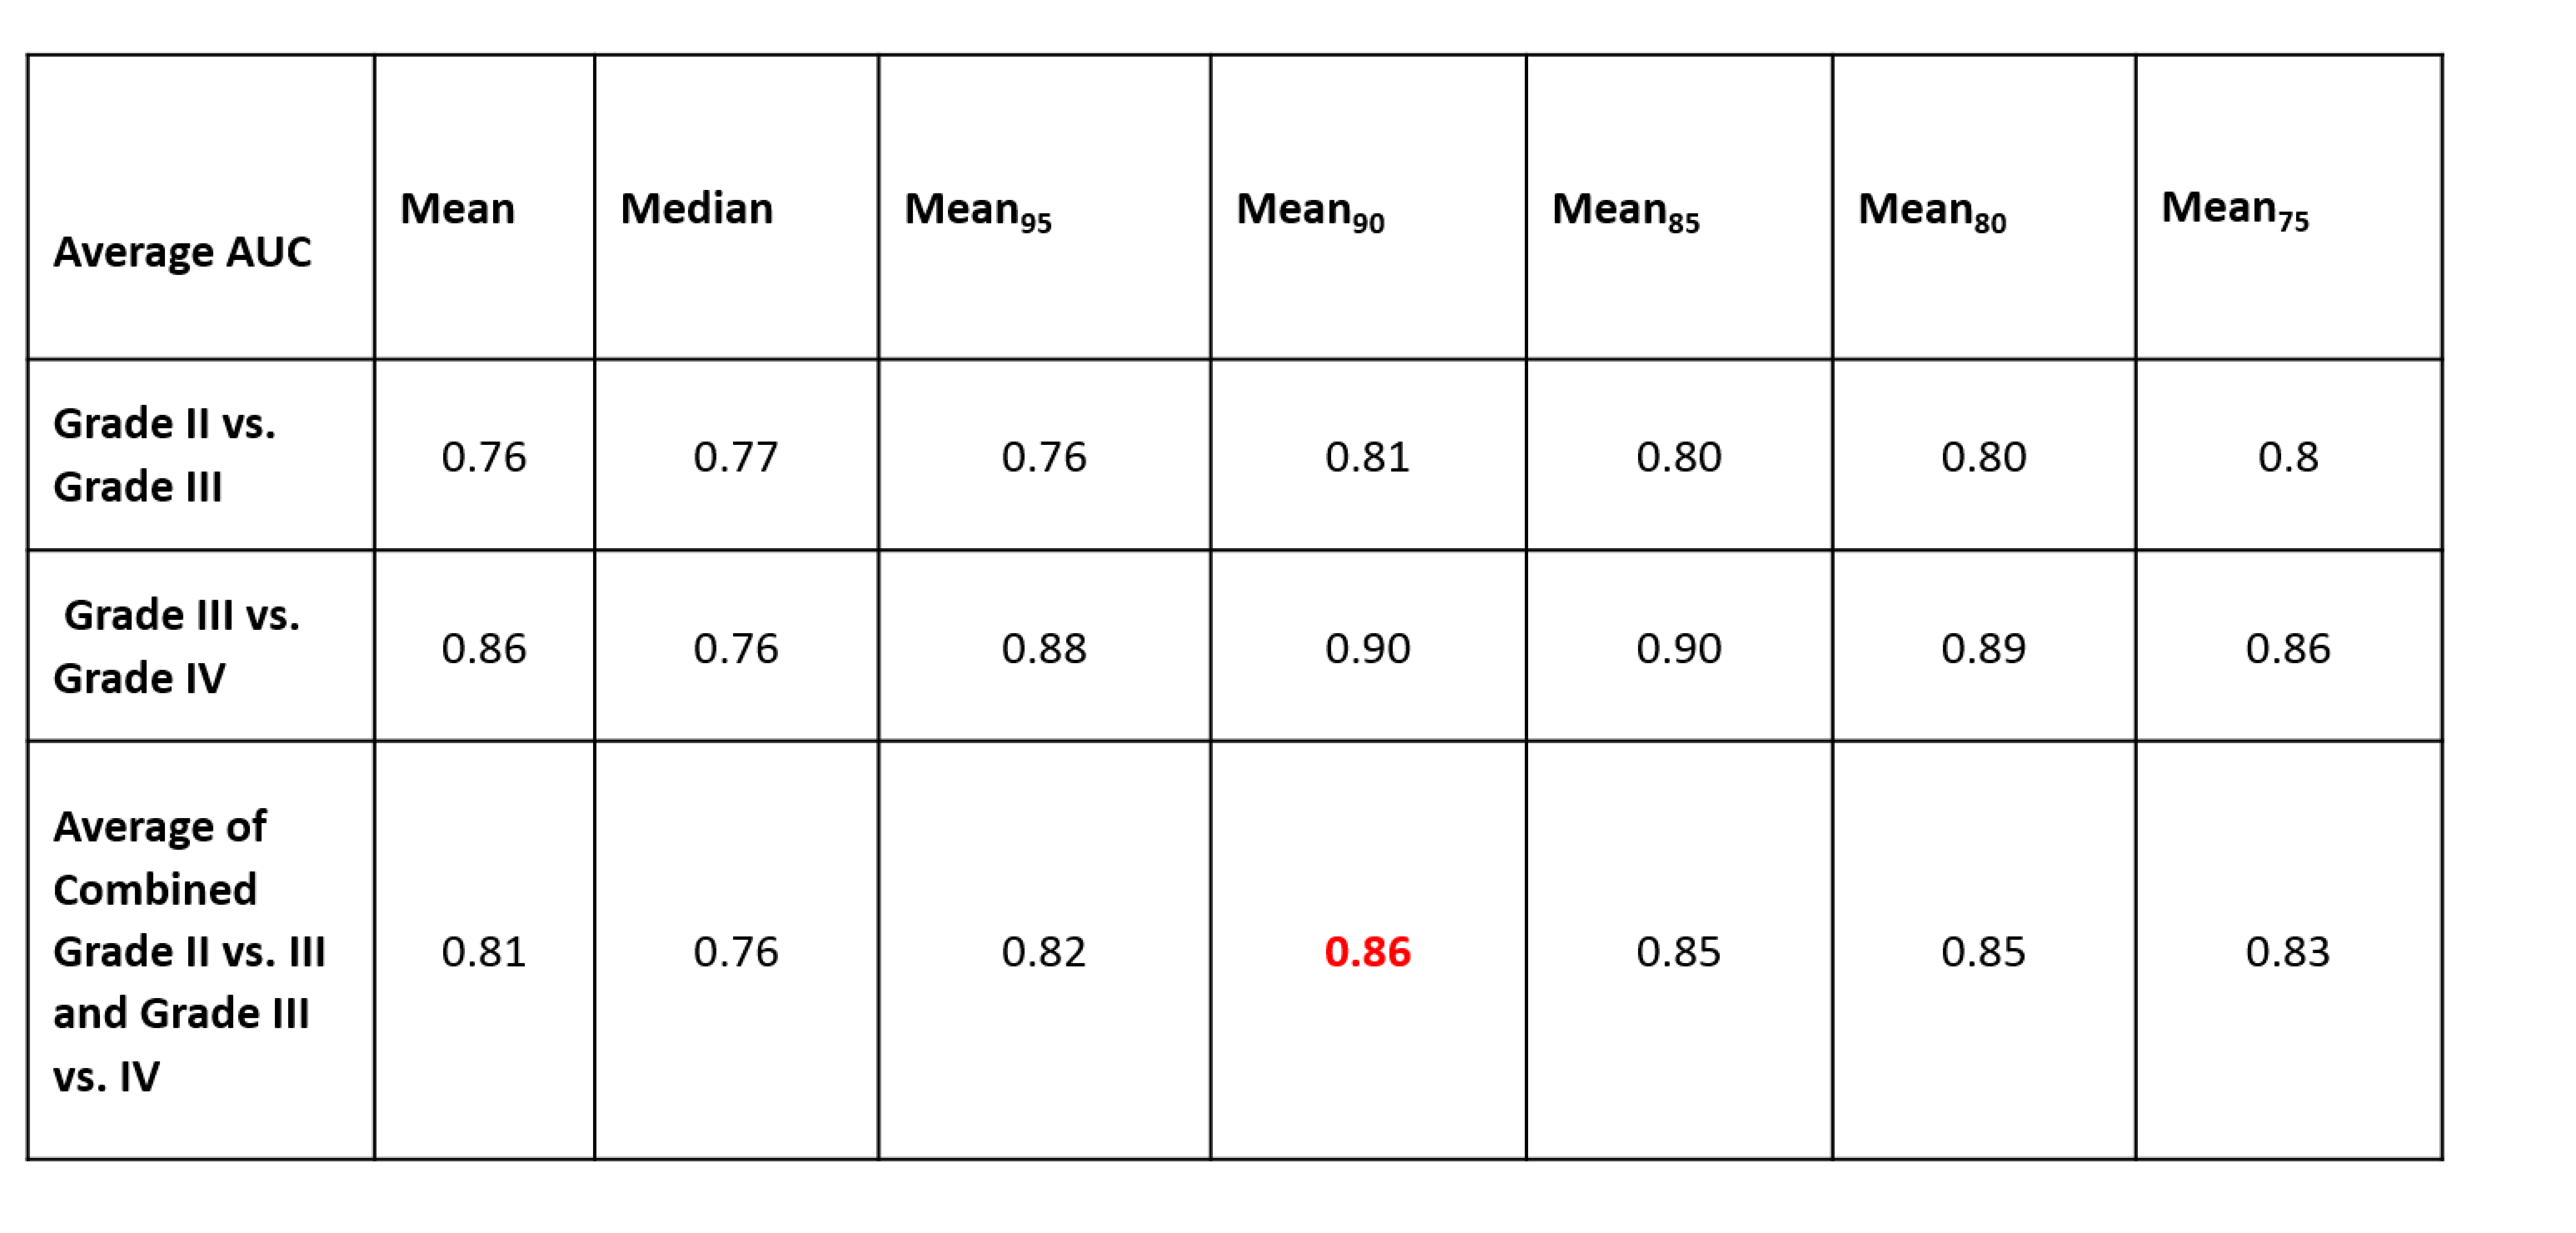
T1 map data and Dynamic contrast-enhanced (DCE)-MRI data from 53 glioma patients (Grade II=15, Grade III=12 and Grade IV=26) were acquired and used in this study. DCE-MRI data was analyzed using leaky tracer kinetic model8, first pass model9 and piecewise-linear model10 to compute tracer kinetic parameters (Ve, Vp, Ktrans, λtrans ), haemodynamic parameters (CBF NWM and CBVcorr NWM) and concentration-time curve parameters such as BAT, BETA, Slope1 and Slope2. After this, segmentation of glioma into enhancing, non-enhancing, edema and necrotic part was done using previously published method11. ROI for glioma grading was selected to be the enhancing + non-enhancing lesion region according to the RANO criteria12 which emphasizes on incorporating the non-enhancing component of the tumor in addition to the enhancing component for treatment purpose (Figure1). CBVcorr NWM maps (obtained by normalizing leakage corrected CBV with white-matter) were used for locating prominent vessels within the lesion region based on their structure. These prominent vessels were segmented out from the ROI (Figure2). To automate and optimize the ‘hot-spot’ selection process, different statistics such as mean, median, mean of the values above the 95th, 90th, 85th, 80th and 75th percentile value (Mean95, Mean90, Mean85, Mean80, Mean75) were obtained for the T1–PMP from the selected ROI over all slices. The statistic to be used was finalized based on the AUC of the ROC analysis obtained using the results of the Support-Vector-Machine (SVM) classifier used for differentiating between intermediate grades. The final feature set to be used for grading constituted the optimized statistic of the T1–PMP obtained from the selected ROI along with the volume percentage of different tumor subparts: Enhancing tumor (ET) %, Edema % and Necrosis %. An SVM classifier was trained and optimized with respect to its hyperparameters (C and γ) for differentiating between intermediate glioma grades as well as multiple glioma grades. SVM based classification was done using combination of all features, optimal features obtained using Sequential-Backward-Selection (SBS) method and also optimal features obtained from Random Forest classifier based on feature importance13. 12 Fold cross-validation (C.V) error of SVM classifier was obtained for each of these feature set.RESULTS
Statistical analysis results showed that there was significant overlap in different features over different grades (Figure3). The results averaged over both the intermediate grade differentiation shows, that the Mean90 statistic, obtained from the T1–PMP from the selected ROI, provided maximal AUC in ROC analysis (Table1). It was found that the Random Forest obtained feature set provided better classification results compared to SBS obtained feature set as well as combination of all features for the SVM classifier and hence was considered as the optimal feature set for this study. A misclassification error of the order 3.7 %, 5.26 % and 9.43 % was obtained for differentiating between Grade II vs. III , Grade III vs. IV and Grade II vs. III vs. IV (Table2) using the optimal feature set .DISCUSSION
One important observation from this study is that volume of different tumor components are useful in the grading of glioma when used in conjunction with T1–PMP. This study also highlights the importance of feature selection and using complementary information from haemodynamic features, tracer-kinetic model features,piecewise-linear model features and volume of tumor components for improved tumor grading.CONCLUSION
The present study shows that differentiation is improved between intermediate glioma grades as well as multiple glioma grades, using the proposed methodology based upon optimized feature set obtained from a combination of quantitative T1–perfusion MRI parameters and volume percentage of tumor components. The proposed methodology can be adopted by doctors for a reliable glioma grading.Acknowledgements
The Authors acknowledge technical support of Philips India Limited in MRI data acquisition. This work was supported by Science and Engineering Research Board (IN) (YSS/2014/000092).References
1. Covarrubias DJ, Rosen BR, Lev MH. Dynamic Magnetic Resonance Perfusion Imaging of Brain Tumors. Oncologist. 2004;9(5):528-537. doi:10.1634/theoncologist.9-5-528
2. Aronen HJ, Gazit IE, Louis DN, et al. Cerebral blood volume maps of gliomas: comparison with tumor grade and histologic findings. Radiology. 1994;191(1):41-51. doi:10.1148/radiology.191.1.8134596
3. Law M, Young R, Babb J, Pollack E, Johnson G. Histogram analysis versus region of interest analysis of dynamic susceptibility contrast perfusion MR imaging data in the grading of cerebral gliomas. AJNR Am J Neuroradiol. 2007;28(4):761-766. doi:28/4/761 [pii]
4. Cha S, Tihan T, Crawford F, et al. Differentiation of low-grade oligodendrogliomas from low-grade astrocytomas by using quantitative blood-volume measurements derived from dynamic susceptibility contrast-enhanced MR imaging. Am J Neuroradiol. 2005;26(2):266-273. doi:10.1016/S0513-5117(08)70342-9
5. Falk A, Fahlström M, Rostrup E, et al. Discrimination between glioma grades II and III in suspected low-grade gliomas using dynamic contrast-enhanced and dynamic susceptibility contrast perfusion MR imaging: a histogram analysis approach. Neuroradiology. 2014;56(12):1031-1038. doi:10.1007/s00234-014-1426-z
6. Zacharaki EI, Wang S, Chawla S, et al. Classification of brain tumor type and grade using MRI texture and shape in a machine learning scheme. Magn Reson Med. 2009;62(6):1609-1618. doi:10.1002/mrm.22147
7. Saini J, Gupta PK, Sahoo P, et al. Jitender Saini, Pradeep Kumar Gupta, Prativa Sahoo, Anup Singh, Rana Patir, Suneeta Ahlawat, Manish Beniwal, K. Thennarasu, et al. 2018;60(1):43-50. doi:10.1007/s00234-017-1942-8
8. Sahoo P, Rathore RKS, Awasthi R, et al. Subcompartmentalization of extracellular extravascular space (EES) into permeability and leaky space with local arterial input function (AIF) results in improved discrimination between high- and low-grade glioma using dynamic contrast-enhanced (DCE) MRI. J Magn Reson Imaging. 2013;38(3):677-688. http://onlinelibrary.wiley.com/doi/10.1002/jmri.24021/full. Accessed June 2, 2016.
9. Singh A, Haris M, Rathore D, et al. Quantification of physiological and hemodynamic indices using T1 dynamic contrast-enhanced MRI in intracranial mass lesions. J Magn Reson Imaging. 2007;26(4):871-880.
10. Singh A, Rathore RKS, Haris M, Verma SK, Husain N, Gupta RK. Improved bolus arrival time and arterial input function estimation for tracer kinetic analysis in DCE-MRI. J Magn Reson Imaging. 2009;29(1):166-176.
11. Sengupta A, Agarwal S, Gupta PK, et al. On Differentiation between Vasogenic Edema and Non-Enhancing Tumor in High-Grade Glioma Patients using Support Vector Machine Classifier based upon Pre and Post Surgery MRI Images. Eur J Radiol. 2018;106:199-208. doi:10.1016/J.EJRAD.2018.07.018
12. Wen PY, Macdonald DR, Reardon DA, et al. Updated response assessment criteria for high-grade gliomas: Response assessment in neuro-oncology working group. J Clin Oncol. 2010;28(11):1963-1972. doi:10.1200/JCO.2009.26.3541 13. Breiman L. Random Forests. Mach Learn. 2001;45(1):5-32. doi:10.1023/A:1010933404324
Figures