3068
Enhanced isocitrate dehydrogenase mutation classification in lower grade gliomas with deep learning and CEST and MTC MRI1Department of Radiology, Johns Hopkins University, School of Medicine, Baltimore, MD, United States, 2Whiting School of Engineering, Johns Hopkins University, Baltimore, MD, United States, 3Zhujiang Hospital,Southern Medical University, guangzhou, China
Synopsis
we assess the feasibility of using molecular MRI with deep learning to differentiate IDH mutation status in patients with lower grade gliomas. Two separate deep learning models were used to analyze routine MRI and molecular MRI, and then, a combined model was also devised. 18% and 11% higher AUCs were obtained by the combined system, with respect to the routine MRI subsystem and the molecular MRI subsystem, respectively. Molecular MRI with deep learning algorithm demonstrated a great potential to diagnose IDH mutation status, which could be implemented as a robust approach to enhance routine MRI classification performance.
Introduction
We assess the feasibility of using molecular MRI with deep learning to differentiate IDH mutation status in patients with lower grade gliomas. Two separate deep learning network were used to analyze routine MRI and molecular MRI separately, and a third, combined model was also devised. The combined system yielded 18% and 11% higher AUCs with respect to the routine-MRI based subsystem and the molecular MRI based subsystem, respectively. Molecular MRI with deep learning based classification demonstrated a great potential to diagnose IDH mutation status, which could be implemented as a robust approach to enhance routine MRI classification performance.Materials and methods
Subjects: 84 treatment-naive patients with histopathologically confirmed grade-II or -III gliomas and IDH1/2 mutation status were enrolled. The average age is 41.0±12.4 years old. Each patient had intact molecular MR images (CEST@3.5ppm or amide proton transfer-weighted (APTw); CEST@2ppm; and MTC). 48 cases were grade II gliomas, and 36 cases were grade III gliomas. 33 cases were IDH-wildtype, while 51 cases were IDH-mutant.
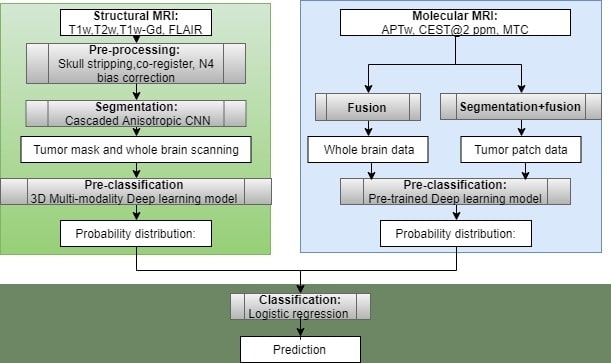
Data preparation: The data flow of this study is depicted in Figure 1. The datasets of 84 patients were used as 3 separate data sets: (a) a subset of 39 cases with routine MRI for routine MRI based subsystem; (b) all 84 cases with molecular MRI for the molecular MRI based subsystem and (c) a subset of 39 cases with intact routine MRI and molecular MRI for the whole combined system. In the routine MRI subsystem, the 39 individual routine MR images were super-sampled at three randomly selected tumor intersection-size percentile (50th, 75th, and 100th percentiles); thus, there are 117 samples in total.
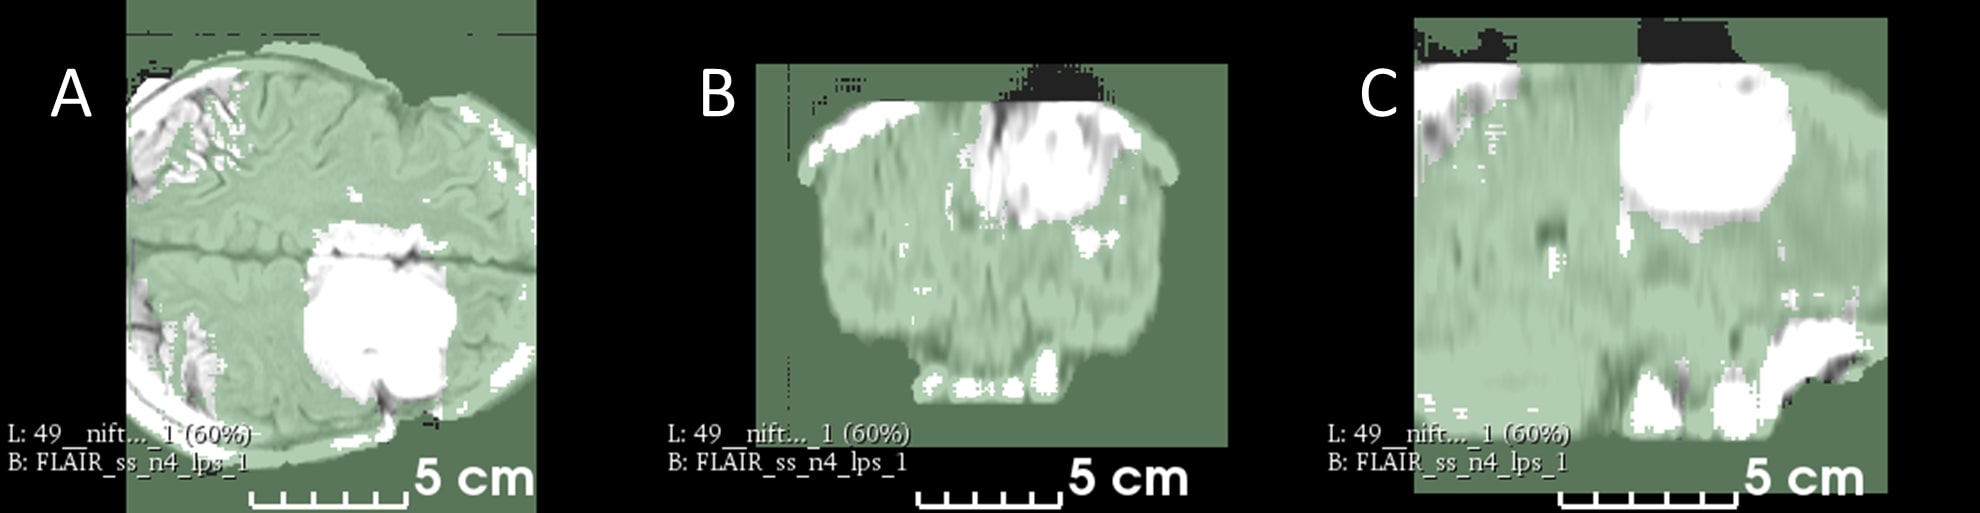
To utilize and optimize the trained ResNet deep learning model, we performed the following procedure on all routine MRI volumes (T1, T2, FLAIR, T1 contrast) in each sample: resampled all routine MRI volume to 1 mm3 cubic; co-registered each volume to T1 contrast images; and normalized the intensity base on interquartile range of intensity of normal brain. Cascaded Anisotropic Convolutional Neural Networks4 was implemented for automate tumor segmentation (Figure 2).
In molecular MRI subsystem, APTw, CEST@2ppm and MTC MR images were co-registered to generate a three-color-channel image for each case. Each channel was filled with intensity matrix of one image modality. Then, a loosely fitted bounding box was drawn around the refined “tumor area” in routine MRI segmentation.
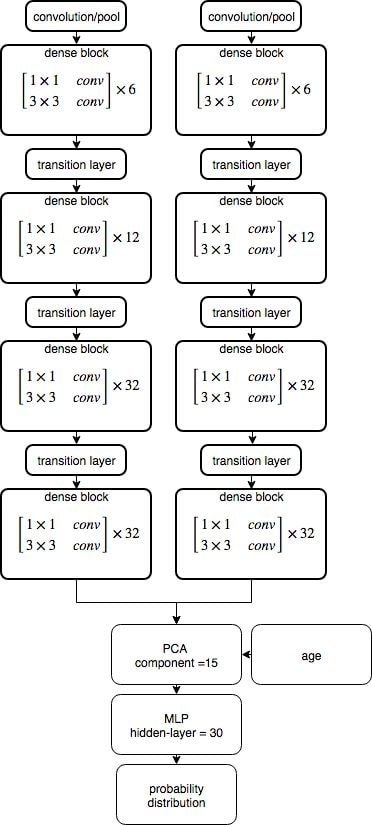
Combined deep learning system:The pre-classification block in the routine MRI subsystem is a ‘deep copy’, containing all parameters in the deep learning model from the work of Ken Chan et al.2 Considering Ken’s model was trained to perform the same task as ours, we used it as a fixed feature extractor for routine MRI data. The pre-classification module in the molecular MRI subsystem was freshly trained using internal molecular MRI data. We used DenseNet169 as a pretrained model to extract features from both the local patch and whole brain. To get the probability distribution from DenseNet features, 30 features were selected using the principle component analysis (PCA) together with age. The reduced feature vector was then fed through a multilayer perceptron classifier (MPC). The probability distribution of IDH mutation status from both subsystems was used as input to a logistic regression. Each subsystem is capable of individually generating a probability distribution; thus, the performance of two subsystems and the whole combined system was evaluated respectively (Figure 3).
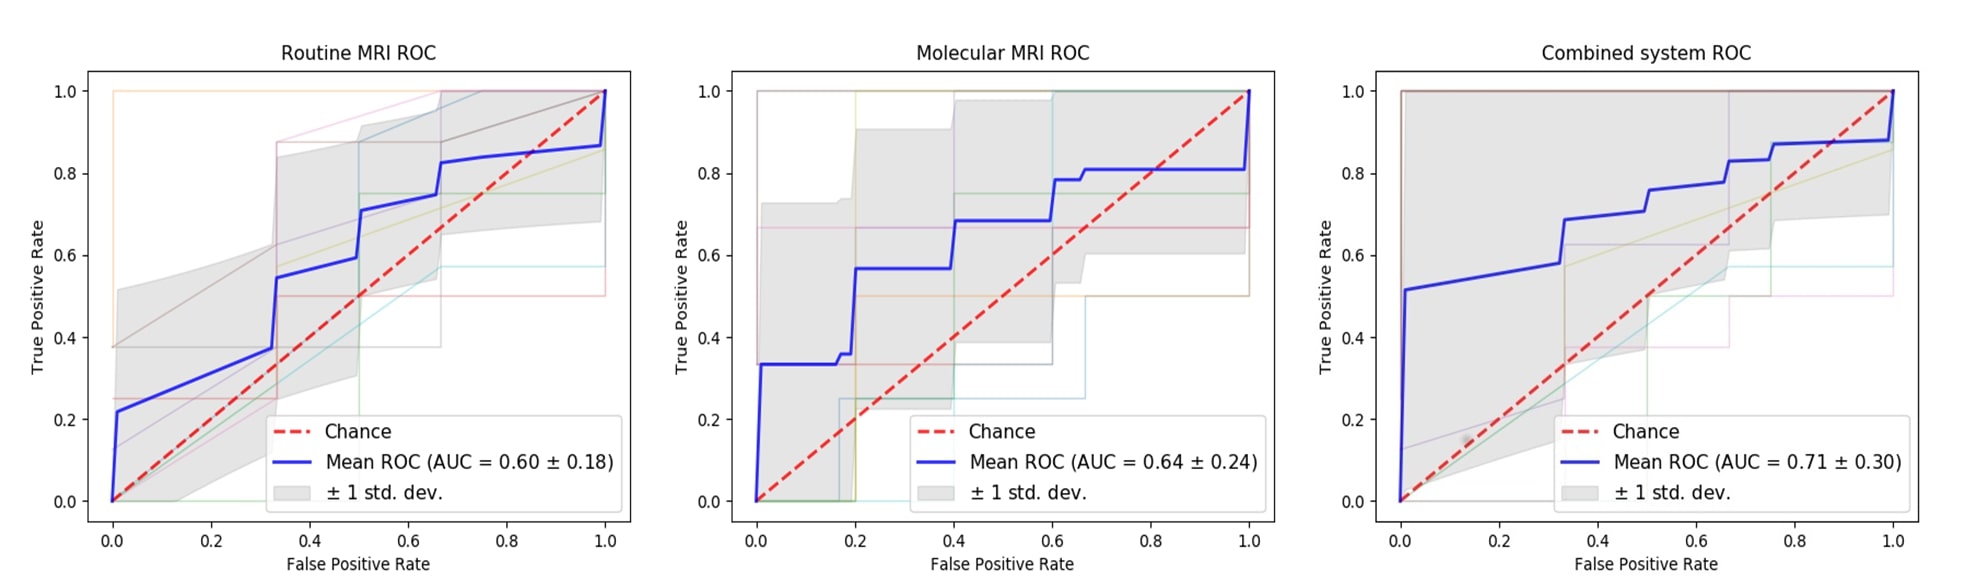
Statistics:Specificity, sensitivity and AUC were evaluated by using 10 folds cross-validation of all three DenseNet systems. Notably, for the combined system ROC, each super-sampled routine MRI was concatenated with a molecular MRI sample that originated from the same patient case; thus, there were also 117 samples involved in the evaluation of the combined system.
Results and discussion
DenseNet is a deep learning algorithm, which has been chosen due to following properties: strengthened feature propagation, reduced number of parameters, and encouraged feature reuse.5 In our study, the DenseNet deep learning model yielded sensitivities of 0.71, 0.68 and 0.78 for the routine MRI model, molecular MRI model and the combined model, respectively, while the specificity was 0.49 for all three DenseNet systems. 18% and 11% higher AUCs were obtained by the combined system, with respect to the routine MRI subsystem and the molecular MRI subsystem, respectively (Figure 4).Conclusions
We showed that molecular MRI data can serve as a promising way to enhance state-of-the-art routine MRI based glioma IDH classification using deep learning. The less professional-demanding classification pipeline with APTw, CEST@2 ppm and MTC MR images has a great potential to decode IDH mutation status, especially for patients who suffer from high risks with the invasive diagnostic surgery.Acknowledgements
No acknowledgement found.References
1. Kloosterhof NK, Bralten LBC, Dubbink HJ, French PJ, van den Bent MJ. Isocitrate dehydrogenase-1 mutations: a fundamentally new understanding of diffuse glioma? Lancet Oncol. 2011;12(1):83-91.
2. Chang K, Bai HX, Zhou H, et al. Residual convolutional neural network for the determination of IDH status in low- and high-grade gliomas from mr imaging. Clin Cancer Res. 2018;24(5):1073-1081. doi:10.1158/1078-0432.CCR-17-2236
3. Zhou J, Lal B, Wilson DA, Laterra J, Van Zijl PCM. Amide proton transfer (APT) contrast for imaging of brain tumors. Magn Reson Med An Off J Int Soc Magn Reson Med. 2003;50(6):1120-1126.
4. Wang G, Li W, Ourselin S, Vercauteren T. Automatic brain tumor segmentation using cascaded anisotropic convolutional neural networks. In: Lecture Notes in Computer Science (Including Subseries Lecture Notes in Artificial Intelligence and Lecture Notes in Bioinformatics). Vol 10670 LNCS. ; 2018:178-190. doi:10.1007/978-3-319-75238-9_16
5. Huang G, Liu Z, Van Der Maaten L, Weinberger KQ. Densely Connected Convolutional Networks. In: CVPR. Vol 1. ; 2017:3.
6. Menze BH, Jakab A, Bauer S, et al. The Multimodal Brain Tumor Image Segmentation Benchmark (BRATS). IEEE Trans Med Imaging. 2015;34(10):1993-2024. doi:10.1109/TMI.2014.2377694
Figures