3063
Alzheimer’s disease progressively weakens the face-processing network1Department of Radiology, Michigan State University, East Lansing, MI, United States, 2Department of Neurology, Emory University School of Medicine, Atlanta, GA, United States, 3Department of Neurology, Michigan State University, East Lansing, MI, United States, 4Department of Psychology, Michigan State University, East Lansing, MI, United States
Synopsis
A functional area of unitary pooled activity (FAUPA) is defined as an area in which the temporal variation of the activity is the same across the entire area. Using the signal time course of a task-associated FAUPA may identify the functional network specific for the task, and comparing these task-specific networks between healthy controls and those with neurologic diseases may reveal the relationship between task-specific networks and the disease. A cardinal manifestation of later-stage Alzheimer’s disease (AD) is the progressive disintegration of biographical memory and semantic knowledge. This study found an association of task-specific network disruption with AD severity.
Introduction
We recently reported the discovery of functional areas of unitary pooled activity (FAUPAs) with fMRI1. A FAUPA is defined as an area in which the temporal variation of the activity is the same across the entire area, and we used new techniques to identify FAUPAs that involved the iterative aggregation of voxels dependent upon their intercorrelation2. The determination of FAUPA is objective and automatic with no requirement of a priori knowledge of the activity-induced ideal response signal time course, and this method enables us to identify FAUPAs that are associated with a specific task1. Using the signal time course of a task-associated FAUPA may identify the functional network specific for the task, and comparing these task-specific networks between healthy controls and those with neurologic diseases, such as Alzheimer’s disease (AD), may reveal the relationship between task-specific networks and the disease. A cardinal manifestation of later-stage Alzheimer’s disease (AD) is the progressive disintegration of biographical memory and semantic knowledge3,4. In later-stage disease, individuals may no longer recognize close family members, and some severely affected patients even lose the ability to recognize themselves in a mirror or photograph, indicating a progressive decoupling of self-related knowledge from consciousness. In this study, we investigated the association of task-specific network disruption with AD severity during passive viewing of self, familiar, and unfamiliar face pictures.Methods and Materials
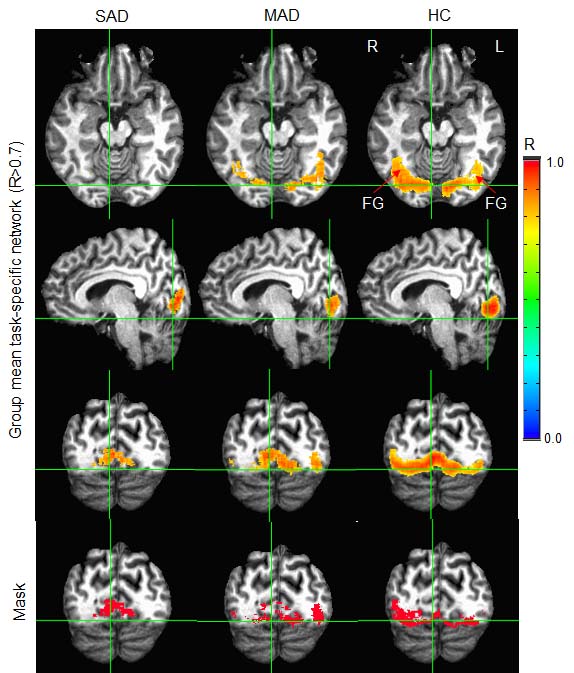
Eight severe AD (SAD) patients (6 female, ages from 55 to 85), 11 mild AD (MAD) (7 female, ages from 67 to 86), and 26 healthy controls (HC) (18 female, ages from 55 to 89) participated in the study. Each participant undertook a task-fMRI including three 6-min runs. The task paradigm consists of a total of 9 trials with each of 3 different conditions: viewing familiar faces, unfamiliar faces and a recent self-photo taken from different angles (Fig. 1, top panel). Each trial is comprised of a 25-s task period followed by a 15-s rest period. During the task period, one face picture is presented for 5 s with a total of 5 pictures presented. Functional brain images were acquired on a GE 3T clinical scanner with an 8-channel head coil using a GE-EPI pulse sequence (TR=2500ms, voxel size 3.44×3.44×3.0mm3). Thirty-eight axial slices to cover the cerebral cortex were scanned. A standard image preprocessing1 including spatial filtering (FWHM 4mm) and bandpassing (0.009-0.08Hz) was performed using AFNI5. A statistical model and Matlab-based software algorithms have been developed and tested to identify FAUPA2. For each subject, a task-associated FAUPA in the putative V1 was identified (Fig. 1, middle panel), and then its signal time course was used as a reference function to compute the Pearson correlation coefficient (R) map in the original space. Then, all R maps were converted to the Talairach space using AFNI for group analysis. For each group, the mean R map was thresholded with R>0.7 to yield a task-specific network for the group (Fig. 2, top three panels). To compare the task-specific network among the three groups, we generated three group-specific masks. A SAD mask composes the task-specific network of the SAD patients alone; a MAD mask composes the task-specific network of the MAD patients excluding the SAD mask; and a HC mask composes the task-specific network of the HC excluding both MAD and SAD masks (Fig. 2, bottom panel).Results and Discussion
Based on the task paradigm and the task-induced BOLD signal changes, a task-associated FAUPA in the putative primary visual area (V1) was identified for each participant (Fig. 1). The group-mean signal time course reflects the task paradigm and shows a similar behavior for the HC, MAD and SAD patients. Fig. 2 illustrates the identified task-specific networks for the HC, MAD and SAD patients, respectively. The task-specific network of the HC was disrupted and reduced in MAD patients, and even more so in SAD patients, indicating an association of a gradual disruption and reduction to the task-specific network with disease progression. Quantitative assessment of the three group-specific masks shows a significant reduction in R between each successive pair of groups (Fig. 3). The fusiform gyrus is selectively involved in face perception6, and a facial feature processing-related task-specific network disruption in this area would most likely affect the perception of faces. These results demonstrate the potential of using task-specific network disruption analyses to characterize progressive brain activation reductions in AD. Task-associated FAUPAs were identified for each individual participant and any potential variation of individual task response was taken into account; thus individually determined task-specific networks may provide a more reliable measure to objectively assess disease-specific and clinically relevant network variations.Acknowledgements
No acknowledgement found.References
1. Huang, J. Human brain functional areas of unitary pooled activity discovered with fMRI. Sci Rep 8, 2388, doi:10.1038/s41598-018-20778-3 (2018).
2. Huang, J. Method and system for determining brain-state dependent functional areas of unitary pooled activity and associated dynamic networks with functional magnetic resonance imaging. United States Patent and Trademark Office, PCT Application (PCT/US2018/019819), filing data: February 27 (2018).
3. Mograbi, D. C., Brown, R. G. & Morris, R. G. Anosognosia in Alzheimer's disease--the petrified self. Conscious Cogn 18, 989-1003, doi:10.1016/j.concog.2009.07.005 (2009).
4. Weiler, M., Northoff, G., Damasceno, B. P. & Balthazar, M. L. F. Self, cortical midline structures and the resting state: Implications for Alzheimer's disease. Neurosci Biobehav Rev 68, 245-255, doi:10.1016/j.neubiorev.2016.05.028 (2016).
5. Cox, R. W. AFNI: software for analysis and visualization of functional magnetic resonance neuroimages. Comput Biomed Res 29, 162-173 (1996).
6. Kanwisher, N., McDermott, J. & Chun, M. M. The fusiform face area: a module in human extrastriate cortex specialized for face perception. J Neurosci 17, 4302-4311 (1997).
Figures