3062
Multimodal microscopic imaging of iron accumulation and oxidation state in the Alzheimer’s disease hippocampus1Stanford University, Stanford, CA, United States, 2SLAC National Accelerator Laboratory, Menlo Park, CA, United States
Synopsis
Recent evidence suggests that iron, specifically ferrous Fe2+, may produce oxidative stress in Alzheimer’s disease (AD). However, there remains a gap in our understanding of the progression of iron deposition and its oxidation state. Here, we use X-ray fluorescence imaging (XFI), absorption spectroscopy (XAS), and ultra-high resolution ex vivo MRI in human AD specimens to show that elevated levels of iron correlate with disease severity and to demonstrate that elevated levels of ferrous Fe2+ are present in AD, supporting a neuroinflammatory mechanism. This supports the further development of iron-sensitive MRI as an AD biomarker.
Introduction
Recent studies suggest that inflammation is an important factor in Alzheimer’s disease (AD) pathogenesis, but inflammation is challenging to image in vivo. Iron accumulation is a key component of inflammation, and recent evidence suggests that specifically ferrous Fe2+ is increased in AD and may be a source of oxidative stress, possibly providing a mechanistic link to disease progression. Our published data show that iron may be a surrogate for inflammation and that iron-containing microglia in the AD hippocampus can be detected by correlative ex vivo MRI- histology.1 However, at present, we lack conclusive evidence that an altered oxidation state (Fe2+ vs. Fe3+) correlates with inflammation in AD iron-deposition as measured by MRI. In this study, we use high-resolution ex vivo MRI along with X-ray fluorescence imaging (XFI) and absorption spectroscopy (XAS) to locate and characterize the oxidation state of iron deposits in human AD hippocampal specimens.Methods
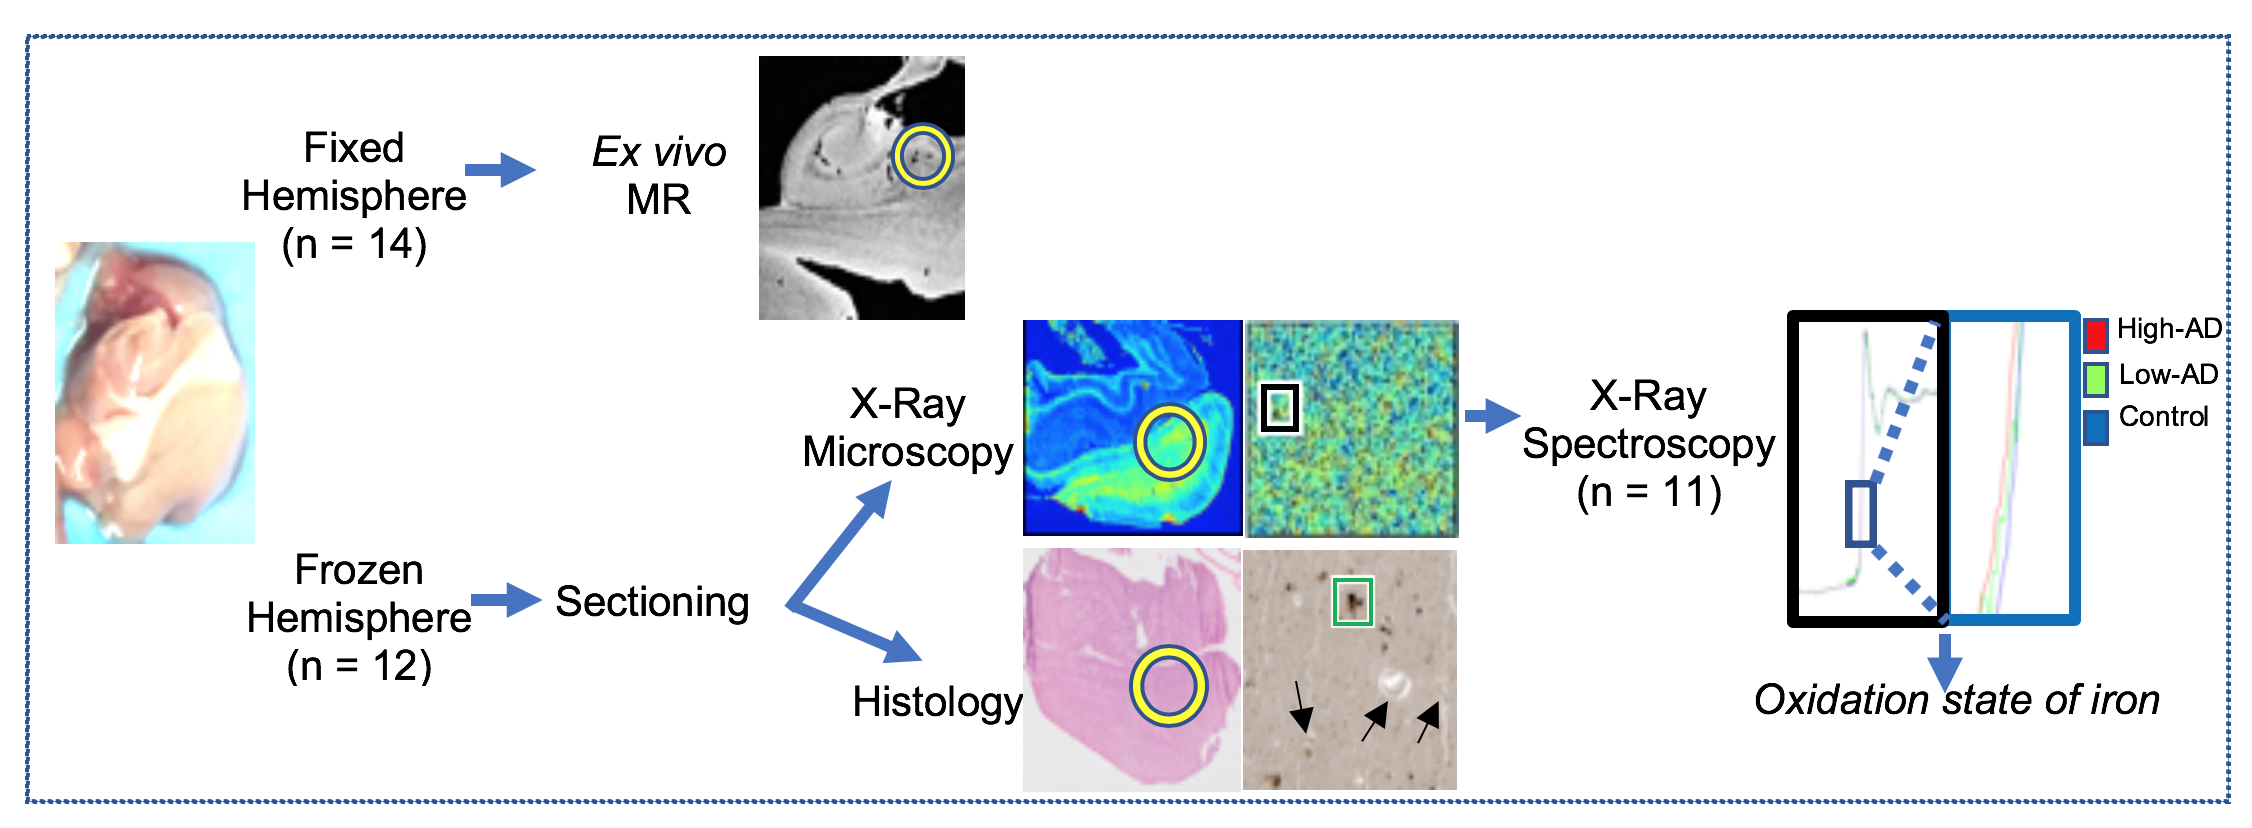
Samples: Frozen and fixed hippocampi were acquired from AD and control subjects (total n=21) from the Stanford Neuropathology Core affiliated with the Stanford Alzheimer’s Disease Research Center.
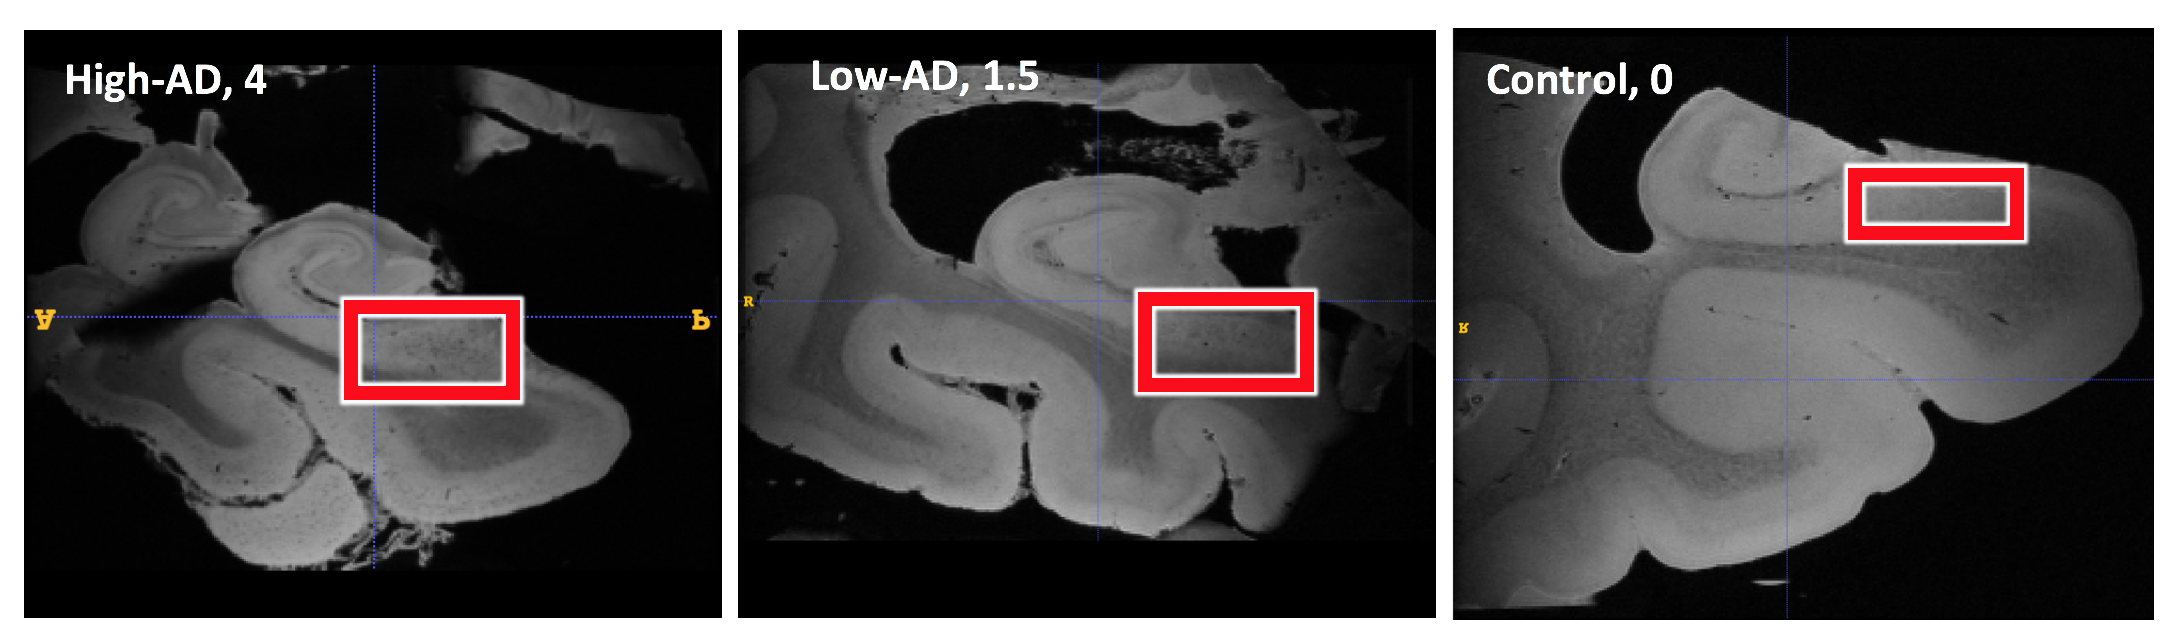
MRI: Fixed hippocampi from 14 patients total, stratified as high AD pathology (n=6), low AD pathology (n=2), and non-AD controls (n=6) (Fig. 1), were immersed in fomblin in a plastic tube. Using a Bruker 7T scanner and small-bore millipede coil, ultra-high resolution 3D single-echo gradient echo (0.1mm isotropic, FA=20, TR=50, TE=8.65, 3NEX) was acquired on each specimen. A visual rating scale based on the dynamic range of our positive AD cases and negative controls from our published data1 was used by a blinded neuroradiologist to assess the presence of focal hypointensities within the subiculum, the region of highest iron deposition in all specimens, and compared using unpaired t-tests.
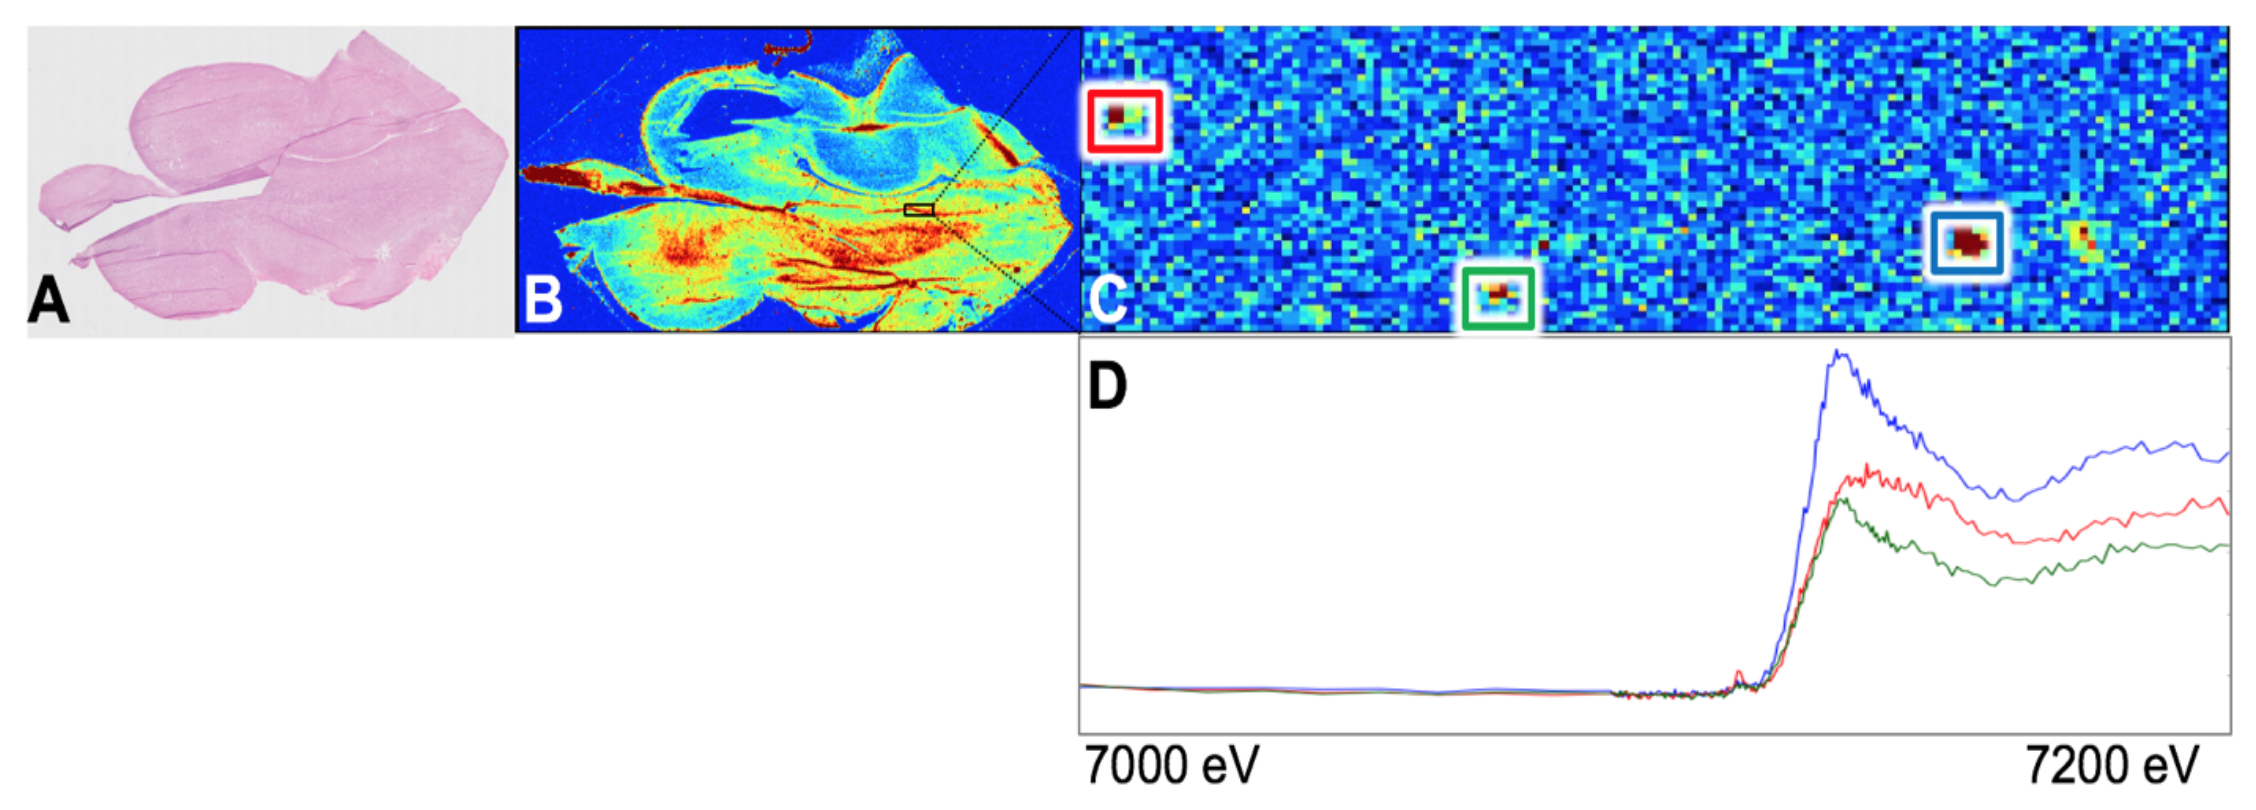
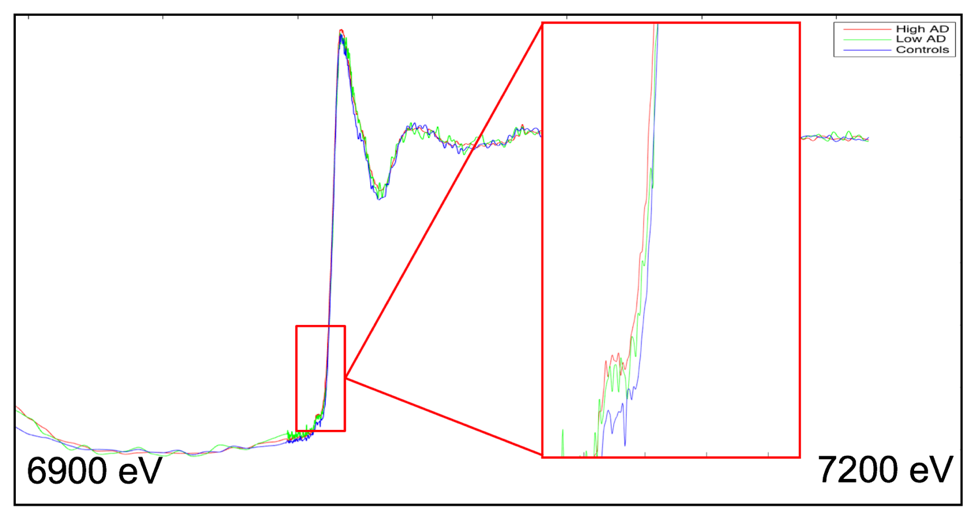
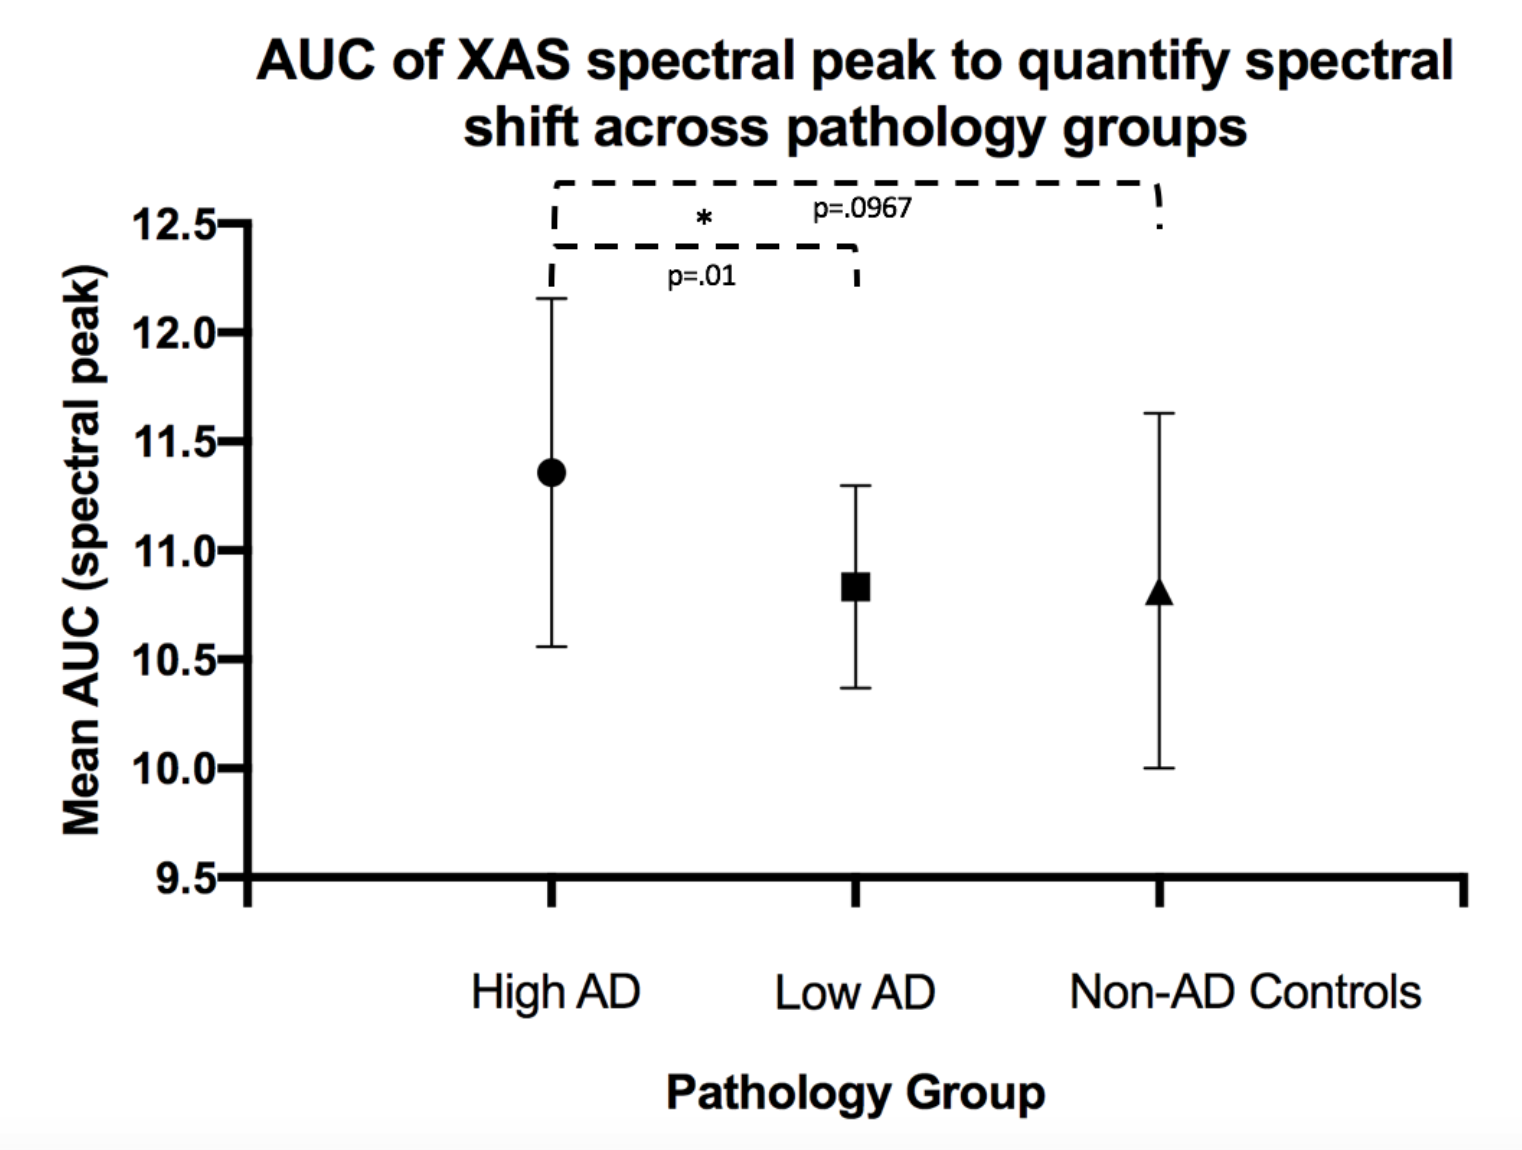
X-Ray Microscopy: Frozen hippocampi were acquired from 12 patients total, stratified as high AD pathology (n=8), low AD pathology (n=2), and non-AD controls (n=2) (Fig. 1). Samples were frozen-sectioned at 30um slice-thickness. XFI and XAS were performed at SLAC National Accelerator Laboratory (Menlo Park, CA). Whole-slide XFI was obtained at 50μm in-plane resolution on all specimens. ROIs were imaged at higher resolution to guide XAS on 11/12 specimens (total of 39 high AD, 11 low AD, and 9 control deposits). Increased concentrations of ferrous Fe2+ are expected to produce a spectral left-shift. To quantify the spectral shift in each deposit, the area under the curve (AUC) from 7113-7130 keV was computed and compared via unpaired t-tests.
Results
MRI: Our visual rater analysis found a statistically significantly elevated mean iron load in high AD specimens (2.42) compared to non-AD control specimens (.1667) (p=0.0012) and a trend towards elevated iron loads in high AD compared to low AD (mean=.75, p=1243) (Fig. 2).
X-Ray Microscopy: Iron-rich regions were identified in all specimens by whole-slide XFI, spatially distinct from edges, tissue tears, or blood vessels (Fig. 3 A-B). These scans were followed by higher resolution scans to guide XAS analysis (Fig. 3 C-D). XAS curves averaged across all deposits demonstrated a spectral shift to the left (suggestive of increased ferrous Fe2+) as AD pathology increased (Fig. 4). Deposits from high AD pathology specimens show statistically significantly elevated mean AUC compared to deposits from low AD pathology specimens (p=.01) and a trend towards elevated mean AUC compared to control deposits (p=.0967) (Fig. 5). No difference was observed between low AD and control deposits.
Discussion
Our preliminary ex vivo MRI data show statistically significant elevations in focal subicular hypointensitites between high AD and non-AD control specimens, suggesting increased iron accumulation in the AD hippocampus. Our XFI and XAS data confirm the presence of iron in the AD hippocampus and suggest elevated levels of ferrous Fe2+ in the AD hippocampus compared to controls.
Conclusion
The suggestion of elevated levels of ferrous Fe2+ in our samples provides further support for the hypothesis that pathological iron accumulation is a source of oxidative stress in AD. Future work will achieve full quantification by integrating spectroscopy on standards with known Fe2+/Fe3+ ratios. We will also directly coregister the existing data across modalities, analyze additional specimens from control and low-AD cohorts, and correlate with traditional histologic measures of amyloid, tau, and markers of inflammation. Iron-sensitive MRI may serve as a biomarker of inflammatory AD pathology.
Acknowledgements
The authors would like to acknowledge the continued support of the Stanford Alzheimer’s Disease Research Center (ADRC) for this research.References
1. Zeineh, M. M., Chen, Y., Kitzler, H. H., Hammond, R., Vogel, H., & Rutt, B. K. (2015). Activated iron-containing microglia in the human hippocampus identified by magnetic resonance imaging in Alzheimer disease. Neurobiology of aging, 36(9), 2483-2500.Figures